
Impact Investing Market Size and Share
Market Overview
| Study Period | 2020 - 2031 |
|---|---|
| Market Size (2026) | USD 1.57 Trillion |
| Market Size (2031) | USD 2.19 Trillion |
| Growth Rate (2026 - 2031) | 6.83 % |
| Fastest Growing Market | Asia Pacific |
| Largest Market | Europe |
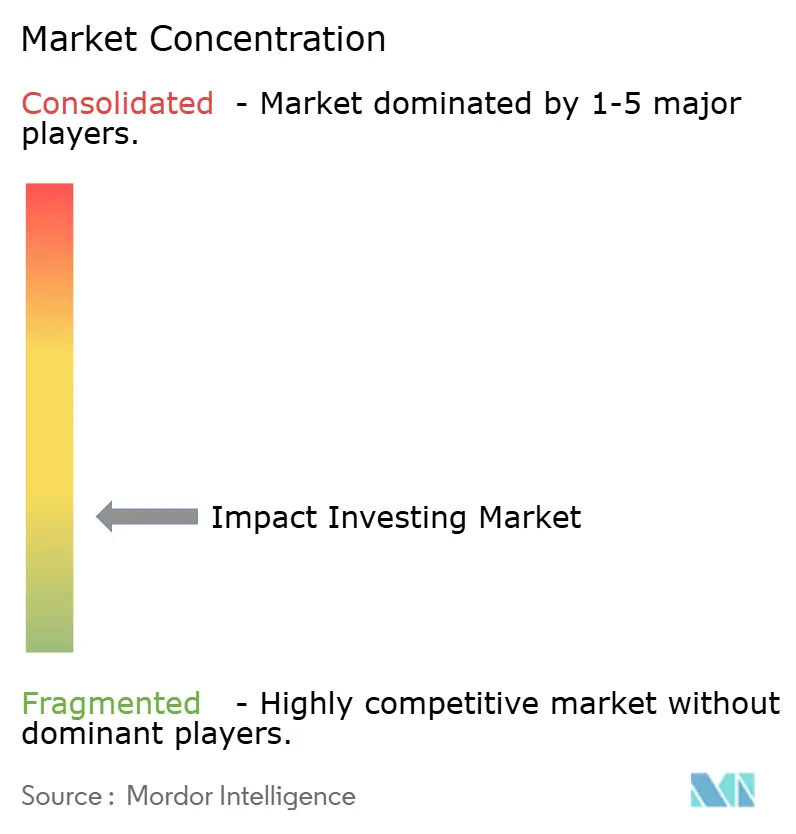
| Market Concentration | Low |
Major Players *Disclaimer: Major Players sorted in no particular order Image © Mordor Intelligence. Reuse requires attribution under CC BY 4.0. | |
Impact Investing Market Analysis by Mordor Intelligence
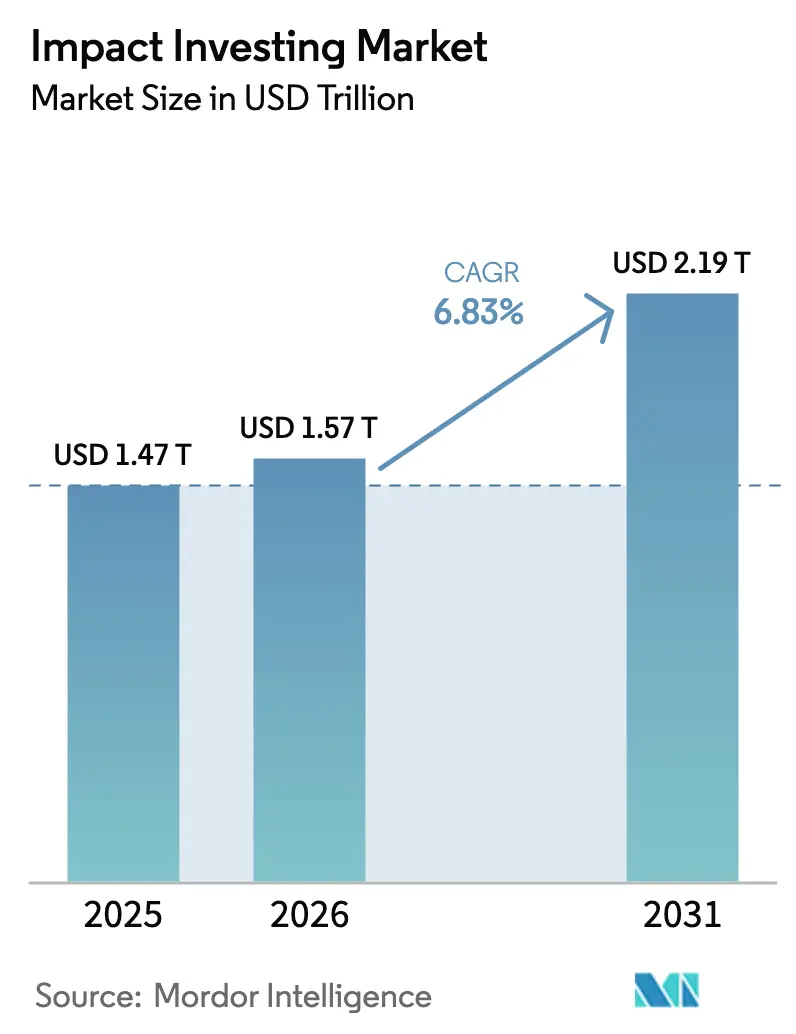
Impact Investing Market size in 2026 is estimated at USD 1.57 trillion, growing from 2025 value of USD 1.47 trillion with 2031 projections showing USD 2.19 trillion, growing at 6.83% CAGR over 2026-2031.
The numbers confirm the shift from philanthropic origins toward a core institutional allocation strategy that now shapes mainstream portfolio construction across developed economies. Mandatory sustainability disclosure rules, expanding sovereign green bond programs, and rising demand for measurable outcomes are aligning regulatory signals and investor behavior, creating strong tailwinds for the impact investing market. Private equity is gaining traction as the preferred vehicle for deep impact measurement, while technology-enabled fund distribution improves retail access and feeds fresh liquidity into the ecosystem. Fragmented competition, combined with persistent exit-market constraints, is setting the stage for both consolidation and innovation as specialist managers seek scale through acquisitions and tokenization platforms.
Key Report Takeaways
- By asset class, public equity and debt instruments led with 34.32% revenue share of the impact investing market in 2025, while private equity is forecast to grow at 11.03% CAGR through 2031.
- By investor type, institutional investors held 41.92% of the impact investing market share in 2025, and individual investors are projected to expand at 10.38% CAGR to 2031.
- By end-use sector, renewable energy controlled 23.08% of the impact investing market size in 2025; sustainable agriculture is on track for a 9.33% CAGR between 2026 and 2031.
- By geography, Europe accounted for 33.21% of the impact investing market in 2025, while Asia Pacific is set to register an 8.70% CAGR over the same period.
Note: Market size and forecast figures in this report are generated using Mordor Intelligence’s proprietary estimation framework, updated with the latest available data and insights as of 2026.
Market Trends and Insights
Drivers Impact Analysis of Impact Investing Market*
| Driver | (~) % Impact on CAGR Forecast | Geographic Relevance | Impact Timeline |
|---|---|---|---|
| Mainstream ESG regulation mandates | +1.8% | Global, led by EU and North America | Medium term (2-4 years) |
| Institutional portfolio re-allocation to private impact vehicles | +1.5% | Global, concentrated in developed markets | Long term (≥ 4 years) |
| Retail wealth platforms adding impact sleeves | +1.2% | North America, Europe, APAC urban centers | Short term (≤ 2 years) |
| Outcome-based blended-finance structures de-risking returns | +0.9% | Emerging markets, spill-over to developed | Medium term (2-4 years) |
| Tokenised impact funds lowering entry tickets | +0.7% | Global, early adoption in tech-forward markets | Short term (≤ 2 years) |
| Climate-linked insurance payouts unlocking new asset classes | +0.6% | Global, concentrated in climate-vulnerable regions | Long term (≥ 4 years) |
| Source: Mordor Intelligence | |||
Mainstream ESG Regulation Mandates
The EU Corporate Sustainability Reporting Directive obliges nearly 50,000 European companies to publish audited impact metrics from 2024, transforming non-financial data from a voluntary disclosure into a fiduciary requirement [1]European Commission, “Directive (EU) 2022/2464 as regards corporate sustainability reporting,” eur-lex.europa.eu . Large US asset managers, therefore, pre-position portfolios for an eventual SEC climate rule, even as debate continues in Congress. Regulators are also adjusting insurance capital rules so that climate-resilient assets attract lower solvency charges, effectively rewarding allocations into verified impact strategies. As these harmonised standards spread, the impact investing market benefits from a policy-driven expansion of eligible capital, especially through pension plans that now see climate risk as a core duty. The combined effect is a structural rise in demand for third-party verified impact vehicles able to satisfy tougher audit requirements.
Institutional Portfolio Re-allocation to Private Impact Vehicles
Pension funds are lifting alternative exposure targets toward 20% by 2030 as they seek illiquidity premiums and measurable outcomes unavailable in public securities. The Canada Pension Plan Investment Board alone plans to deploy CAD 130 billion into sustainable assets by 2030, a clear illustration of the scale potential. Private impact vehicles offer tighter governance and direct project oversight, enabling investors to link carried interest with social or environmental milestones. This capability alleviates regulators’ concerns about greenwashing and improves investment committee confidence. With historical data now showing 200–400 basis points of excess return for fully-priced private impact funds, portfolio strategists no longer see an opportunity-cost penalty. Larger allocations are therefore expected to come from sovereign wealth funds that treat impact investing market exposure as a strategic diversification play in a maturing low-carbon economy.
Retail Wealth Platforms Adding Impact Sleeves
Digital brokerages and robo-advisers lower traditional ticket sizes through fractional shares, making the impact investing market accessible to millions of retail accounts. Morgan Stanley’s Investing with Impact platform managed USD 75 billion by 2023 and continues to gain traction among millennials seeking values-aligned portfolios [2]Morgan Stanley, “Investing with Impact Platform Crosses USD 75 Billion,” morganstanley.com . Robinhood is piloting the on-chain tokenization of 200 blue-chip equities, promising 24-hour liquidity plus smart-contract enforcement of ESG screens. Platform features such as automated impact scoring and real-time carbon dashboards drive customer stickiness while lowering the advice burden for human advisers. As regulatory guidance on crypto-securities clarifies, this retail flow is expected to amplify price discovery in verified impact assets and reinforce transparency norms across the broader impact investing industry.
Outcome-based Blended-Finance Structures De-risking Returns
The World Bank’s new guarantee framework reduces political and currency risk through unfunded risk participation facilities that trigger payouts only if pre-defined impact milestones fail, aligning incentives among all capital providers. Development finance institutions now price blended credit at market rates, signaling confidence in project fundamentals. Structured vehicles that combine junior catalytic capital with senior commercial tranches leverage public funds by as much as four to one, closing the bankability gap for projects in climate adaptation and gender inclusion. Because returns hinge on objectively verified outcomes, performance risk is shared rather than transferred, which appeals to institutional mandates wary of concessionary optics. The approach effectively widens the investable universe for the impact investing market and supports growth in underserved geographies.
Restraints Impact Analysis of Impact Investing Market*
| Restraint | (~) % Impact on CAGR Forecast | Geographic Relevance | Impact Timeline |
|---|---|---|---|
| Green-washing litigation risk inflating compliance costs | -1.1% | Global, concentrated in litigious jurisdictions | Short term (≤ 2 years) |
| Limited depth of exit markets for impact assets | -0.8% | Global, acute in emerging markets | Medium term (2-4 years) |
| Data scarcity on real-time impact KPIs | -0.6% | Global, severe in developing economies | Long term (≥ 4 years) |
| Rising interest rates dampening concessional capital supply | -0.9% | Global, particularly affecting DFI funding | Medium term (2-4 years) |
| Source: Mordor Intelligence | |||
Green-washing Litigation Risk Inflating Compliance Costs
Heightened regulator vigilance has produced sizeable fines against funds that failed to substantiate marketing claims, with the SEC bringing multiple high-profile actions since 2024 [3]U.S. Securities and Exchange Commission, “Enforcement in ESG Funds,” sec.gov . European enforcement under SFDR escalated in 2025 through random audits of Article 9 funds, leading many managers to upgrade data systems and hire third-party verifiers. Compliance spend across the impact investing market is rising 15–20% each year, and litigation insurance premiums have doubled, deterring smaller entrants. Investors now demand granular KPI disclosures plus independent assurance, lengthening reporting cycles, and compressing margins. Although stricter policing curbs reputational risk, it also removes capital from productive deployment during protracted legal proceedings.
Limited Depth of Exit Markets for Impact Assets
Extended holding periods create vintage concentration and mismatch pension fund liquidity schedules. The Blue Earth Capital and British International Investment secondary deal in April 2025 supplied welcome liquidity but underscored the scarcity of scaled buyers. Listing options are narrow because public markets still apply discounted cash flow models that ignore social premiums. Without broader exit pathways, capital recycling slows, dampening overall growth in the impact investing market. Dedicated impact-focused SPACs have shown mixed performance, and regulatory delays have further hindered issuance.
*Our forecasts treat driver/restraint impacts as directional, not additive. The impact forecasts reflect baseline growth, mix effects, and variable interactions.
Impact Investing Market Segment Analysis
By Asset Class:
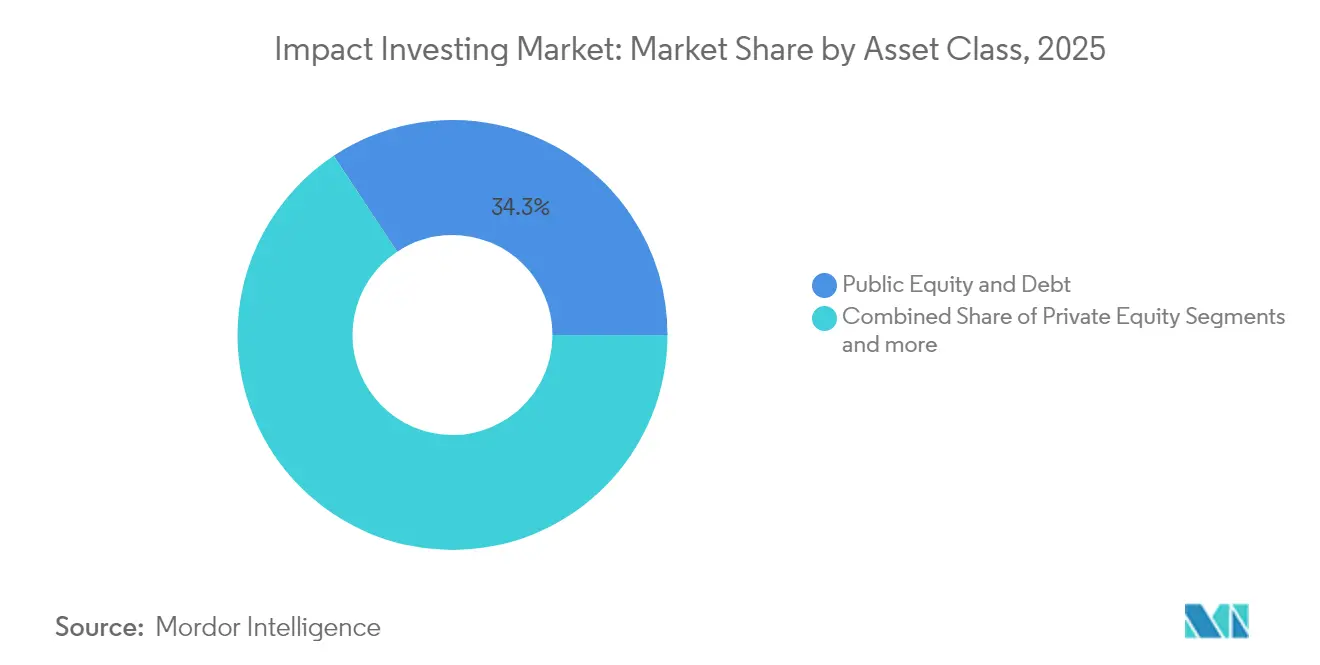
Private Equity Disrupts Public Market DominancePublic equity and debt retained 34.32% of the impact investing market in 2025, a legacy of investor familiarity with listed securities. Private equity, however, is projected to compound at 11.03% through 2031, reflecting a decisive appetite for direct ownership that improves influence over on-the-ground operations. Private debt is gathering pace as banks retreat from capital-intensive developmental lending, transferring origination opportunities to specialist credit funds. Real-asset vehicles, including timber and regenerative agriculture, benefit from clear linkages between asset performance and measurable ecosystem outcomes, reinforcing the portfolio diversification case.
Operational value-creation is central to private equity theses, with managers implementing impact management systems akin to operational excellence programs in traditional buy-outs. TPG Rise’s acquisition of MIRATECH improved emissions abatement at industrial clients while delivering above-benchmark EBITDA growth, exemplifying how operational levers translate into verified impact . Fund managers are also experimenting with tokenised feeder funds that cut administrative overhead and facilitate quicker closings. Cash management strategies remain conservative; impact-aligned money market funds preserve liquidity but accept lower yields to avoid exposure to firms without robust ESG credentials. Over the horizon, the anticipated launch of regulated impact-focused secondary exchanges promises to shorten holding periods and further bolster the impact investing market.



By Investor Type:
Individual Participation Accelerates Institutional DominanceIn 2025, institutional investors held 41.92% of total assets, demonstrating their advanced capabilities in identifying customized investment structures and securing fee reductions. Conversely, individual investors are experiencing a compound annual growth rate (CAGR) of 10.38%, indicating an increasing interest from retail investors as digital wealth management platforms broaden access to investment opportunities. Family offices serve as innovative asset allocators, frequently testing specialized strategies prior to their adoption by larger public pension funds. This trend highlights the evolving landscape of investment management, where both institutional and individual investors are adapting to new market dynamics. The rise of digital channels is pivotal in transforming the investment landscape, making it more inclusive for retail participants.
Generational wealth shifts compound the trend. Surveys reveal that 70% of millennial high-net-worth individuals intend to direct a majority of their portfolios toward purpose-aligned strategies by 2030. Platforms embed social-media style dashboards that compare real-time carbon savings or job-creation metrics against peers, fuelling friendly competition and reinforcing engagement. Institutional allocators still enjoy due diligence advantages, but the collective voice of retail investors can now sway shareholder resolutions and influence proxy voting outcomes inside listed impact funds. This convergence of capital sources blurs traditional segmentation lines and enriches data networks that underpin the broader impact investing market.
By End-Use Sector:
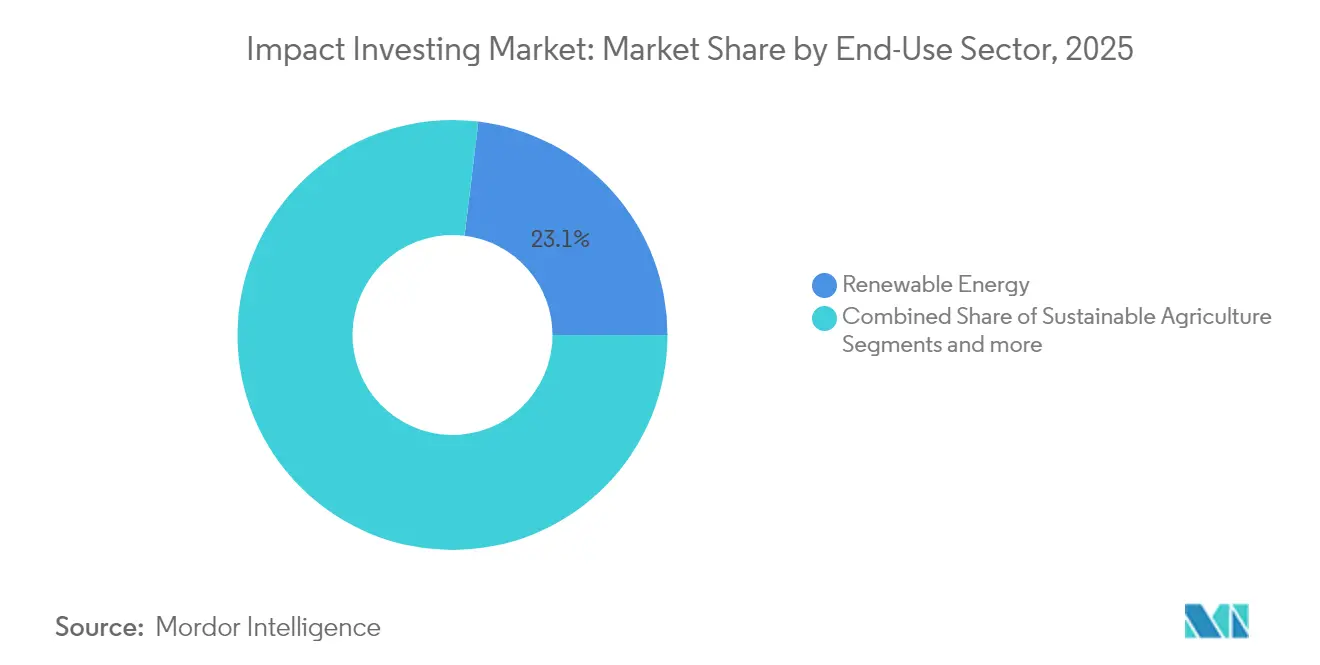
Agriculture Innovation Challenges Energy IncumbencyRenewable energy captured 23.08% of 2025 allocations thanks to supportive feed-in tariffs, rising corporate power-purchase agreements, and sovereign climate commitments. Yet, sustainable agriculture posts the fastest expansion at 9.33% CAGR, signifying investor recognition that resilient food systems are critical to adaptation agendas. Microfinance and MSME lending benefit from digital origination platforms that slice underwriting costs by half, translating into higher risk-adjusted yields. Healthcare impact strategies align with value-based payment reforms, while education technology plays a role in addressing the global skills gap through scalable SaaS models.
Blended finance is pivotal to agri-finance growth. Catalytic first-loss tranches absorb weather and price shocks, unlocking commercial senior debt at competitive coupons. KKR Global Impact’s focus on controlled-environment agriculture demonstrates how operational efficiencies and resource-use metrics resonate with institutional investors. Carbon credit pre-purchase agreements further enhance revenue visibility for regenerative farming projects, smoothing cash flows and satisfying performance-linked note structures. The continued maturation of verification protocols should attract mainstream insurers keen to diversify climate risk pools, solidifying agriculture as a core pillar of the impact investing market.
Geography Analysis
Europe Impact Investing Market
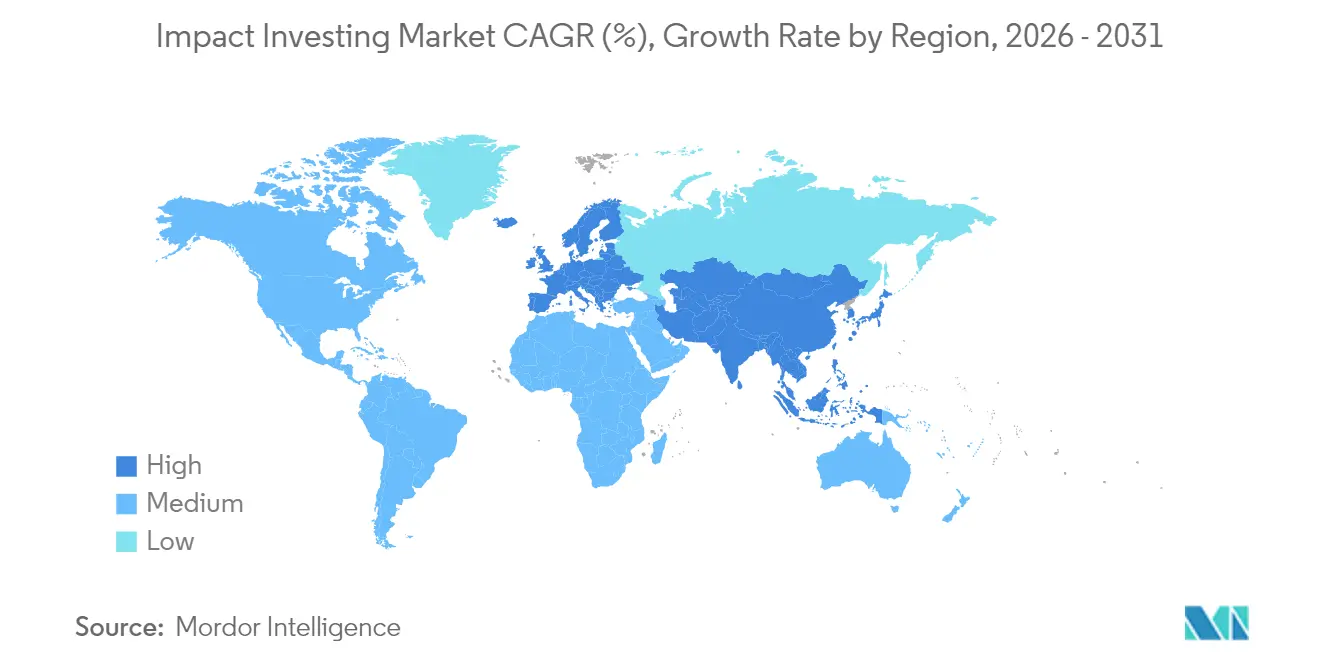
Europe commanded 33.21% of the impact investing market in 2025, supported by a unified regulatory environment that standardises reporting and mobilises sovereign green-bond capital. Development banks in Germany and France co-finance large-scale renewable infrastructure, crowding in institutional investors through partial guarantees. The United Kingdom sustains its role as a structuring hub, leveraging regulatory sandboxes to pilot performance-linked securitisations that improve data transparency. Nordic nations demonstrate high per-capita allocations, reflecting deep societal commitment to sustainability and supportive pension regimes. Despite macro headwinds, European managers benefit from domestic demand that offsets slower fundraising in other regions.
APAC Impact Investing Market
Asia Pacific is the fastest-growing region at 8.70% CAGR, propelled by China’s 2060 carbon-neutral pledge and India’s expansive solar auction pipeline. Singapore positions itself as a gateway for regional capital flows, offering tax incentives for impact fund domiciliation and collaborating with multilaterals on blended-finance platforms. Japan’s aging demographic drives healthcare investments, while South Korea’s Green New Deal channels fiscal stimulus into smart-grid upgrades. Currency volatility remains a challenge, but bilateral swap lines and multilateral guarantees are mitigating FX risk. As regulatory frameworks improve, Asia Pacific could account for nearly a quarter of global allocations by 2031, reshaping the centre of gravity within the impact investing market.
North America Impact Investing Market
North America maintains steady growth underpinned by large pension funds that now integrate climate risk into fiduciary duty interpretations. The United States still grapples with political polarisation over ESG, yet state-level policies and corporate net-zero commitments sustain underlying demand. Canada leads in clarity, with regulators publishing guidance that aligns impact objectives with solvency requirements for pension plans. Mexico’s nascent green-bond market attracts cross-border investors seeking diversification with impact credentials, though liquidity remains episodic. As private-equity style structures proliferate, the region’s share of the impact investing market is expected to remain stable, with upside contingent on harmonised federal disclosure mandates.

Regulatory Landscape
Impact investing is increasingly shaped by mandatory sustainability disclosure and due-diligence regimes that push asset owners and managers toward auditable impact claims. In Europe, the Corporate Sustainability Reporting Directive rollout from 2024 (covering nearly 50,000 companies) increases the volume and auditability of corporate impact data. The EU also adopted Directive (EU) 2026/470 in February 2026, setting a timeline for review by July 2026 on sustainability due diligence requirements for regulated financial undertakings. In the United Kingdom, February 2026 publication of the UK Sustainability Reporting Standards (UK SRS), aligned to ISSB (IFRS S1/S2), tightens expectations around consistent, decision-useful sustainability reporting.
Across Asia, policy signals are shifting from voluntary guidance toward defined reporting obligations that influence listed-asset screening and stewardship. Japan’s Financial Services Agency issued Basic Guidelines on Impact Investment (Impact Finance) on 29 March 2024, providing shared concepts for asset managers and product design. In China, the Shanghai, Beijing, and Shenzhen stock exchanges enforced mandatory sustainability reporting guidelines for FY 2025, with reports due by 30 April 2026, expanding the dataset available for public-equity and debt impact strategies. In contrast, the United States remains fragmented, with differing state-level disclosure and anti-ESG approaches and ongoing scrutiny around fiduciary interpretations, which increases compliance complexity for global managers distributing impact products across jurisdictions.
Value Chain Analysis
The impact investing value chain begins with capital formation and mandate setting by institutional allocators (pension funds, insurers, sovereign wealth funds), foundations, DFIs, corporates, and high-net-worth channels, before shifting to fund sponsors and managers that structure vehicles across private equity, private debt, real assets, and public-market strategies. Placement and wealth platforms then distribute products to institutions and individuals, while structuring partners build blended-finance stacks (junior catalytic capital, guarantees, senior tranches) to improve bankability in sectors such as renewable energy, microfinance/MSME lending, healthcare, and sustainable agriculture.
Origination and underwriting are increasingly paired with formal impact management and measurement workflows, including pre-investment thesis design, baseline establishment, KPI selection, and post-investment monitoring with verification and aggregation across portfolios. Specialist service providers support the chain through data, assurance, and tooling, including AI-enabled analytics platforms that ingest heterogeneous inputs (company reporting, operational data, and other third-party signals) to produce auditable dashboards for LP reporting and regulatory scrutiny. Liquidity and recycling sit at the downstream end through exits (trade sales, secondaries, and public markets), where limited depth of scaled buyers for impact assets can extend holding periods and raise the value of secondary transactions and fund-of-funds approaches for capital rotation.
Competitive Landscape
In 2024, the top five managers oversaw only a portion of the assets, highlighting a fragmented landscape abundant in specialized franchises. BlackRock’s acquisitions of Global Infrastructure Partners and HPS Investment Partners represent an inorganic strategy aimed at bolstering in-house impact measurement and private-market expertise. The firm now integrates proprietary climate-risk analytics across all portfolios, signaling that impact considerations are no longer siloed products but core allocation filters. TPG Rise differentiates through an operational alpha model that ties carry to audited impact milestones, attracting limited partners comfortable with performance-linked economics. KKR Global Impact targets thematic clusters such as sustainable agriculture and circular economy, leveraging the parent platform’s deal-sourcing network for proprietary origination.
Technology is becoming a competitive moat. Managers deploy machine-learning engines to ingest satellite imagery, IoT sensors, and supply-chain ledgers, converting raw data into auditable impact dashboards presented to regulators and investors. Patent filings around automated impact validation rose 18% in 2024, indicating a race to secure intellectual property rights over verification algorithms. Tokenised fund shares grant early-mover platforms an edge in distribution, particularly among younger investors. Consolidation is expected to accelerate as bulge-bracket firms acquire boutiques to meet institutional mandate requirements without lengthy track-record incubation. Nevertheless, niche players that specialise in underserved geographies or thematic depths are likely to retain defensible positions by offering differentiated sourcing pipelines that large houses struggle to replicate.
Fee compression pressures are emerging, driven by institutional bargaining power and the commoditisation of basic ESG integration. Managers commanding outsized economics do so only when they demonstrate verified impact performance and differentiated data granularity. As regulator-mandated disclosures improve comparability, alpha will increasingly hinge on the ability to underwrite complex impact pathways rather than on traditional financial engineering alone. The competitive environment, therefore, rewards innovation in both measurement technology and structured finance, reinforcing the dynamic evolution of the impact investing market.
Impact Investing Industry Leaders
BlackRock
TPG Rise
LeapFrog Investments
Triodos Investment Management
Bridges Fund Management
- *Disclaimer: Major Players sorted in no particular order
Impact Investing Market Companies Covered in this Report
- BlackRock (incl. iShares Sustainable)
- TPG Rise
- LeapFrog Investments
- Triodos Investment Management
- Bridges Fund Management
- KKR Global Impact
- Bain Capital Double Impact
- AXA Investment Managers (Impact)
- Goldman Sachs Asset Management (Sustainable Investing)
- BlueOrchard Finance
- responsAbility Investments
- Vital Capital
- Pacific Community Ventures
- Elevar Equity
- Calvert Impact Capital
- Veris Wealth Partners
- Omidyar Network

Market Opportunities and Future Outlook
White space is expanding where impact strategies can be packaged into verifiable, repeatable products that align with tightening disclosure standards and LP reporting needs. A near-term opportunity sits in impact data infrastructure and assurance, as CSRD-driven audited metrics in Europe and FY 2025 sustainability reporting due by 30 April 2026 for major China exchanges increase the volume of standardized disclosures that investors can translate into investable screens, stewardship agendas, and impact-linked mandates. Platforms that connect investment workflows to measurable outcomes also gain traction as managers link governance and incentives to verified impact milestones, driving demand for tools that manage KPI definition, monitoring, and aggregation across listed and unlisted assets.
Thematic opportunities are showing up in catalytic and pipeline-building initiatives that widen the investable universe. ImpactAssets-backed Abundance Circle launched as a catalytic fund-of-funds model seeking to raise USD 100 million in philanthropic capital in its first year (with a longer-horizon ambition reaching USD 5 billion), highlighting efforts to provide first-loss and early-stage risk capital that can mobilize larger pools. Separately, the World Economic Forum UpLink Annual Impact Report (March 2026) identified 50 high-impact investible opportunities across 10 sectors, which offers a curated pipeline lens for managers building thematic sleeves. Nature and biodiversity finance is another area where longer-duration revenue de-risking (through corporate procurement commitments and habitat mitigation regulations) supports dedicated funds and blended structures that can meet institutional underwriting and reporting requirements.
Recent Industry Developments in Impact Investing Market
- May 2026: LeapFrog Investments released 2025-26 Impact and Investment Results: portfolio reached 622 million people and $9B in revenue with $1.5B in profit. The results emphasize portfolio-level impact metrics alongside revenue scale, supporting market sizing and attrition assumptions for the report.
- May 2026: LeapFrog Investments invested growth capital into Pharmacity to accelerate network expansion. The investment supports payment and distribution channels for health-tech and retail pharmacy themes within the impact investing landscape.
- March 2026: TPG Rise invested approximately $250 million in Findhelp, a social care technology platform. This points to the use of software platforms to drive impact outcomes in supply chains and social care, aligning with the report's themes around tech-enabled fund distribution and measurable impact.


Impact Investing Market Report Scope and Research Methodology
Market Definition and Coverage
For this study, the impact investing market is defined as the value of capital managed and allocated with an intention to generate measurable social or environmental outcomes alongside financial returns. The metric is tracked as assets under management (AUM) across relevant investment vehicles and investor pools.
Scope exclusions: We exclude broad ESG labeled products that do not follow an explicit impact intent and measurement discipline, and we also avoid double counting through fund of funds and indirect holdings wherever it can be identified.
Segments Covered in This Report
- By Asset Class
- Private Equity
- Private Debt
- Natural and Real Assets
- Public Equity and Debt
- Cash & Cash Equivalents
- Fund Structures & Others
- By Investor Type
- Institutional Investors
- Individual Investors
- By End-Use Sector
- Renewable Energy
- Sustainable Agriculture
- Micro-finance & MSME Lending
- Healthcare
- Ed-Tech & Vocational Training
- Sustainable Infrastructure
- By Geography
- North America
- Canada
- United States
- Mexico
- South America
- Brazil
- Peru
- Chile
- Argentina
- Rest of South America
- Europe
- United Kingdom
- Germany
- France
- Spain
- Italy
- BENELUX (Belgium, Netherlands, Luxembourg)
- NORDICS (Denmark, Finland, Iceland, Norway, Sweden)
- Rest of Europe
- Asia-Pacific
- India
- China
- Japan
- Australia
- South Korea
- South-East Asia (Singapore, Malaysia, Thailand, Indonesia, Vietnam, Philippines)
- Rest of Asia-Pacific
- Middle East and Africa
- United Arab Emirates
- Saudi Arabia
- South Africa
- Nigeria
- Rest of Middle East and Africa
- North America
Data Sources, Market Sizing, and Validation
Desk Research
Desk research starts by mapping what impact capital means in practice, then building a clean list of investable categories and investor pools that can be tracked over time. We leaned on public and official sources, including OECD sustainable finance work, World Bank and IFC publications on mobilized private capital, UNCTAD investment statistics, and central bank and regulator releases on fund reporting and disclosure rules.
To shape the numbers, we also reviewed annual reports and public filings of large asset managers, industry association publications such as the Global Impact Investing Network and regional impact networks, and reputable press coverage of fund raises and strategy launches. In a few places, paid subscriptions for company financials and news, patent databases (to understand impact themes tied to innovation), and an import and export shipment level database (as a proxy for physical economy activity in certain impact themes) were used to cross-check assumptions. The sources listed here are illustrative, and many other public documents were also consulted to collect data, validate it, and clear up open research questions.
Primary Interviews and Surveys
Primary work focused on converting broad impact narratives into measurable sizing inputs, then checking whether the draft model matches how capital is actually counted and reported in the field. We spoke with asset owners, fund managers, intermediaries, and impact measurement specialists. We also used surveys to test assumptions around impact AUM reporting boundaries, typical fee and allocation behavior, and how much activity is counted as direct versus indirect exposure across regions.
Distribution of primary research fieldwork respondents
| Company type | Respondent position | Region |
|---|---|---|
| Top tier: 28% | CXOs: 14% | APAC: 41% |
| Mid tier: 54% | Functional/Unit leaders: 26% | EMEA: 34% |
| Smaller Players: 18% | Managers: 60% | Americas: 25% |
Market-Sizing & Forecasting
The sizing model begins with a top-down reconstruction of the impact AUM pool by investor group and vehicle type. We use reported AUM series, fund registration counts, and disclosed strategy allocations, then filter through impact intent and measurement rules. After that first pass, we corroborate the total using selective bottom-up approximations, such as sampled manager AUM roll-ups, channel checks on fundraising and deployment, and sanity checks using typical allocation ranges applied to known eligible AUM pools.
A few market fingerprints were important to keep the model grounded. These included reported impact AUM definitions used in industry surveys, observed fundraising cycles for private markets, shifts in listed versus unlisted appetite, and the mix of allocations by theme (such as climate, inclusive finance, and community development). We also tracked indicators like policy and disclosure changes affecting fund labeling, institutional allocation patterns, and currency conversion timing, because AUM is often reported in local terms before it gets normalized. For forecasting, scenario analysis was used so that growth can be tied to a small set of explainable drivers, then aligned to what interviewees expect for fundraising, deployment pace, and market sentiment over the next few years. Where bottom-up inputs were incomplete for smaller managers or thinly reported regions, we handled the gap through conservative sampling expansion and then re-checked against independent totals and reported survey distributions.
Data Validation & Update Cycle
Validation is done in layers so that obvious math consistency is checked first, then market sense checks use independent signals. We compare model outputs against published AUM tallies, reported fundraising and deployment patterns, and regional splits. Any sharp jumps that do not match policy, reporting, or capital market conditions get investigated.
Before sign-off, the work goes through a multi-step review where assumptions, conversions, and segment splits are challenged by a second analyst, and callbacks are triggered if a key input looks out of line. Reports are refreshed annually, and interim updates are made when material events occur, such as major disclosure shifts or large allocation changes by institutions. Right before delivery, we do a fresh pass to capture the latest public releases so clients receive an updated view.
Mordor Intelligence's Impact Investing Market Size Compared Against Other Published Estimates
Published numbers for impact investing do not always line up, mainly because different authors choose different counting rules and they rely on different reporting sources. The spread usually comes from whether the estimate is framed as AUM, fundraising, or deployed capital, and how direct versus indirect exposure is treated.
The table shows a tight cluster around the mid USD 1.5 T range, but the gaps still matter when decisions depend on consistent definitions. In Mordor Intelligence's model, the current-year benchmark is tied to a global value-based view that aligns the investor pool, geography coverage, and currency timing to one consistent set of assumptions. This avoids mixing direct AUM tallies with partial regional scopes or unmatched reporting periods.
Benchmark comparison
| Source | Market Size | Gaps in Research Methodology |
|---|---|---|
| Mordor Intelligence | USD 1.57 T (2026) | |
| Industry Association A | USD 1.57 T (2024) | Uses a direct impact AUM database approach and explicitly clears indirect investments, which can understate exposure that is held through multi-layer vehicles, and it also reflects a different base year than the current benchmark year. |
| Regional Network B | USD 0.25 T (2024) | Focuses on Europe and separates private and public market impact, so the figure is not a global total, and the private-market framing can miss listed allocations that many global investors still classify under impact strategies. |
Overall, the comparison points to three repeatable drivers of differences, which are geography boundary, what is counted as direct versus indirect exposure, and the year and currency timing used for conversion. By keeping those choices explicit and then cross-checking them with interviews and independent AUM signals, our estimate stays traceable to clear inputs and can be updated without changing the logic.


Key Questions Answered in the Report
What is the current size of the impact investing market?
The market stood at USD 1.57 trillion in 2026 and is projected to reach USD 2.19 trillion by 2031, translating into a 6.83% CAGR.
Which asset class is growing fastest within the impact investing market?
Private equity is expanding at 11.03% CAGR through 2031 because direct ownership allows fuller impact measurement and higher illiquidity premiums.
Why is Europe leading the impact investing market?
Europe commands 33.21% market share due to stringent disclosure mandates such as CSRD and a robust sovereign green-bond pipeline that channels capital into verified projects.
What restrains faster growth of impact investing?
Key headwinds include green-washing litigation risks that inflate compliance costs, shallow exit markets that lengthen holding periods, data gaps in developing economies, and higher interest rates that limit concessional funding pools.
How are retail investors accessing impact opportunities?
Digital platforms enable fractional ownership of tokenised funds and offer automated impact screening, driving a 10.38% CAGR in individual investor participation.
Which sector shows the highest growth potential?
Sustainable agriculture leads with 9.33% CAGR through 2031 as investors finance resilient food systems and climate-smart farming initiatives.
Page last updated on:


 Your data is secure and never sold or shared.


