
Open Source Service Market Size and Share
Market Overview
| Study Period | 2020 - 2031 |
|---|---|
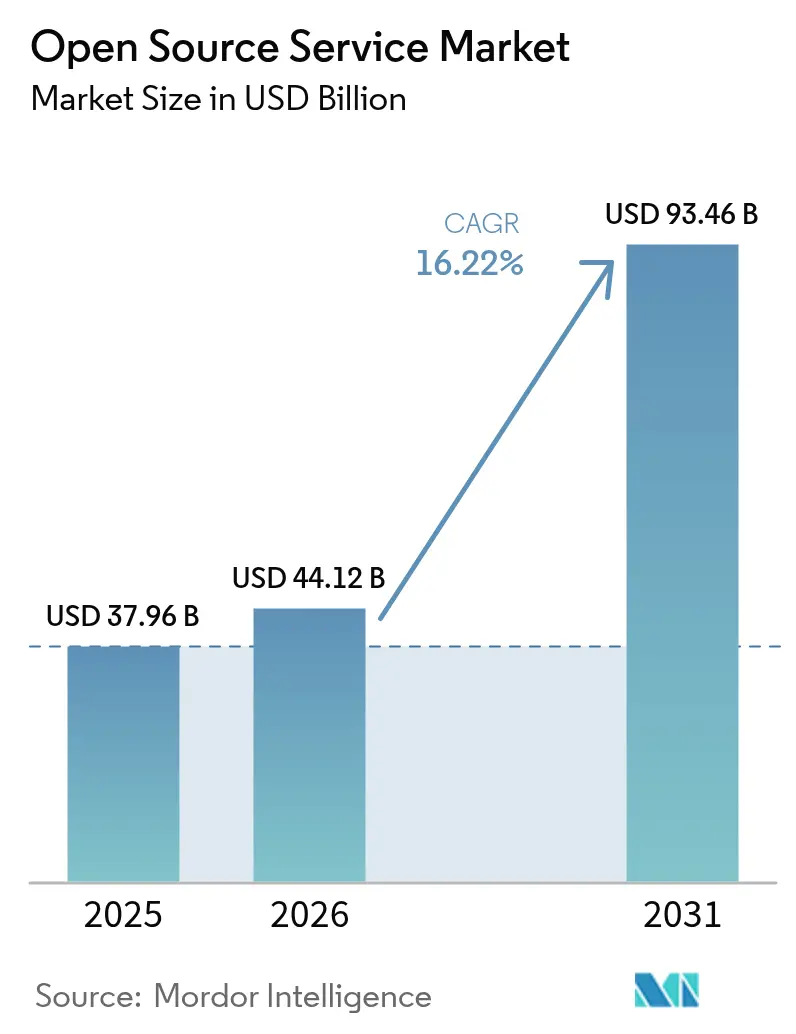
| Market Size (2026) | USD 44.12 Billion |
| Market Size (2031) | USD 93.46 Billion |
| Growth Rate (2026 - 2031) | 16.22% CAGR |
| Fastest Growing Market | Asia Pacific |
| Largest Market | North America |
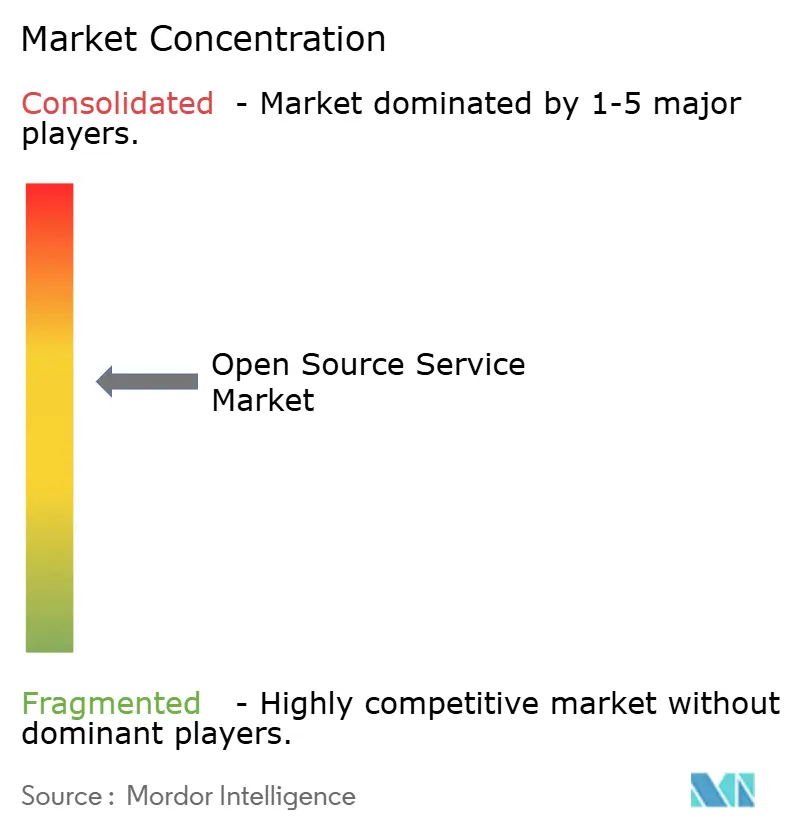
| Market Concentration | Medium |
Major Players *Disclaimer: Major Players sorted in no particular order Image © Mordor Intelligence. Reuse requires attribution under CC BY 4.0. | |
Open Source Service Market Analysis by Mordor Intelligence
The Open Source Service market size is expected to grow from USD 37.96 billion in 2025 to USD 44.12 billion in 2026 and is forecast to reach USD 93.46 billion by 2031 at 16.22% CAGR over 2026-2031. Heightened enterprise focus on digital sovereignty, vendor-lock-in reduction and cost optimization is turning the Open Source Service market into a strategic pillar of transformation budgets. Organizations increasingly view community-developed code as an innovation accelerator, with 96% maintaining or expanding open-source use. Regulatory momentum—such as the EU Digital Markets Act and Switzerland’s open-source mandate—continues to steer procurement toward open standards[1]European Commission, “Digital Markets Act: Designation of Gatekeepers,” ec.europa.eu. Implementation complexity propels service revenues because 93% of hiring managers still struggle to find qualified talent. Skills shortages, rising security expectations and hybrid-cloud adoption keep managed services growth ahead of consulting, while on-premise deployments remain relevant for data-sensitive industries.
Key Report Takeaways
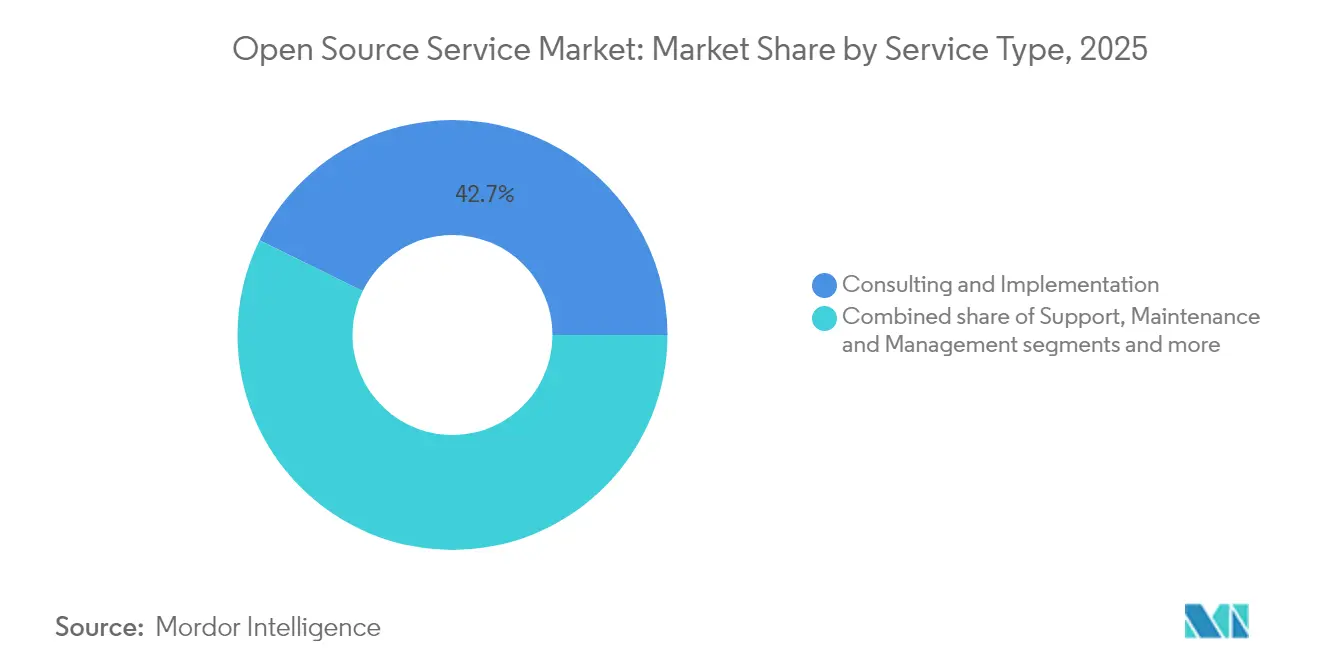
- By service type, Consulting and Implementation led with 42.74% of Open Source Service market share in 2025, while Managed Services is projected to expand at a 17.6% CAGR through 2031.
- By deployment mode, On-premise held 67.78% share of the Open Source Service market size in 2025; cloud deployment is advancing at an 18.03% CAGR to 2031.
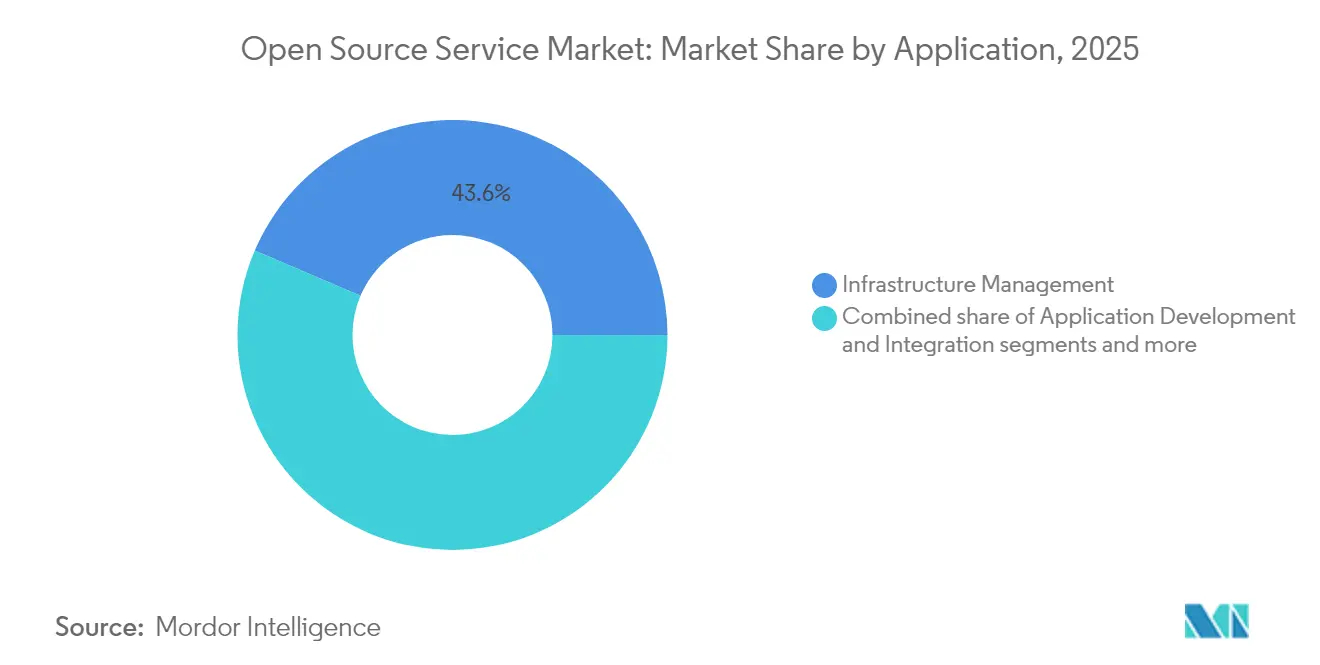
- By application, Infrastructure Management accounted for a 43.58% share of the Open Source Service market size in 2025, and Data Management and Analytics is forecast to grow at 17.28% CAGR.
- By end-user industry, IT and Telecom captured 26.35% revenue share in 2025, whereas Healthcare and Life Sciences shows the fastest CAGR at 16.61% through 2031.
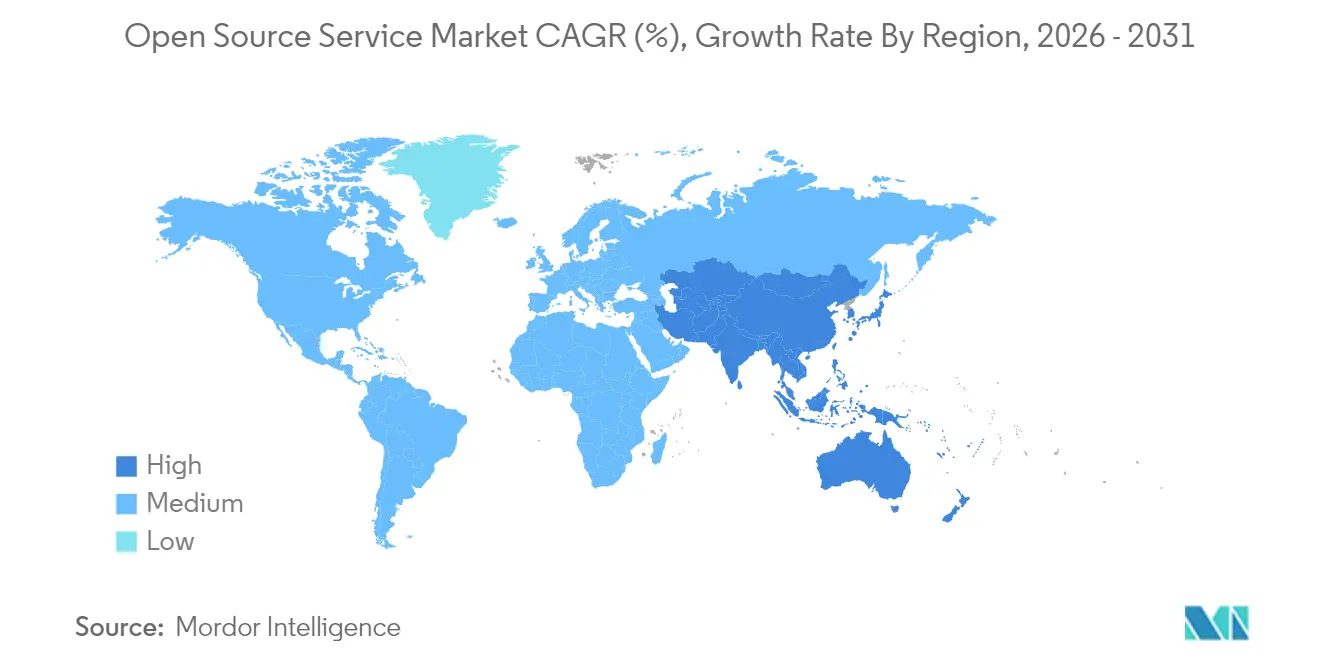
- By geography, North America contributed 37.35% revenue in 2025; Asia-Pacific is the fastest-growing region with a 16.92% CAGR through 2031.
Note: Market size and forecast figures in this report are generated using Mordor Intelligence’s proprietary estimation framework, updated with the latest available data and insights as of 2026.
Global Open Source Service Market Trends and Insights
Drivers Impact Analysis*
| Driver | (~) % Impact on CAGR Forecast | Geographic Relevance | Impact Timeline |
|---|---|---|---|
| Reduced cost of ownership and time-to-market | +3.2% | Global, with strongest impact in APAC and Latin America | Medium term (2-4 years) |
| Interoperability and customisation flexibility | +2.8% | Global, particularly EU due to DMA compliance | Long term (≥ 4 years) |
| Cloud-native and DevOps adoption surge | +4.1% | North America & EU leading, APAC following | Short term (≤ 2 years) |
| Enterprise digital-transformation budgets | +3.5% | Global, concentrated in developed markets | Medium term (2-4 years) |
| EU Digital Markets Act-driven open standards push | +1.9% | EU primary, spillover to other regulated markets | Long term (≥ 4 years) |
| Sustainability-led vendor-lock-in avoidance | +1.7% | EU and North America leading, global adoption | Long term (≥ 4 years) |
| Source: Mordor Intelligence | |||
Reduced Cost of Ownership and Time-to-Market
Organizations select open source to cut licensing fees and accelerate solution rollout. In 2025, 53% cited cost reduction as their prime adoption impulse. Financial-services firms illustrate this shift: 78% reported higher value from open-source implementations and 90% deemed the approach vital for future operations. Rapid prototyping in AI projects, made possible by freely available frameworks, trims procurement cycles, yet the need for secure production rollouts fuels paid support engagements.
Cloud-Native and DevOps Adoption Surge
Enterprises pursuing containerization and GitOps rely heavily on open-source tooling, pushing demand for specialized consulting. Container usage now spans 90% of surveyed firms, with 86% running Kubernetes clusters, while 85% require professional assistance to manage these environments. Telecommunications groups such as Deutsche Telekom apply these practices to re-architect 5G networks, proving the scalability of open standards.
Enterprise Digital-Transformation Budgets
Global managed services spending surpassed USD 100 billion in 2023, with 15% of contracts tied to AI initiatives. Manufacturing exemplifies the pivot: 93% of firms launched new AI projects during 2024, many on open-source toolchains. Healthcare researchers likewise rely on community code bases for genomics and collaborative R&D, tightening the link between IT budgets and professional open-source services.
Interoperability and Customisation Flexibility
Cross-platform integration and code transparency ease regulatory compliance. The EU Digital Markets Act designates six gatekeepers, compelling enterprises to favor open standards to avoid ecosystem lock-in. Germany’s public-sector migration to openDesk and Switzerland’s legal requirement for government software transparency show how policy catalyzes service demand.
Restraints Impact Analysis*
| Restraint | (~) % Impact on CAGR Forecast | Geographic Relevance | Impact Timeline |
|---|---|---|---|
| Security and vulnerability concerns | -2.4% | Global; acute in regulated industries | Short term (≤ 2 years) |
| Scarcity of skilled open-source talent | -1.8% | Global; acute in APAC and emerging markets | Medium term (2-4 years) |
| Licence-compliance complexity | -1.2% | EU and North America due to tight regulation | Medium term (2-4 years) |
| Risk of community project abandonment | -0.9% | Global; smaller firms relying on niche tools most affected | Long term (≥ 4 years) |
| Source: Mordor Intelligence | |||
Security and Vulnerability Concerns
Although 91% of financial institutions express confidence in open-source security, high-profile supply-chain attacks elevate risk perceptions. The April 2025 withdrawal of federal funding for the CVE system complicates vulnerability tracking. Recent flaws in Linux and Ruby-SAML spotlight long discovery lags, prompting enterprises to purchase professional monitoring and patching services.
Scarcity of Skilled Open-Source Talent
Ninety-three percent of hiring managers struggle to recruit qualified candidates. Certified engineers command premium pay, particularly in cloud, container, and cybersecurity domains. Red Hat has trained more than 200,000 students through its Academy program to mitigate the shortfall. Labor constraints lengthen project timelines and elevate costs, tempering overall market expansion.
*Our forecasts treat driver/restraint impacts as directional, not additive. The impact forecasts reflect baseline growth, mix effects, and variable interactions.
Segment Analysis
By Service Type: Consulting Leads While Managed Services Accelerate
Consulting and Implementation retained a 42.74% Open Source Service market share in 2025 as enterprises tackled complex migrations. Managed Services, however, is forecast to post a 17.6% CAGR as firms pivot toward outcome-based engagements and continuous optimization. Enterprises confronting container sprawl—85% need help with production workloads—prefer long-term managed contracts to ad-hoc support.
Training and Certification grows quickly because 52% of managers favor certified hires, while Support, Maintenance and Management remains a staple for organizations scaling diverse stacks. The Open Source Service market benefits from this layered demand structure, turning skill scarcity into recurring-revenue opportunities for service vendors.



By Deployment Mode: Cloud Gains Momentum Despite On-Premise Dominance
On-premise held 67.78% of the Open Source Service market size in 2025, reflecting regulatory and data-sovereignty needs. Yet cloud deployments are advancing at an 18.03% CAGR as hybrid architectures normalize. Telecom operators report 77% effectiveness for cloud migrations, but maintain private environments for sensitive workloads.
Container adoption blurs deployment distinctions because 90% of firms run containerized code on both on-premise and public-cloud platforms. This convergence keeps the Open Source Service market resilient across infrastructure models and expands the addressable scope for integration specialists.
By Application: Infrastructure Management Leads While Data Analytics Surges
Infrastructure Management commanded 43.58% of revenue in 2025, underpinned by modernization projects. Data Management and Analytics is set to grow 17.28% annually, buoyed by generative-AI workloads requiring scalable, low-cost data platforms. Pharmaceutical and manufacturing firms illustrate this pivot, embedding open-source analytics into R&D and predictive-maintenance initiatives.
Application Development and Integration and Security and Compliance also gain traction as DevOps teams standardize on open APIs and regulators tighten data-handling rules. Multiple use-cases ensure the Open Source Service market remains diversified, limiting over-dependence on any single category.
By End-User Industry: IT and Telecom Mature While Healthcare Accelerates
IT and Telecom contributed 26.35% of revenue in 2025, reflecting deep-rooted Linux and Kubernetes penetration. Healthcare and Life Sciences is projected to expand 16.61% yearly, propelled by collaborative research and bioinformatics workloads. BFSI continues to scale open-source footprints; 52% of banks already operate formal Open Source Program Offices.
Government mandates in Germany and Switzerland fuel public-sector demand, while manufacturing leverages open-source platforms for Industry 4.0 automation. Cross-industry proliferation underpins long-run growth for the Open Source Service market.
Geography Analysis
North America accounted for 37.35% of 2025 revenue thanks to mature enterprise adoption, a deep talent pool, and venture-capital backing for commercial open-source startups. Financial-services consortia such as FINOS encourage code sharing, and large-scale M&A—IBM’s USD 6.4 billion HashiCorp purchase—shows incumbents doubling down on open-source portfolios. The region’s value proposition centers on complex, high-margin consulting engagements.
Asia-Pacific is the fastest-growing region, projected at 16.92% CAGR through 2031. China positions open source as a pillar of tech self-reliance, while India’s IT services sector exports expertise worldwide. APAC organizations lead global modernization metrics, with 67% using open-source infrastructure tools. Telecommunications carriers in Japan, South Korea, and Australia deploy Kubernetes-driven 5G cores, sustaining regional service momentum.
Europe’s trajectory benefits from the Digital Markets Act and national sovereignty programs. Germany’s openDesk rollout and Switzerland’s federal EMBAG law are spurring migration away from proprietary suites. Service providers with compliance know-how and multilingual delivery teams capture rising demand, making the Open Source Service market outlook robust across the continent.

Regulatory Landscape
Policy and procurement rules are increasingly tying open source adoption to software assurance and interoperability obligations. In Europe, the Digital Markets Act continues to push open standards across regulated digital ecosystems, while the EU Cyber Resilience Act introduces an explicit concept of open-source software stewards and links commercial use of open source in digital products to cybersecurity processes, including vulnerability handling and disclosure. The European Commission also reinforced the public-sector direction of travel through updated work on open digital ecosystems and open source governance initiatives in 2026, complementing national-level open source policies tracked through Interoperable Europe.
In the United States, federal guidance has been shifting toward risk-based security requirements rather than uniform, one-size-fits-all mandates. The January 2026 U.S. Office of Management and Budget Memorandum M-26-05 moved agencies toward agency-specific, risk-based software and hardware security policies, while CISA has continued to publish guidance and roadmaps focused on open source software security. Across government and critical infrastructure procurement, Software Bill of Materials (SBOM) practices are increasingly becoming buyer requirements, which raises the compliance and documentation workload that is often offloaded to specialized open source service providers.
Value Chain Analysis
The value chain begins with upstream communities and foundations that produce core projects (for example, CNCF-hosted cloud native components), then moves through commercial maintainers and distributors (including enterprise Linux and Kubernetes vendors), cloud platforms that package open source into managed offerings, and system integrators and IT services firms delivering consulting, implementation, migration, and operations. Security tooling and artifact management platforms span the chain, supplying dependency intelligence, scanning, policy-as-code, and CI/CD integration that help enterprises run open source at scale.
Recent ecosystem moves point to where service value is being created as software supply chain metadata and control points consolidate into fewer, more-integrated workflows. Examples include the September 2024 expansion of the JFrog and GitHub partnership to surface artifact metadata in developer workflows, and 2025 collaborations such as Anchore with Chainguard for hardened images plus scanning and policy, and CNCF partnering with Docker to extend infrastructure support for maintainers. These integrations tend to increase demand for implementation and managed operations work, especially around container images, dependency knowledge graphs, and ongoing compliance automation.
Competitive Landscape
The Open Source Service market features a mid-level concentration where global technology vendors compete with focused specialists. Red Hat leads in enterprise Linux and OpenShift container platforms, maintaining roughly USD 2 billion annual revenue while seeding partner ecosystems. SUSE’s Rancher acquisition sharpened its Kubernetes profile, and Canonical’s Ubuntu enjoys a broad public-cloud presence.
Platform vendors such as AWS, Google, and Oracle embed open-source stacks into wider cloud-service portfolios, cross-subsidizing support with platform revenue. Emerging providers—Crunchy Data for PostgreSQL or Grafana Labs for observability—address niche growth pockets and often become acquisition targets. Snowflake’s USD 250 million Crunchy Data deal underscores mounting interest in database-as-a-service plays.
Competitive focus is shifting from break-fix support to managed services, AI integration, and vertical solutions. Container software is illustrative: Red Hat holds a 47.8% share through proactive training programs, whereas SUSE commands 3.9% after consolidating Rancher. Market entrants differentiate via security tooling and compliance automation, leveraging the persistent talent gap to price premium engagements in the Open Source Service market.
Open Source Service Industry Leaders
Red Hat Inc.
Oracle Corporation
Cisco Systems, Inc.
Infosys Limited
Hewlett Packard Enterprise Company
- *Disclaimer: Major Players sorted in no particular order

Market Opportunities and Future Outlook
Security-oriented managed services are the key whitespace as buyers operationalize vulnerability response, SBOM practices, and supply chain controls across complex dependency graphs. Industry initiatives in 2026 also create direct pull-through for service engagements, including the Linux Foundation launch of Akrites, which brings together major vendors (including AWS, Google, IBM, Microsoft, NVIDIA, and Red Hat) around shared incident response and coordinated vulnerability disclosure for critical open source. This supports demand for providers that can implement continuous monitoring, patch orchestration, and vulnerability disclosure programs across hybrid environments.
AI-driven workloads are also changing the service mix toward standardized, testable platform building blocks for Kubernetes and agentic application stacks. CNCF expanded its Kubernetes AI Conformance work in March 2026, with certified Kubernetes AI platforms rising to 31 (including OVHcloud, SpectroCloud, JD Cloud, and China Unicom Cloud), creating scope for assessment, conformance enablement, and managed operations around AI-capable cloud native platforms. In parallel, Linux Foundation efforts such as the operational launch of the x402 Foundation in July 2026 to steward an open payments protocol for internet-native transactions highlight emerging service demand around integration, governance, and secure operations for new open standards that sit alongside core infrastructure software.
Recent Industry Developments
- July 2026: IBM and Red Hat expanded Lightwell with new commercial offerings focused on automated vulnerability remediation for open source software. The release added capabilities such as a dependency catalog and coordinated patch and threat handling, strengthening enterprise-grade operations around supply chain risk and increasing the addressable scope for managed security services.
- June 2025: Snowflake announced the acquisition of Crunchy Data for about USD 250 million to build Snowflake Postgres, an enterprise-ready PostgreSQL offering. The move accelerated vendor investment into commercialized open source data platforms, amplifying demand for migration, optimization, and ongoing managed database services.
- April 2024: IBM completed its USD 6.4 billion acquisition of HashiCorp, expanding automation capabilities across hybrid-cloud infrastructure. This increased the integration workload across heterogeneous environments and supported higher-value consulting and managed services tied to Infrastructure as Code and platform operations.


Research Methodology Framework and Report Scope
Market Definition and Coverage
For this report, the market includes revenues earned by third-party service providers for consulting, integration, deployment, hosting, support, managed operations, and training tied to software released under OSI-approved open-source licenses, covering both enterprise and public-sector use cases.
Scope exclusions: We do not include closed-source license fees, or non-service revenue streams that are not connected to delivering or operating open-source software.
Segmentation Overview
- By Service Type
- Consulting and Implementation
- Support, Maintenance and Management
- Managed Services
- Training and Certification
- By Deployment Mode
- On-premise
- Cloud
- By Application
- Infrastructure Management
- Application Development and Integration
- Data Management and Analytics
- Security and Compliance
- By End-user Industry
- Banking, Financial Services and Insurance (BFSI)
- IT and Telecom
- Manufacturing
- Government and Public Sector
- Healthcare and Life Sciences
- Other End-user Industries
- By Geography
- North America
- United States
- Canada
- Mexico
- Europe
- Germany
- United Kingdom
- France
- Italy
- Spain
- Rest of Europe
- Asia-Pacific
- China
- Japan
- India
- South Korea
- Australia
- Rest of Asia-Pacific
- South America
- Brazil
- Argentina
- Rest of South America
- Middle East and Africa
- Middle East
- Saudi Arabia
- United Arab Emirates
- Turkey
- Rest of Middle East
- Africa
- South Africa
- Egypt
- Nigeria
- Rest of Africa
- Middle East
- North America
Data Sources, Market Sizing, and Validation
Desk Research
Desk work started by mapping where open-source service revenue shows up in public records, then connecting those patterns to adoption signals and the labor capacity needed to deliver services. We relied on reputable, non-paywalled sources such as U.S. Bureau of Labor Statistics data on IT roles, Eurostat enterprise ICT usage series, OECD digital economy indicators, and World Bank data on ICT and services value-add to frame demand intensity by region.
We also reviewed open licensing guidance from the Open Source Initiative, public procurement and digital policy pages from major governments, and peer-reviewed journals on enterprise open-source adoption and support models. Alongside that, we used company filings, investor presentations, and reputable press coverage to cross-check service mix statements and directional pricing. Where needed, we used paid subscription access for company financials and news to standardize reported services revenue and to reduce double counting across corporate structures. These examples are not exhaustive, and additional public sources were consulted to collect data, validate assumptions, and clarify definitions.
Primary Interviews and Surveys
Primary work focused on confirming what buyers actually pay for in open-source services, and how deals are priced and renewed across regions and industries. We spoke with service providers, system integrators, managed-service specialists, and enterprise IT decision-makers. We then ran targeted re-contact calls to close gaps found in desk data, and to confirm pricing ranges and renewal patterns.
Distribution of primary research fieldwork respondents
| Company type | Respondent position | Region |
|---|---|---|
| Top tier: 37% | CXOs: 12% | APAC: 46% |
| Mid tier: 41% | Functional/Unit leaders: 31% | EMEA: 31% |
| Smaller Players: 22% | Managers: 57% | Americas: 23% |
Market-Sizing & Forecasting
Sizing used a top-down and bottom-up combination. We started from enterprise IT services spending and open-source adoption indicators to reconstruct the addressable services pool, then applied filters for the share of workloads that require external delivery support. To keep totals realistic, we corroborated the outputs with selective bottom-up checks, such as sampled average contract values multiplied by estimated deal volumes, and limited supplier roll-ups in large regions.
Model inputs include cloud migration pace for enterprise workloads, the installed base of enterprise Linux and Kubernetes-type environments that typically pull paid support, the split of managed services versus project work, average billable rates by region, and renewal behavior for support and managed operations. For smaller providers where the bottom-up view was thinner, we used ranges built from interview-backed utilization and pricing, then normalized so the long tail did not inflate the total.
For forecasting, we used scenario analysis because demand is sensitive to macro IT budgets and to changes in enterprise architecture and compliance expectations. Growth rates for managed-services penetration, rate movement, and regional adoption were set to match what experts described as realistic, then checked against historical patterns.
Data Validation & Update Cycle
Outputs were checked against independent signals such as reported services mix in public filings, labor availability indicators, and cloud adoption benchmarks. These checks helped flag anomalies that could indicate double counting or an unrealistic price-per-workload assumption. When major variances appeared by region or by service category, we re-contacted sources to verify whether the driver was scope, pricing, or timing.
Each model pass includes multi-step analyst reviews before sign-off, and reasonableness checks are applied at every layer. Reports are refreshed annually, with interim updates triggered when material events shift demand, including regulatory changes, large platform shifts, or sharp resets in IT budgets. Before delivery, an analyst runs a final update sweep so clients receive the latest view.
Mordor Intelligence's Open Source Service Market Size Compared With Other Published Estimates
Published market values for open-source services often differ, partly because firms mix revenue items differently, use different starting years, and convert currencies using different rate timing. The spread is also influenced by whether managed operations is treated as a dedicated open-source service line or absorbed into broader cloud managed services.
Closed-source add-on license fees fall outside Mordor Intelligence's scope. Estimates that bundle proprietary subscriptions with service delivery can therefore land higher even when adoption assumptions are similar. Differences also come from how support renewals are counted (full contract value versus service-only value), and whether smaller providers are modeled using practical utilization and pricing checks or simply scaled from headline growth rates.
Benchmark comparison
| Source | Market Size | Gaps in Research Methodology |
|---|---|---|
| Mordor Intelligence | USD 44.12 B (2026) | |
| Trade Journal A | USD 30.60 B (2024) | Uses an earlier base year and a broader service basket, which can blend general implementation and consulting spends without consistently separating managed operations and support-only revenue. |
| Industry Survey B | USD 33.90 B (2023) | Anchors the market on a different starting year and may include bundled subscription and support constructs, which makes service-only comparisons less consistent. |
The table indicates that most variation comes from differences in base years and from bundling subscription-linked revenue with service delivery. By keeping the service-only definition consistent and re-checking pricing and renewal behavior through interviews, we arrive at a traceable number that can be updated in a repeatable way as inputs change.


Key Questions Answered in the Report
What is the current value of the Open Source Service market?
The Open Source Service market size stood at USD 44.12 billion in 2026 and is forecast to reach USD 93.46 billion by 2031.
Which segment is growing fastest within the Open Source Service market?
Managed Services is the fastest-growing service segment, projected at a 17.6% CAGR through 2031 as enterprises seek outcome-based engagements.
Why are enterprises shifting toward open source solutions?
Drivers include lower total cost of ownership, faster time-to-market, regulatory pushes for interoperability and the flexibility to customize code for unique needs.
Which region will see the highest growth?
Asia-Pacific is expected to expand at a 16.92% CAGR, boosted by China’s open-source initiatives and India’s expanding IT-services footprint.
What are the main challenges facing the Open Source Service market?
Key restraints are security and vulnerability concerns, licence-compliance complexity and a global shortage of skilled open-source professionals.
Who are the leading companies in the Open Source Service market?
Major players include Red Hat, IBM, SUSE, Canonical, AWS and specialized firms such as Crunchy Data and Grafana Labs, each focusing on different layers of the ecosystem.
Page last updated on:






