Network As A Service Market Size and Share
Market Overview
| Study Period | 2020 - 2031 |
|---|---|
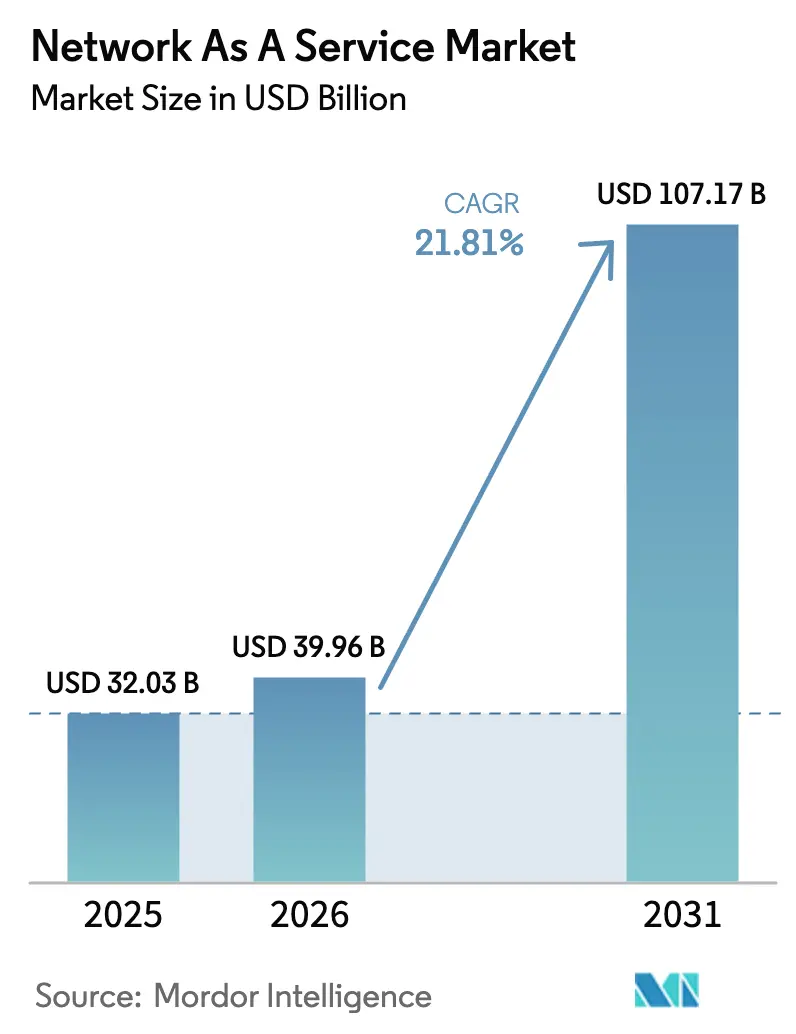
| Market Size (2026) | USD 39.96 Billion |
| Market Size (2031) | USD 107.17 Billion |
| Growth Rate (2026 - 2031) | 21.81% CAGR |
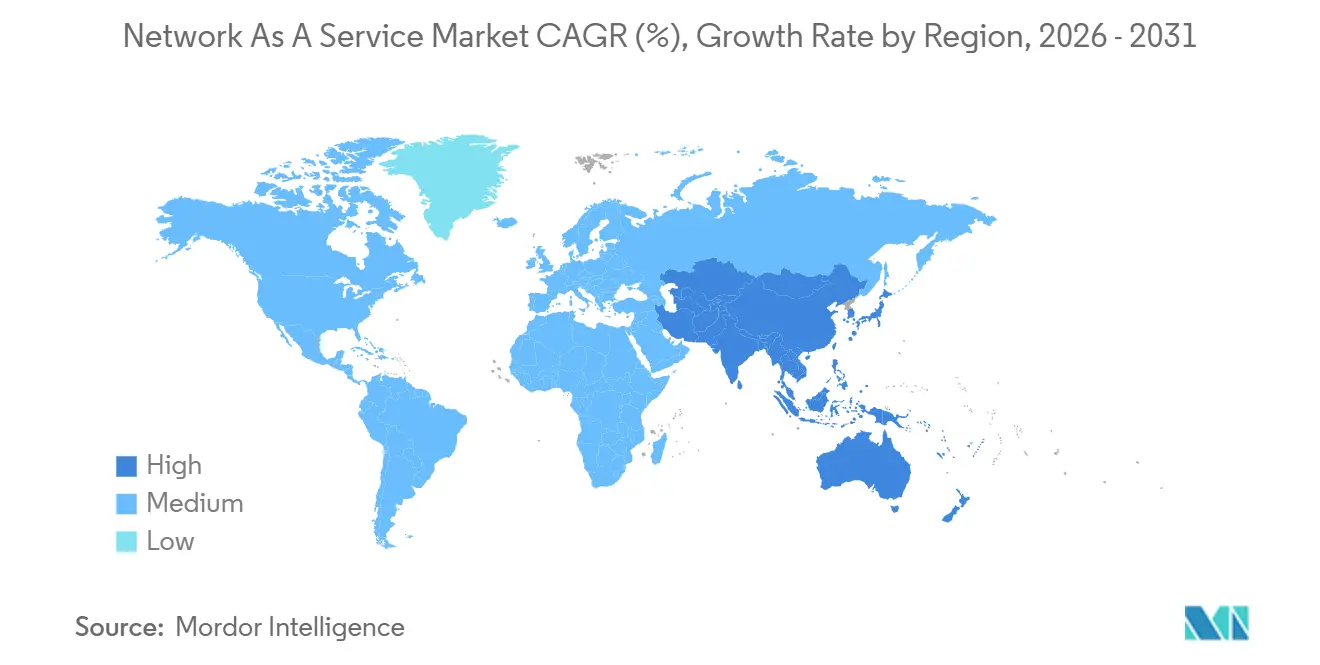
| Fastest Growing Market | Asia Pacific |
| Largest Market | North America |
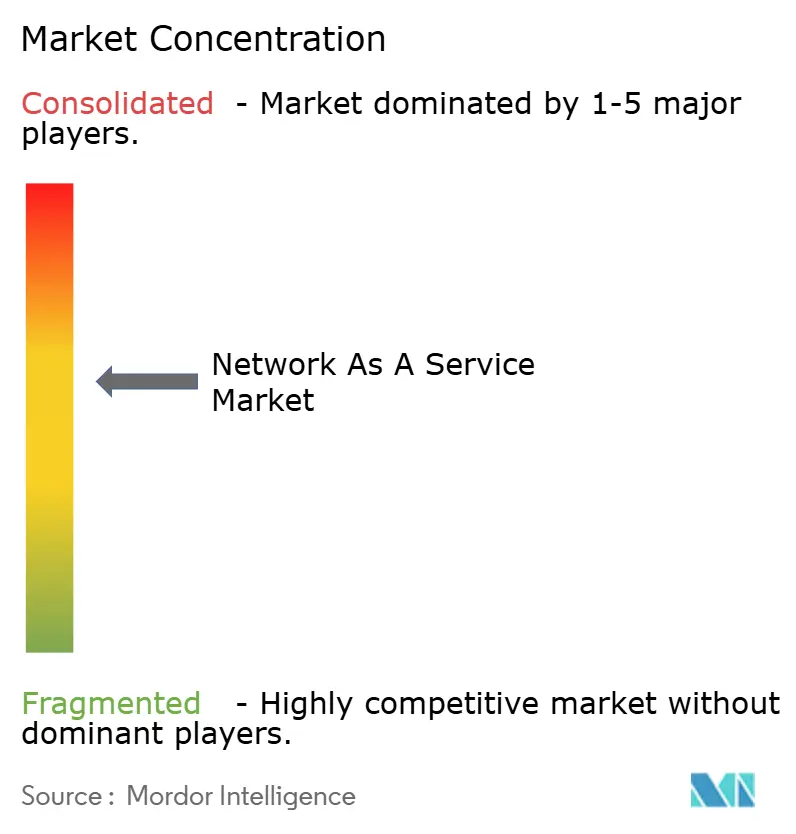
| Market Concentration | Medium |
Major Players *Disclaimer: Major Players sorted in no particular order Image © Mordor Intelligence. Reuse requires attribution under CC BY 4.0. | |
Network As A Service Market Analysis by Mordor Intelligence
The Network As A Service Market size was valued at USD 32.03 billion in 2025 and is estimated to grow from USD 39.96 billion in 2026 to reach USD 107.17 billion by 2031, at a CAGR of 21.81% during the forecast period (2026-2031).
Enterprises are scaling down capital-intensive network ownership and moving to subscription connectivity that aligns operating expenses with shifting demand. Financial leaders now treat network assets as an OpEx line item, a mindset reinforced by new lease-accounting rules that discourage on-balance-sheet hardware. Simultaneously, the convergence of software-defined wide-area networking and secure access service edge has rendered dedicated MPLS circuits economically unviable. Service providers are offering managed WAN bundles that integrate zero-trust security, AI-driven assurance, and application-aware routing into a single monthly fee, creating headroom for differentiated experiences across various verticals and regions.
Key Report Takeaways
- WAN-as-a-Service led with a 61.50% share of the Network As A Service market in 2025, while LAN-as-a-Service is forecast to expand at a 23.01% CAGR to 2031.
- Virtual CPE captured 42.80% of application revenue in 2025, whereas Network-as-API is poised for a 22.78% CAGR through 2031.
- Large enterprises accounted for 57.80% of spending in 2025, while small and medium enterprises are growing at a 22.60% CAGR.
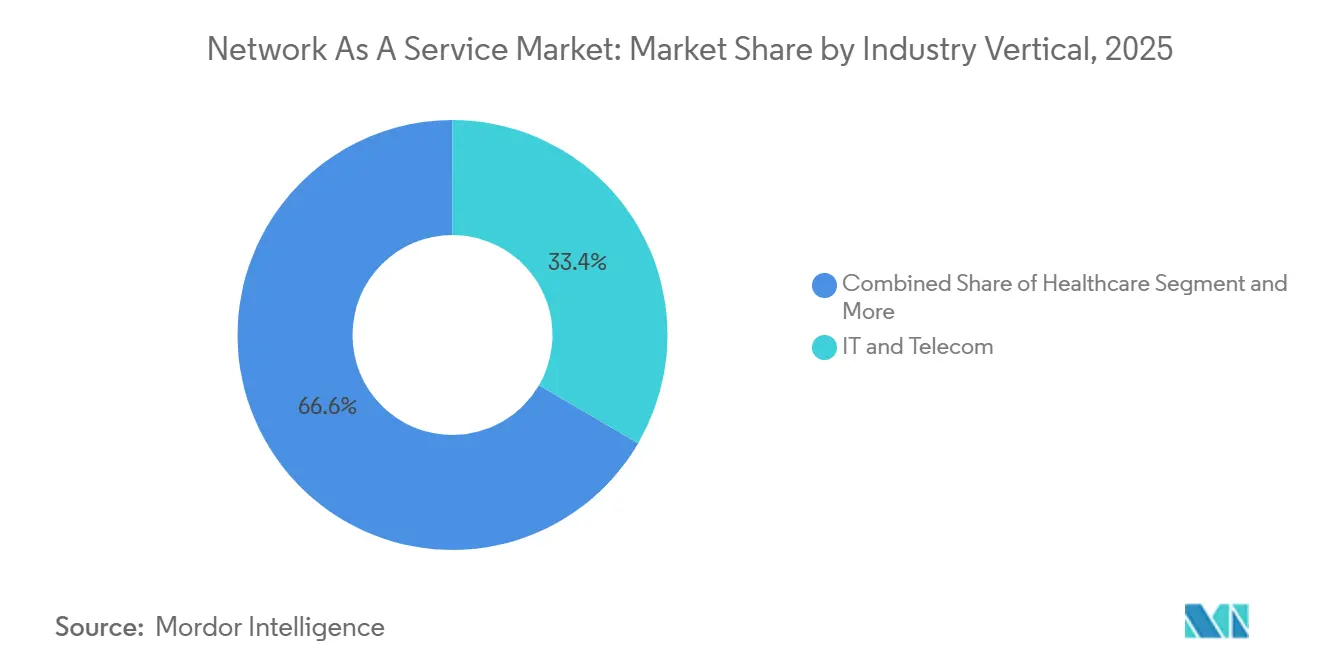
- IT and telecom contributed 33.40% vertical revenue in 2025, and healthcare is advancing at a 23.15% CAGR to 2031.
- Public-cloud-based deployments accounted for a 64.67% share in 2025, and hybrid NaaS is projected to grow at a 22.36% CAGR.
- North America retained 41.60% regional share in 2025, while Asia-Pacific is forecast to expand at a 22.95% CAGR through 2031.
Note: Market size and forecast figures in this report are generated using Mordor Intelligence’s proprietary estimation framework, updated with the latest available data and insights as of January 2026.
Global Network As A Service Market Trends and Insights
Drivers Impact Analysis*
| Driver | (~) % Impact on CAGR Forecast | Geographic Relevance | Impact Timeline |
|---|---|---|---|
| Cloud-First Network Transformation Roadmaps | +4.5% | Global | Medium term (2-4 years) |
| Shift from CapEx to OpEx Subscription Budgeting Pressure | +3.8% | Global | Short term (≤ 2 years) |
| SD-WAN and SASE Convergence Accelerating Managed WAN Refresh | +4.2% | North America and Europe | Medium term (2-4 years) |
| Campus-LAN NaaS Demand to Counter Wi-Fi 7 Power Spikes | +2.1% | Global | Short term (≤ 2 years) |
| AI-Driven Network Assurance Reducing MTTR below 5 min | +2.8% | North America and Asia-Pacific | Medium term (2-4 years) |
| Private-5G Network Slicing Sold As-a-Service by CSPs | +2.3% | Asia-Pacific and Europe | Long term (≥ 4 years) |
| Source: Mordor Intelligence | |||


Cloud-First Network Transformation Roadmaps
Hybrid workloads dominate IT spend, and connections to hyperscale cloud on-ramps are climbing sharply. Azure ExpressRoute and AWS Direct Connect each experienced 40% year-over-year connection growth in 2024, indicating that core applications are now increasingly residing outside of enterprise data centers[1]Microsoft Editors, “Azure ExpressRoute Growth 2024,” Microsoft, microsoft.com. Firms are replacing static MPLS circuits with programmable overlays that cut latency for SaaS by 30-50 milliseconds. Financial institutions, which cannot tolerate packet loss above 0.01%, are leading the adoption to protect real-time trading. The shortage of engineers trained in API-driven provisioning intensifies the demand for fully managed solutions that conceal complexity behind user-friendly portals. Consequently, providers embed orchestration APIs that allow enterprises to script bandwidth as code within DevOps pipelines.
Shift from CapEx to OpEx Subscription Budgeting Pressure
Revised IFRS 16 and ASC 842 rules recast owned hardware as a depreciating right-of-use asset, locking capital into long refresh cycles. Subscription NaaS converts fixed investments into elastic expenses, an arrangement prized by private equity portfolios that optimize EBITDA. Manufacturing groups leverage the model to throttle capacity during downturns without writing off equipment. Zero-based budgeting now forces IT leaders to justify spending annually, and pay-as-you-use circuits meet that hurdle more cleanly than multi-year hardware amortization. The shift accelerates vendor competition on service-level quality rather than box specifications, creating an incentive to bundle security and observability in a single invoice.
SD-WAN and SASE Convergence Accelerating Managed WAN Refresh
The union of SD-WAN transport and SASE security eliminates the need for legacy VPN concentrators and branch firewalls. More than 60% of new Prisma SASE subscriptions in 2024 replaced on-premises VPN hubs with cloud gateways able to inspect encrypted traffic at line rate. Enterprises now bypass headquarters backhaul, trimming WAN bandwidth fees by 40% and boosting app responsiveness for remote staff. Carriers respond by integrating SASE into managed WAN contracts, offering a single point of control for uptime and compliance. Retail and e-commerce groups adopt quickly because PCI-DSS segmentation is easier to enforce in policy-driven overlays than in static MPLS meshes.
AI-Driven Network Assurance Reducing MTTR below 5 min
AI operations platforms analyze massive telemetry streams to detect anomalies in real time. Mist AI ingests 200 billion data points each day and has cut help-desk tickets by half at early adopters. Cisco ThousandEyes correlates ISP routing changes with application degradation, steering traffic around congested paths before users complain. Vendors now guarantee 99.99% uptime, backed by credits, and are confident that machine learning can predict link failures 15 minutes ahead. This predictive capacity is crucial for video conferencing and industrial IoT, where even minor jitter can cascade into lost revenue. Providers price premium tiers on the promise that incidents will be resolved before service desks open.
Restraints Impact Analysis*
| Restraint | (~) % Impact on CAGR Forecast | Geographic Relevance | Impact Timeline |
|---|---|---|---|
| Persistent Data-Sovereignty and Residency Compliance Barriers | -1.9% | Europe and Asia-Pacific | Medium term (2-4 years) |
| Vendor Lock-In Fears around Proprietary Lifecycle Platforms | -1.5% | Global | Short term (≤ 2 years) |
| Complex Lease-Accounting Rules under IFRS 16/ASC 842 | -0.8% | Global | Short term (≤ 2 years) |
| Edge-Site Power Cost Volatility Impacting NaaS TCO | -1.2% | Global | Medium term (2-4 years) |
| Source: Mordor Intelligence | |||
Persistent Data-Sovereignty and Residency Compliance Barriers
GDPR, China’s Cybersecurity Law, and India’s forthcoming Data Protection Bill require providers to establish separate control planes in each jurisdiction. Replicated infrastructure fragments the global footprint and raises per-site cost, eroding economies of scale. Schrems II further blocks personal-data transfers from the EU to the United States, requiring contractual clauses that many buyers deem risky. Financial institutions face compounded complexity because Basel III mandates resilience testing across all hosting regions. When control planes cannot orchestrate distributed zones from a central console, enterprises deploy hybrid models that temper the value proposition of the Network-as-a-Service market.
Vendor Lock-In Fears around Proprietary Lifecycle Platforms
Enterprises balk at multi-year commitments that embed their automation scripts into closed ecosystems. Tools such as Cisco DNA Center and HPE GreenLake store configuration metadata in proprietary formats, complicating migrations. Custom APIs also deviate from open standards, such as NETCONF, forcing rewrites when switching suppliers. Although the Open Networking Foundation promotes P4 programmable switches as a path to vendor-neutral control, adoption remains thin. Buyers therefore hedge with dual-vendor strategies or pilot deployments only, suppressing the full conversion to subscription networking. The result is a measured rollout pace that trims short-term revenue even as long-term opportunity remains intact.
*Our forecasts treat driver/restraint impacts as directional, not additive. The impact forecasts reflect baseline growth, mix effects, and variable interactions.
Segment Analysis
By Type: WAN Dominance Meets LAN Disruption
In 2025, WAN-as-a-Service generated 61.50% of revenue, underscoring its role as the entry point for the Network As A Service market share. Multinationals with 50+ branches can capture immediate savings by replacing MPLS circuits with SD-WAN overlays, resulting in a 60% reduction in per-megabit costs. AI engines embedded in controllers dynamically steer traffic to the nearest cloud on-ramp, shrinking file transfer times between headquarters and public cloud. Service providers reinforce value through zero-touch edge devices that arrive pre-provisioned, thereby reducing deployment windows from weeks to hours.
LAN-as-a-Service, though smaller today, is growing at a 23.01% CAGR through 2031 as Wi-Fi 7 access points demand 802.3bt power budgets. Universities and hospitals that cannot fund wholesale switch upgrades pivot to campus-switch-as-a-service bundles that include power, analytics, and handset integration. Providers guarantee 10-gig uplinks for telepresence and electronic medical records, positioning LAN refresh as an operating expense rather than a capital hurdle. By converting campus networks into predictable subscriptions, suppliers expand the addressable pool of buyers, thereby increasing overall momentum in the Network As A Service market.


By Application: Virtual CPE Maturity Versus API Monetization
Virtual CPE captured 42.80% of application spend in 2025, reflecting the consolidation of routers, firewalls, and WAN optimizers onto x86 appliances. Branch offices reduce their hardware footprint by 70% and slash onsite service calls because zero-touch provisioning loads the full software stack at power-on. Bandwidth-on-demand supports temporary scale-ups at stadiums and conference centers, demonstrating the elasticity at the heart of the Network As A Service market.
Network-as-API, while nascent, is forecast to grow at a 22.78% CAGR to 2031. GSMA CAMARA specifications let developers program quality-of-service and device profiling directly from CI/CD pipelines[2]GSMA Analysts, “CAMARA: Telco Network APIs for Developers,” GSMA, gsma.com. Telecommunications operators expose 5G network functions, such as geofencing, dynamic SIM activation, and guaranteed bit rates, creating new revenue paths beyond traditional connectivity. As enterprise DevOps teams integrate networking calls into application code, value shifts from physical links to API consumption, opening up greenfield opportunities within the broader Network As A Service market.
By Organisation Size: Enterprise Scale Versus SME Agility
Large enterprises contributed 57.80% of 2025 revenue, buoyed by their ability to negotiate custom SLAs that include 4-hour hardware replacement and 99.99% uptime. Dedicated account teams co-create product roadmaps, ensuring ServiceNow integration or SOC 2 reporting lands in quarterly releases. The Network As A Service market size for this cohort aligns with global footprints that extract favorable unit pricing and amplify vendor lock-in.
Small and medium enterprises, however, are expanding at a 22.60% CAGR. Managed service providers act as turnkey partners, bundling help-desk support with circuits so SMEs can forego in-house engineers. Startups codify network provisioning in infrastructure-as-code templates, treating links as ephemeral resources that exist and are destroyed with each build. Predictable monthly pricing protects slim cash flows, helping this segment accelerate adoption even faster than the overall Network As A Service market.
By Industry Vertical: Healthcare Acceleration and IT Maturity
IT and telecom held a 33.40% share in 2025, leveraging internal expertise to exploit early networking advances. BFSI firms trail closely, compelled by algorithmic trading engines and fraud analytics that require sub-millisecond round-trip times. In contrast, healthcare is slated for a 23.15% CAGR, the fastest among all verticals. Telehealth served 50 million US patients in 2024 and demands HIPAA-compliant segmentation, prompting hospitals to outsource network security to providers certified for protected health data[3]Healthcare IT News Staff, “Telehealth Adoption Continues to Grow in 2024,” Healthcare IT News, healthcareitnews.com.
Manufacturing explores private 5G slices to orchestrate robots and augmented-reality inspections, while retail scales bandwidth to 10 times during seasonal peaks without over-provisioning year-round. Government adoption lags due to the 18-month FedRAMP certification process, although zero-trust mandates inched forward in late 2025. Energy utilities pilot secure NaaS backbones for SCADA telemetry but proceed cautiously due to operational technology risk.
By Deployment Model: Public Cloud Dominance and Hybrid Growth
Public-cloud NaaS secured 64.67% deployment share in 2025, reflecting the gravitational pull of AWS Transit Gateway, Azure Virtual WAN, and Google Cloud Network Connectivity Center. Enterprises shed on-premises controllers, handing software updates and patches to hyperscalers and cutting operational overhead by half.
Hybrid NaaS, growing at 22.36% CAGR, satisfies institutions that must straddle on-premises VMware clusters and multiple public clouds. Policy engines provide a single framework across heterogeneous substrates, eliminating swivel-chair management. Private-cloud models remain critical for defense and pharma, while on-prem subscription deals let enterprises monetize existing hardware through sale-leaseback, converting sunk assets into recurring OpEx.
Geography Analysis
North America claimed 41.60% of the Network As A Service market in 2025, underpinned by Fortune 500 migrations from MPLS to SD-WAN, which lower network spend by 40%. Dense cloud interconnection fabrics mean most U.S. enterprises have access to at least three availability zones within 20 milliseconds of end users[4]AWS Team, “AWS Transit Gateway,” Amazon Web Services, aws.amazon.com. Federal procurement funnels business toward providers holding impact-level clearances, so incumbents such as AT&T, Verizon, and Lumen defend share despite new entrants. Low-latency 5G slices for Wall Street trading demonstrate premium use cases that are willing to pay for microsecond-grade jitter control.
Asia-Pacific is on course for a 22.95% CAGR through 2031. India’s Digital India initiative anchors government cloud adoption, and domestic data-localization clauses ensure demand for regional control planes. China Mobile and Huawei roll out private 5G at industrial hubs, while Japan’s post-earthquake resilience push drives enterprises to multi-region NaaS architectures. South Korea’s smart city sensors require priority slices for emergency vehicles, and Australia’s mines rely on private 5G to guide autonomous trucks across 200 kilometers of outback terrain. Collectively, these programs expand the Network As A Service market across the world’s fastest-growing economies.
Europe experiences fragmented deployment because the GDPR requires in-region data processing, which inflates per-site costs and prevents global optimization. Sovereign cloud zones in Germany and France ensure compliance, but they also demand parallel investments in staffing and monitoring. The United Kingdom’s regulatory divergence post-Brexit further complicates matters, compelling vendors to duplicate infrastructure. Meanwhile, Middle East sovereign funds are backing hyperscale data-center interconnects to achieve Vision 2030 milestones, thereby reinforcing demand in Saudi Arabia and the UAE. Africa advances slowly outside of South Africa and Egypt, as mobile-first infrastructure competes for limited spectrum, although pan-African fiber projects by Liquid Intelligent Technologies are beginning to unlock latent enterprise demand.

Regulatory Landscape
Regulation affecting NaaS is tightening around cross-border provision of connectivity services and where network control-plane data can be processed. In the European Union, the European Commission introduced a proposal for a Digital Networks Act on January 21, 2026, signaling a shift from directive-based rules toward a directly applicable regulation model and a Single Passport concept intended to simplify multi-country operations for electronic communications network and service providers.
Data sovereignty is shaping deployment architectures and partner selection across multiple jurisdictions. Nigeria’s National Information Technology Development Agency (NITDA) formalized the National Cloud Policy 2025 on October 2, 2025, which mandates local data residency requirements for government digital assets and elevates the role of indigenous service integrators for government cloud provisioning. In Portugal, Resolution of the Council of Ministers No. 102/2026 approved the National Plan for Sovereign Cloud on May 27, 2026, adding explicit security and resilience requirements for public administration cloud adoption that affect how NaaS providers design in-country control planes and operational processes.
Value Chain Analysis
The NaaS value chain starts with physical and virtual infrastructure (metro and long-haul fiber, 5G access, optical transport, edge sites, and x86/uCPE), then layers orchestration, assurance, and security to deliver self-service connectivity as recurring services. Core upstream participants include network equipment and optical vendors (for example, Ciena in optical transport), cloud providers and interconnect platforms (AWS, Microsoft Azure, Equinix), and co-location or internet exchange operators that host NaaS points of presence. Midstream, communications service providers and digital-first connectivity specialists package WAN/LAN/DCI and private 5G capabilities into catalog-driven offers, while software vendors supply policy, SASE, and AIOps tooling that underpins SLA-backed delivery.
Downstream delivery and scaling increasingly hinge on standardized automation between buyers, sellers, and wholesalers. Interoperability frameworks such as MEF LSO and TM Forum Open APIs are becoming the operational backbone for multi-provider fulfillment, supported by initiatives such as Sparkle and Orchest Technologies interconnecting orchestration using MEF LSO APIs (May 2025) and BT expanding integration of Global Fabric within Equinix data centers to extend reach across 140 points of presence in 40 countries (February 2025). Recent platform moves also highlight the chain from transport to portal-led activation, including Cirion launching an on-demand NaaS connectivity service in Latin America powered by Ciena optical technology and coordinated through Carma’s platform (May 2026), which reinforces the role of digital marketplaces and orchestration layers in turning capacity into consumable, API-enabled services.
Competitive Landscape
The Network As A Service industry displays moderate concentration. The top five suppliers, Cisco, HPE, AT&T, Verizon, and IBM, hold a combined revenue share of roughly 45%. Cisco strengthened observability with its USD 28 billion acquisition of Splunk, embedding anomaly detection into SD-WAN and reducing the mean time to repair to under five minutes. HPE finalized the USD 14 billion Juniper deal in November 2025, folding Mist AI campus switching into GreenLake subscriptions. Verizon’s USD 20 billion Frontier acquisition expands last-mile fiber to 25 million premises, enabling bandwidth-on-demand for suburban branches.
Telecom incumbents reposition as managed service integrators, while cloud-native challengers Cato Networks and Aryaka target mid-market buyers with 30-day deployments. CAMARA APIs threaten to commoditize connectivity by exposing 5G functions directly to developers, shifting pricing power toward software layers. Edge computing remains an open field because cooling and energy volatility hinder SLA guarantees below 10 milliseconds. Vendors that co-locate compute and networking at power-dense micro-data centers may seize early advantage as AI workloads move closer to users.
Network As A Service Industry Leaders
DXC Technology Company
Cisco Systems Inc.
AT&T Intellectual Property
Verizon
TD SYNNEX Corporation
- *Disclaimer: Major Players sorted in no particular order

Market Opportunities and Future Outlook
A whitespace is emerging around cloud-to-cloud and data center-to-data center connectivity delivered as a self-service, software-controlled layer, rather than as bespoke interconnect projects. Lumen’s completion of its USD 475 million acquisition of Alkira in July 2026 illustrates how established providers are investing to expand NaaS from north-south access into east-west multi-cloud connectivity, bringing a cloud networking control plane into an operator-led portal and commercial model. This broadens opportunity for Network-as-API and programmable bandwidth constructs that align with DevOps workflows already pushing automation into infrastructure operations.
A second opportunity focuses on sovereign and residency-constrained deployments where enterprises and governments need in-country control planes, audited operations, and certified partners. Nigeria’s National Cloud Policy 2025 (NITDA) and Portugal’s 2026 National Plan for Sovereign Cloud create demand signals for localized governance models that favor providers offering compliant hosting, security assurance, and integrated service management. On the supply side, ecosystem partnerships such as Rakuten Symphony and Lightstorm’s sovereign NaaS platform initiative (March 2026) show active investment in regionalized platforms spanning India, the Middle East, Africa, and Asia-Pacific, enabling operators and integrators to productize compliant NaaS catalogs without rebuilding orchestration from scratch.
Recent Industry Developments
- July 2026: Lumen Technologies completed its USD 475 million acquisition of Alkira to add a cloud networking control plane to its NaaS portfolio. The move targets multi-cloud and data center connectivity, extending NaaS beyond access circuits into east-west traffic management. Integration into Lumen’s self-service experience raises competitive pressure on providers that lack cloud-native orchestration for distributed AI and application workloads.
- May 2026: Cirion Technologies launched a Network-as-a-Service platform across its 105,000 km proprietary fiber network in Latin America, enabling customers to activate and scale services through a digital portal. The launch pushes NaaS adoption into a region where enterprises often contend with heterogeneous connectivity and cross-border operational complexity. It also strengthens the role of fiber-rich regional carriers in competing with global NaaS providers on reach and speed of provisioning.
- November 2025: HPE completed its acquisition of Juniper Networks, bringing Mist AI into HPE GreenLake offerings aligned with NaaS-style consumption. The combination tightens the linkage between AI-driven operations and subscription networking, especially for campus and branch deployments. It also increases the importance of integrated assurance and automation in vendor selection as buyers seek fewer platforms to manage LAN and WAN services.


Research Methodology Framework and Report Scope
Market Definition and Coverage
This market is defined as revenue earned from delivering enterprise networking functions on a subscription and on-demand basis, where the network is operated and managed as a service rather than owned and run fully in-house.
Scope exclusions: This sizing excludes pure hardware resale, one-off professional services, and self-hosted SD-WAN appliances.
Segmentation Overview
- By Type
- LAN-as-a-Service
- WAN-as-a-Service
- Campus-Switch-as-a-Service
- Data-Centre-Interconnect-as-a-Service
- Private-5G-as-a-Service
- By Application
- Virtual CPE (vCPE)
- Bandwidth-on-Demand (BoD)
- Integrated Network-Security-as-a-Service
- Virtual Private Network (VPN)
- Private Network Slice-as-a-Service
- Network-as-API
- By Organisation Size
- Large Enterprises
- Small and Medium Enterprises (SMEs)
- By Industry Vertical
- IT and Telecom
- BFSI
- Healthcare
- Manufacturing
- Retail and E-commerce
- Government and Public Sector
- Other Industry Verticals
- By Deployment Model
- Public-Cloud-Based NaaS
- Private-Cloud-Based NaaS
- Hybrid NaaS
- On-Prem Subscription NaaS
- By Geography
- North America
- United States
- Canada
- Mexico
- South America
- Brazil
- Argentina
- Rest of South America
- Europe
- Germany
- United Kingdom
- France
- Italy
- Spain
- Rest of Europe
- Asia-Pacific
- China
- Japan
- India
- South Korea
- Australia
- Rest of Asia-Pacific
- Middle East and Africa
- Middle East
- Saudi Arabia
- United Arab Emirates
- Turkey
- Rest of Middle East
- Africa
- South Africa
- Egypt
- Nigeria
- Rest of Africa
- Middle East
- North America
Data Sources, Market Sizing, and Validation
Desk Research
Desk work starts with public signals that describe how fast enterprise networks are modernizing, and how spend is shifting toward subscription delivery. We leaned on sources such as the International Telecommunication Union (ITU) for connectivity baselines, US FCC releases for broadband and enterprise network indicators, OECD digital economy publications for cross-country comparisons, and NIST guidance for security and network standards that influence service adoption.
To convert those signals into a usable model, we also reviewed company annual reports, investor presentations, and product documentation to see what is actually being priced as a service, and what remains as equipment or project work. In a few places, paid subscriptions for company financials and intelligence and news and financials were used to verify revenue mix direction and timing of major service launches. These desk sources are not exhaustive, and we checked additional public references to collect data, validate assumptions, and clarify gaps.
Primary Interviews and Surveys
Primary work was used to pressure-test scope and pricing logic with a mix of network service providers, channel partners, large enterprise buyers, and IT decision makers managing WAN, LAN, and cloud connectivity. For a global view, we spoke with contacts across APAC, EMEA, and the Americas so adoption patterns, contract structures, and typical ramp-up timelines could be normalized before finalizing assumptions.
Distribution of primary research fieldwork respondents
| Company type | Respondent position | Region |
|---|---|---|
| Top tier: 27% | CXOs: 13% | APAC: 51% |
| Mid tier: 57% | Functional/Unit leaders: 33% | EMEA: 31% |
| Smaller Players: 16% | Managers: 54% | Americas: 18% |
Market-Sizing & Forecasting
Our core model uses a top-down demand pool approach where enterprise networking spend is reconstructed by region, then filtered through NaaS adoption and serviceable scope assumptions. We corroborate the result with selective bottom-up checks using sampled provider revenue disclosures, channel checks on typical contract values, and a volume-times-ASP sanity check for common NaaS bundles.
Inputs were kept practical and traceable, so the approach does not rely on hard-to-access datasets. Key variables include enterprise cloud migration intensity, SD-WAN and SASE style adoption as a precursor to managed delivery, the share of networking budgets moving to operating expense, average subscription term lengths, and pricing progression for bandwidth and managed overlays. Where coverage is uneven by country, we apply regional proxy ratios that were validated in interviews, then recheck against any public disclosures available for that geography.
For the forecast, scenario analysis captures differences in adoption speeds, and the chosen base case is anchored to what interviewees described as realistic procurement cycles and rollout pace. Assumptions are updated as contract structures and packaging changes show up in the market, which helps keep the forward curve consistent with how NaaS is sold.
Data Validation & Update Cycle
Before sign-off, we triangulate estimates against independent indicators such as telecom and cloud infrastructure investment trends, enterprise IT spend direction, and observed shifts from product to subscription revenue mix. If an output looks unusual, we recheck the drivers, and trigger follow-up outreach to confirm whether the change is real or a modeling artifact.
The full file goes through multi-step analyst review so assumptions, currency conversions, and year alignment remain consistent across regions and the time series. Reports are refreshed annually, and interim updates are made when material events occur, such as major service launches, regulatory changes that affect enterprise networking, or sharp pricing moves. Right before delivery, a final pass is completed to ensure the latest public signals are reflected.
Mordor Intelligence's Network As A Service Market Growth Trends and Forecasts Market Estimate Compared With Other Published Estimates
Published market numbers for NaaS can appear far apart, even when sources describe similar end use. The main reason is that counted revenue streams are not always the same, and the timing of updates also differs. In practice, the gap usually traces back to what is treated as recurring service revenue versus project work, and to how bundles that include security and managed support are recorded.
Some external estimates fold in adjacent security-as-a-service and broader managed network services, which expands the total addressable value. For Mordor Intelligence, only subscription-based delivery of LAN, WAN, campus-switch, and data-center-interconnect functions is counted, and pure hardware resale, one-off professional services, and self-hosted SD-WAN appliances are left out.
Benchmark comparison
| Source | Market Size | Gaps in Research Methodology |
|---|---|---|
| Mordor Intelligence | USD 39.96 B (2026) | |
| Industry Publisher A | USD 30.10 B (2025) | Uses a different base year and appears to apply a broader application lens that can group SD-WAN, VPN, bandwidth on demand, and integrated security services together, which can shift what is counted as NaaS revenue. |
| Industry Publisher B | USD 21.30 B (2025) | Leans toward a narrower revenue pool that is closer to connectivity-style NaaS, and the shorter horizon and category framing can omit campus switching, DCI-related delivery, or bundled managed support fees. |
The spread in the table mainly comes down to scope and timing, not just math. By keeping inclusions tied to recurring, on-demand network function delivery and validating adoption and pricing paths through interviews, the final number stays explainable and repeatable when clients revisit the same inputs.


Key Questions Answered in the Report
How large is the Network As A Service market today and what growth is expected by 2031?
The Network As A Service market size reached USD 39.96 billion in 2026 and is projected to climb to USD 107.17 billion by 2031, translating to a 21.81% CAGR.
Which deployment model is most popular among enterprises?
Public-cloud-based Network As A Service accounts for 64.67% of deployments in 2025, favored for its built-in scalability and managed control planes.
What type segment leads revenue within the Network As A Service market?
WAN-as-a-Service dominates at 61.50% share in 2025, driven by enterprises replacing MPLS circuits with SD-WAN overlays.
Which region is growing fastest in adoption?
Asia-Pacific is projected to record a 22.95% CAGR through 2031 thanks to cloud mandates in India and private 5G rollouts in China, Japan, and South Korea.
Why are enterprises migrating from CapEx to OpEx in networking?
Revised accounting standards classify owned hardware as depreciating assets, so subscription models let firms treat connectivity as variable expense, improving cash flexibility.
How does AI improve managed network service quality?
AI-driven assurance platforms analyze billions of telemetry points to predict failures, enabling providers to achieve mean-time-to-repair under five minutes and uphold 99.99% uptime commitments.
Page last updated on:


