Observability Market Size and Share
Market Overview
| Study Period | 2020 - 2031 |
|---|---|
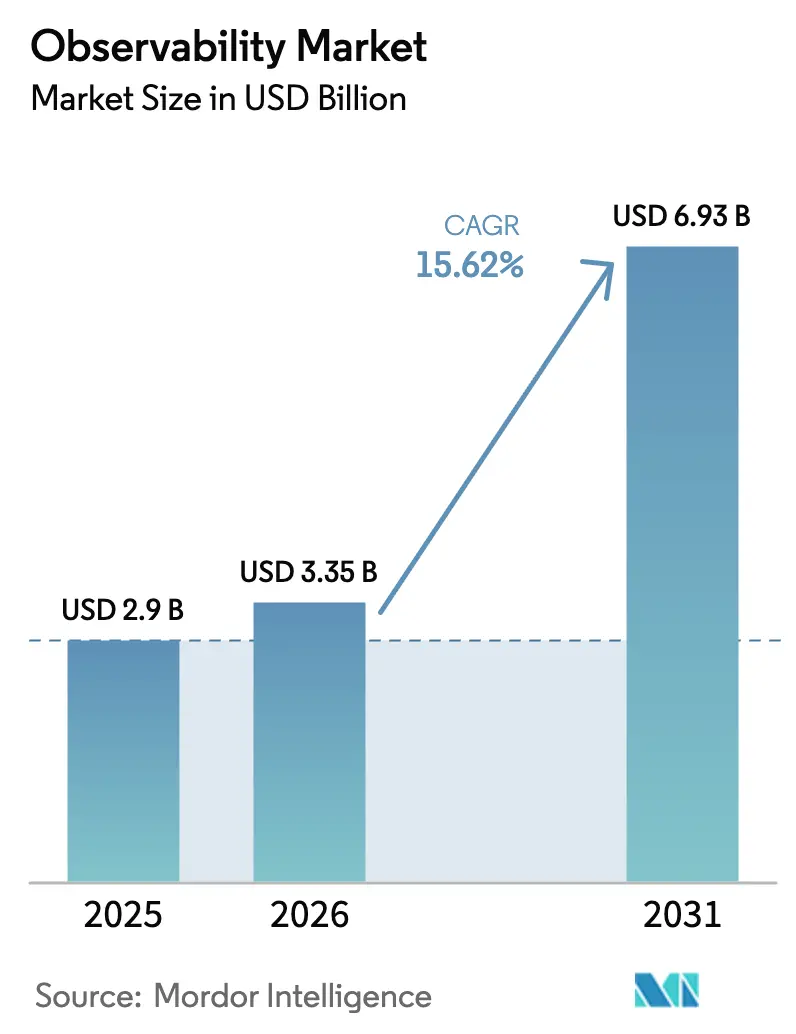
| Market Size (2026) | USD 3.35 Billion |
| Market Size (2031) | USD 6.93 Billion |
| Growth Rate (2026 - 2031) | 15.62% CAGR |
| Fastest Growing Market | Asia Pacific |
| Largest Market | North America |
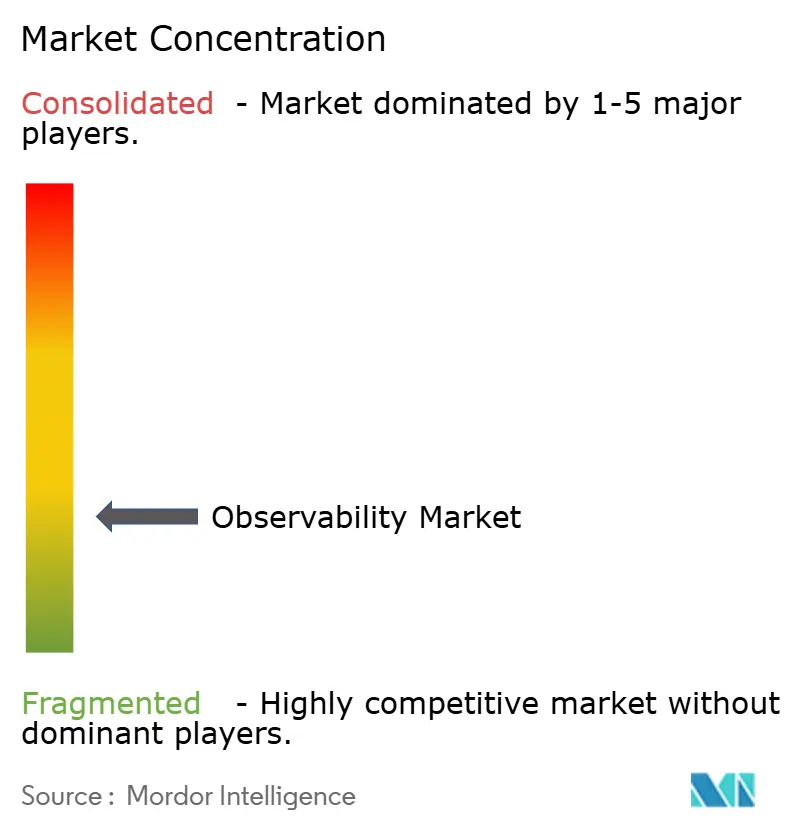
| Market Concentration | Low |
Major Players*Disclaimer: Major Players sorted in no particular order Image © Mordor Intelligence. Reuse requires attribution under CC BY 4.0. | |
Observability Market Analysis by Mordor Intelligence
The observability market size was valued at USD 2.9 billion in 2025 and estimated to grow from USD 3.35 billion in 2026 to reach USD 6.93 billion by 2031, at a CAGR of 15.62% during the forecast period (2026-2031). Enterprises are shifting from reactive monitoring toward proactive observability to manage cloud-native, AI-driven, and edge-centric workloads, and three technology waves generative AI, rapid cloud adoption, and edge computing stand out as the primary demand catalysts. Vendors that align platform roadmaps to these trends capture higher expansion revenue because buyers now value deep trace correlation, real-time AI model insights, and latency-aware analytics. Competitive intensity is rising as established APM leaders add AI observability while younger specialists position pricing around total telemetry costs. Finally, sustainability mandates are steering attention to sampling, intelligent routing, and carbon-aware data centers that complement baseline performance goals.
Key Report Takeaways
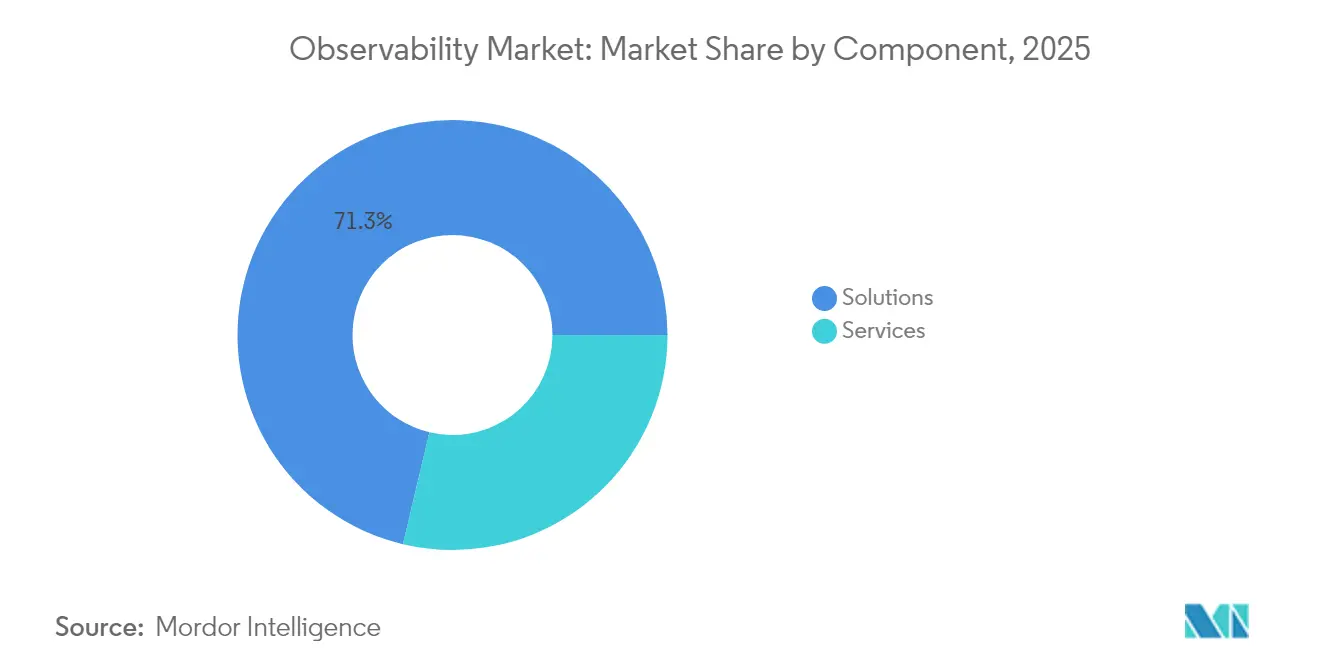
- By component, Solutions held a 71.30% revenue share of the observability platform market in 2025, whereas Services are projected to advance at a 17.55% CAGR through 2031.
- By deployment mode, Cloud/SaaS captured 68.40% of the observability market share in 2025, while Hybrid is expected to expand at a 20.12% CAGR.
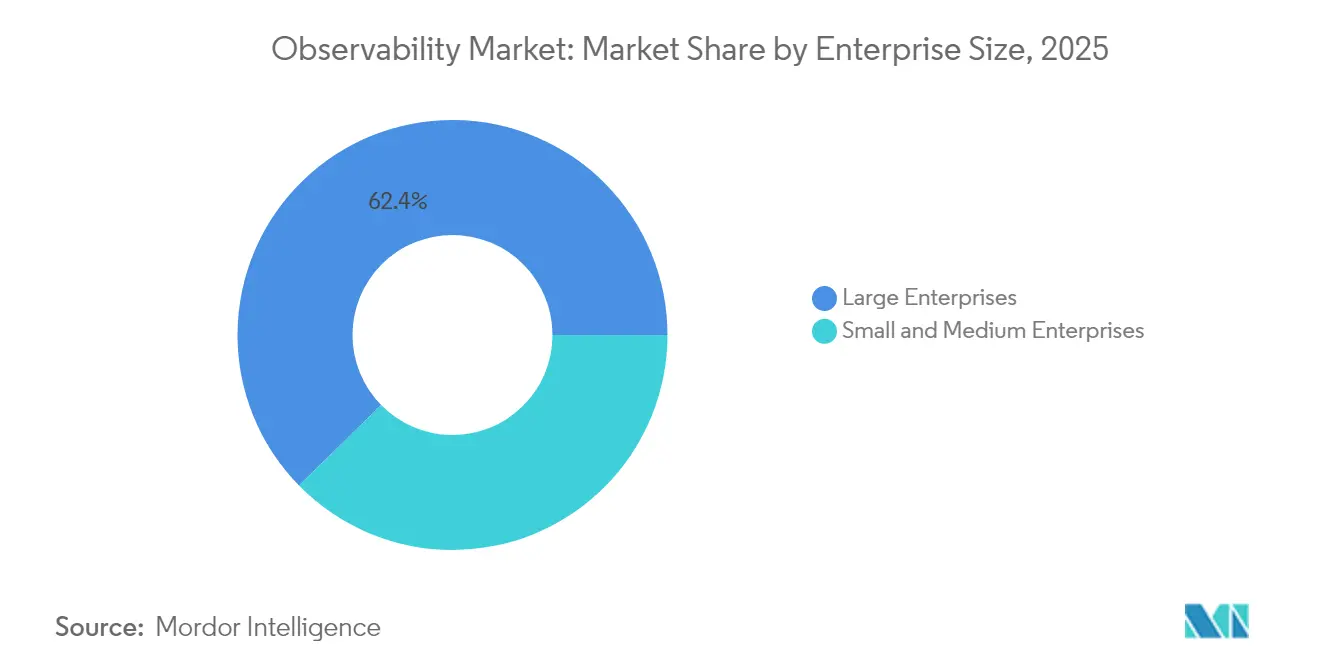
- By enterprise size, Large Enterprises accounted for 62.35% of the observability market size in 2025, yet SMEs are forecast to grow at a 17.04% CAGR.
- By end-user vertical, IT and Telecom generated 29.55% of revenue in 2025; Healthcare and Life Sciences is set to rise at a 21.86% CAGR through 2031.
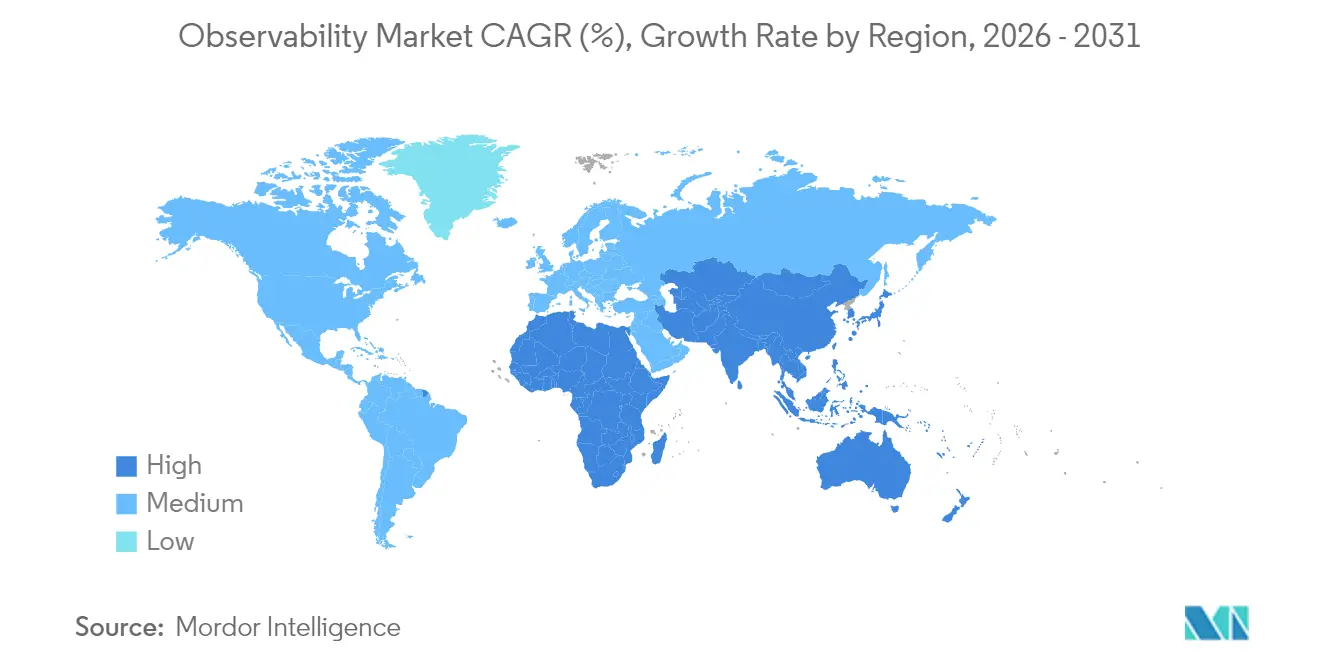
- By region, North America led with 36.65% revenue share in 2025, whereas Asia-Pacific is on course for a 19.62% CAGR, the fastest globally.
Note: Market size and forecast figures in this report are generated using Mordor Intelligence’s proprietary estimation framework, updated with the latest available data and insights as of 2026.
Global Observability Market Trends and Insights
Drivers Impact Analysis*
| Driver | (~) % Impact on CAGR Forecast | Geographic Relevance | Impact Timeline |
|---|---|---|---|
| AI-native instrumentation slashes MTTR | +3.2% | North America and EU with global ripple | Medium term (2-4 years) |
| Shift to distributed, event-driven stacks | +2.8% | Global, strongest in APAC cloud-first markets | Long term (≥ 4 years) |
| Cloud-first transformation budgets | +2.5% | North America, EU, APAC | Medium term (2-4 years) |
| OpenTelemetry standardisation | +2.1% | Global, early in tech-forward hubs | Long term (≥ 4 years) |
| Generative-AI demand for model visibility | +2.9% | North America, EU, China | Short term (≤ 2 years) |
| Telco edge build-outs and 5G rollout | +1.8% | APAC, North America, Europe | Medium term (2-4 years) |
| Source: Mordor Intelligence | |||
AI-native instrumentation slashes MTTR
Up to 90% faster incident resolution is being recorded when automated root-cause analysis augments human investigations.[1]Ciroos, “AI-Powered Observability for Autonomous Operations,” ciroos.ai Flip’s DevOps-focused LLM shows how domain-trained agents cluster repetitive alerts and predict cascading failures before customer impact. Financial institutions such as Capital One embed AI telemetry to sharpen fraud detection, thereby translating engineering insights into regulatory compliance gains. These results encourage budget owners to position observability as a competitive differentiator, not a sunk operational cost. As the observability market evolves, vendors integrating agentic reasoning capabilities will obtain stickier contracts because customers prefer platforms that learn from live data and close incidents autonomously.
Shift to distributed, event-driven architectures
Microservices and serverless designs generate 50–100 times more telemetry than monoliths, overwhelming legacy monitoring back ends.[2]CNCF, “OpenTelemetry Is Expanding into CI/CD Observability,” cncf.io Event streams, message queues, and asynchronous processing create blind spots that force enterprises to deploy OpenTelemetry-native correlation so every span aligns with a business transaction. E-commerce and banking rely on this visibility to protect revenue at peak loads, while manufacturers track IoT sensors and edge devices for predictive maintenance. High telemetry volumes drive interest in pipeline filtering tools that keep storage budgets under control. This architectural pivot secures a durable tailwind for the observability market because each new microservice typically adds more traces, logs, and metrics than the component it replaces.
Cloud-first transformation budgets expand
Multi-cloud adoption by 43% of financial institutions in 2024 exposed limitations of on-prem APM suites and channeled dollars into cloud-native observability subscriptions.[3]New Relic, “Asia Pacific Observability Highlights,” newrelic.com Usage-based pricing aligns expenses with workloads, enabling mid-market buyers to adopt enterprise-grade tooling formerly reserved for Fortune 500 budgets. Healthcare systems accelerating tele-health rollouts lean on real-time monitoring to protect patient safety. The funding surge confirms that the observability market is now a line-item in digital transformation programs rather than an optional tooling expense.
OpenTelemetry’s standardisation unlocks vendor-agnostic growth
Azure, AWS, and Google Cloud now emit OTLP natively, removing format conversion overhead and vendor lock-in fears.[4]Microsoft, “Making Azure the Best Place to Observe Your Apps with OpenTelemetry,” techcommunity.microsoft.comCertification schemes from CNCF and the Linux Foundation have created a skilled global workforce able to deploy standard collectors across heterogeneous estates. Manufacturing firms embracing multi-supplier industrial IoT need this neutrality to integrate plant-floor telemetry with enterprise dashboards. As interoperability fears fade, decision makers view the observability market as an ecosystem rather than siloed tools.
Restraints Impact Analysis*
| Restraint | (~) % Impact on CAGR Forecast | Geographic Relevance | Impact Timeline |
|---|---|---|---|
| Escalating observability data storage costs | -2.4% | Global, most acute in data-intensive sectors | Short term (≤ 2 years) |
| Tool-chain sprawl and vendor lock-in risk | -1.8% | North America and EU enterprise environments | Medium term (2-4 years) |
| Talent gap in observability engineering | -1.6% | Global, sharper in emerging markets | Long term (≥ 4 years) |
| Sustainability pressure on telemetry carbon | -1.2% | EU, North America, expanding elsewhere | Medium term (2-4 years) |
| Source: Mordor Intelligence | |||
Escalating observability data storage costs
Telemetry bills now exceed primary infrastructure spend for some enterprises, forcing buyers to deploy aggressive sampling and retention strategies. AWS CloudWatch users have realized up to 96.5% log cost savings through container insights optimization. FinOps teams created inside 90% of Fortune 50 firms track observability spend as a standalone KPI. Platform providers that couple ingestion with real-time filtering gain an edge in the observability market by turning cost control into a product feature.
Tool-chain sprawl and vendor lock-in risk
The average enterprise juggles five or more monitoring tools, driving switching costs and integration headaches. Proprietary query languages can restrict migration even when telemetry formats are open. Consolidation is therefore a strategic priority, prompting large vendors to acquire startups that fill portfolio gaps. Integration specialists also benefit, yet the friction still subtracts growth points from the observability market.
*Our forecasts treat driver/restraint impacts as directional, not additive. The impact forecasts reflect baseline growth, mix effects, and variable interactions.
Segment Analysis
By Component: Services Accelerate Platform Implementation
The Services piece represented the fastest growth path with an 17.55% CAGR, whereas Solutions retained a 71.30% revenue share in 2025. This split underscores how enterprises need advisory and managed expertise that pairs with platform software to unlock full value. Integration teams design OpenTelemetry pipelines, optimize sampling, and align dashboards with business KPIs, enabling organizations to move beyond infrastructure monitoring into outcome-based analytics.
In practice, complex rollouts involve professional services for deployment, managed services for ongoing tuning, and consulting engagements that link SLA breaches to revenue risk. Demand spikes when AI observability is on the roadmap because in-house data scientists rarely own operational tooling skills. After service providers complete the build phase, customers often scale usage by activating additional modules, expanding the observability market size across post-implementation years.


By Deployment Mode: Hybrid Models Bridge Sovereignty Gaps
Cloud/SaaS consumed 68.40% of spending in 2025, yet Hybrid is forecast for a 20.12% CAGR as regulators tighten residency rules and as edge nodes proliferate. The observability market size for Hybrid deployments advances because buyers want cloud elasticity combined with on-prem isolation for pii and trade secrets.
Financial services rollouts often centralize dashboards in the cloud but keep raw logs inside geo-fenced clusters, while manufacturing sites push observability to plant-floor edge gateways to avoid uplink congestion. Vendors that ship single control planes capable of running collectors in any environment satisfy these sovereignty requirements without duplicating tooling, and thereby accumulate incremental observability market share through upselling.
By Enterprise Size: SMEs Embrace Consumption Models
Large Enterprises controlled 62.35% of 2025 revenue, but SMEs are expanding adoption at a 17.04% CAGR as usage-based licensing lowers entry barriers. Consumption meters align spend with business scale, enabling startups to instrument services early rather than after failures become brand damaging.
The observability platform industry benefits when small teams rely on auto-discovery and opinionated dashboards, removing the need for dedicated Site Reliability Engineers. As SMEs grow, module attach rates rise, compounding contract value and lifting the overall observability market.
By End-user Vertical: Healthcare Drives Digital Transformation
IT & Telecom contributed 29.55% of revenue in 2025, but the Healthcare and Life Sciences segment is projected to climb at a 21.86% CAGR on the back of tele-health, AI diagnostics, and strict regulatory oversight. The observability market size linked to Healthcare workloads will surpass many traditional verticals because downtime or bias directly affects patient safety.
Hospitals build business observability views that combine application latency with patient throughput metrics, while pharmaceutical manufacturers track batch integrity across distributed MES systems. These specialized needs support a cadre of vendors focusing on HIPAA and GxP compliant observability, and they intensify feature roadmaps around audit trails, immutable logging, and anomaly explanations.
By Application: DevOps Integration Expands Beyond Infrastructure
DevOps & APM remains the anchor application, but Security, Data, and AI observability lines are growing faster. Data quality monitoring protects analytics pipelines from silent errors that skew executive dashboards, stimulating fresh license growth in the observability market.
Vendors increasingly bundle performance, security, and business views in one SKU to shrink tool sprawl. This alignment to cross-functional workflows attracts budget from both operations and business intelligence teams, expanding total addressable observability market share.
Geography Analysis
North America held 36.65% of spending in 2025, benefiting from early adoption curves, deep cloud penetration, and frameworks such as SOX and HIPAA that codify monitoring requirements. Financial firms instrument trade flows end-to-end to meet audit thresholds, while tech majors foster open-source ecosystems that accelerate community training. Growth remains steady as enterprises optimize existing stacks for AI workloads and edge extensions, sustaining sizeable demand within the observability market.
Asia-Pacific is projected to grow at a 19.62% CAGR, the fastest worldwide. Median annual outage costs reached USD 19.07 million, the highest globally, pushing executives to invest in proactive incident prevention. Governments prioritizing digital sovereignty often insist on hybrid deployments, which fuels demand for multi-tenant platforms that can localize data while preserving global dashboards. Telecommunications and advanced manufacturing plants in Japan, South Korea, and Singapore deploy 5G and Industry 4.0 stacks, generating rich telemetry that contributes materially to the observability market.
Europe grows steadily amid GDPR, the EU AI Act, and sustainability policies that motivate spend on privacy-aware and carbon-efficient telemetry pipelines. Enterprises often prefer hybrid topologies that keep sensitive datasets in-region. Vendors embedding data minimization, encryption at rest, and carbon calculators win bids, reinforcing the observability market’s regulatory alignment narrative.

Competitive Landscape
The competitive field is moderately fragmented. Datadog recorded USD 3.3 billion revenue in 2025 and continues platform expansion via acquisitions of Eppo and Metaplane, melding feature flags and data observability into its core. Splunk, Dynatrace, and Grafana anchor adjacent positions, holding the bulk of APM and log management mindshare.
New entrants address cost containment and AI specificity. Dash0 markets transparent pricing to mitigate bill shock, while ControlTheory raised USD 5 million to automate usage governance. Edge-native challengers target telco and manufacturing workloads with site-local analytics that bypass central ingestion limits.
Strategic consolidation accelerates as vendors seek breadth. SUSE bought StackState to fold topology mapping into its Kubernetes stack, Broadcom unveiled WatchTower to integrate mainframe telemetry with cloud dashboards, and Cisco introduced a vendor-agnostic full-stack suite. Patent filings on selective log access and resource-aware collectors point to ongoing innovation, ensuring the observability market remains dynamic.
Observability Industry Leaders
Broadcom Inc.
Dynatrace LLC
GitLab B.V.
IBM Corporation
LogicMonitor Inc.
- *Disclaimer: Major Players sorted in no particular order

Recent Industry Developments
- June 2025: Ciroos raised USD 21 million to expand its AI SRE teammate, claiming 90% faster incident closure
- May 2025: Datadog posted USD 762 million Q1 revenue and acquired Eppo and Metaplane, enhancing experimentation and data observability
- April 2025: ControlTheory emerged from stealth with USD 5 million seed funding to tackle observability cost overruns
- February 2025: New Relic unveiled the Intelligent Observability Platform with agentic orchestration and GitHub Copilot integration


Research Methodology Framework and Report Scope
Market Definitions and Key Coverage
Our study defines the global observability market as all commercial software and paid services that ingest, correlate, and visualize metrics, logs, traces, events, and related telemetry to provide near-real-time insight into the health of applications, infrastructure, and data pipelines across cloud, on-premises, and hybrid estates.
Scope Exclusions: Open-source frameworks used without paid support, hardware traffic taps sold as stand-alone appliances, and bespoke in-house monitoring scripts are not counted.
Segmentation Overview
- By Component
- Solutions
- Services
- By Deployment Mode
- Cloud / SaaS
- On-Premises
- Hybrid
- By Enterprise Size
- Small and Medium Enterprises
- Large Enterprises
- By End-user Vertical
- IT and Telecom
- BFSI
- Retail and E-commerce
- Manufacturing
- Healthcare and Life Sciences
- Government and Defense
- Other End-user Verticals
- By Application
- DevOps and APM
- Infrastructure Monitoring
- Security and Compliance
- Data Observability
- Business Analytics
- By Region
- North America
- United States
- Canada
- Mexico
- South America
- Brazil
- Argentina
- Rest of South America
- Europe
- Germany
- United Kingdom
- France
- Spain
- Italy
- Rest of Europe
- Asia-Pacific
- China
- Japan
- India
- Australia
- South Korea
- Rest of Asia-Pacific
- Middle East
- Israel
- Saudi Arabia
- United Arab Emirates
- Turkey
- Rest of Middle East
- Africa
- South Africa
- Egypt
- Nigeria
- Rest of Africa
- North America
Detailed Research Methodology and Data Validation
Primary Research
Mordor analysts interviewed site-reliability engineers, cloud architects, and procurement leads across North America, Europe, and Asia Pacific. These discussions fine-tuned average spend per container cluster, clarified service attach rates, and verified adoption barriers highlighted by secondary evidence.
Desk Research
Our team began with respected public sources such as the US Bureau of Labor Statistics IT spending tables, Eurostat cloud-adoption surveys, Cloud Native Computing Foundation usage reports, and USPTO telemetry-focused patent filings. Company 10-Ks, investor decks, and earnings calls supplied segment revenue clues, while paid databases like D&B Hoovers and Dow Jones Factiva enriched company financials and deal flow. The sources listed here are illustrative; numerous other datasets informed our desk work.
Market-Sizing & Forecasting
A top-down build drew on global IT-operations software expenditure and active cloud-workload counts to estimate the 2025 revenue pool, which was then corroborated with selective bottom-up checks of vendor revenues and sampled average selling price multiplied by deployment volumes. Five key variables, like cloud-native workload numbers, telemetry growth per workload, DevOps penetration, average observability spend per VM or container, and regional cloud-budget growth, feed a multivariate regression that supports the 2025-2030 forecast. Data gaps where vendor splits were opaque were bridged with interview-derived ratios and industry medians.
Data Validation & Update Cycle
Outputs pass automated anomaly screens, peer-analyst reviews, and senior sign-off. Models refresh annually, with interim updates triggered by material events such as major acquisitions or pricing resets. A final check occurs immediately before report release so clients receive the latest view.
Why Mordor's Observability Market Baseline Commands Reliability
Published estimates often diverge because providers slice the market differently, rely on distinct input datasets, and refresh at unequal intervals. By anchoring scope on both software and paid services and blending macro spend pools with vendor-level evidence, our baseline remains transparent and reproducible.
Key gap drivers include narrow 'tool-only' definitions used elsewhere, omission of services revenue, differing currency conversion dates, and shorter historical back-casts that distort CAGR trajectories. This is where Mordor Intelligence differentiates, as our yearly refresh and direct ASP checks temper aggressive as well as overly cautious outlooks.
Benchmark comparison
| Market Size | Anonymized source | Primary gap driver |
|---|---|---|
| USD 2.9 B (2025) | Mordor Intelligence | - |
| USD 2.4 B (2023) | Global Consultancy A | Services revenue excluded; limited vendor panel |
| USD 2.94 B (2024) | Research Publisher B | Fixed 2020 FX rates; no primary interviews |
| USD 3.2 B (2024) | Industry Analyst C | Hardware probes included alongside software |
These contrasts show that our openly documented variables, primary confirmations, and disciplined refresh cadence provide decision-makers with a balanced, dependable starting point for sizing the observability opportunity.


Key Questions Answered in the Report
What is the current size of the observability market and how fast is it growing?
The observability market reached USD 3.35 billion in 2026 and is forecast to expand at a 15.62% CAGR to USD 6.93 billion by 2031.
Which region is expected to grow fastest in the next five years?
Asia-Pacific is projected to post a 19.62% CAGR through 2031 thanks to cloud-first adoption and high outage costs that justify proactive observability investment .
Why are hybrid deployments gaining traction?
Hybrid models bridge data-sovereignty gaps by letting firms store sensitive logs on-prem while benefiting from cloud analytics, leading to a 20.12% CAGR in this segment.
How is AI changing observability requirements?
Generative-AI workloads demand monitoring of token usage, model drift, and bias, spurring vendors like Datadog to launch dedicated LLM observability modules.
What cost challenges do enterprises face with observability?
Telemetry storage can surpass primary infrastructure costs; firms deploy sampling and pipeline filtering to mitigate expenses, sometimes saving over 90% on log spend.
Which vertical is growing fastest and why?
Healthcare and Life Sciences is rising at a 21.86% CAGR as hospitals and biotech firms monitor AI-driven diagnostics and comply with strict patient-safety regulations.
Page last updated on:


