Managed Network Services Market Size and Share
Market Overview
| Study Period | 2020 - 2031 |
|---|---|
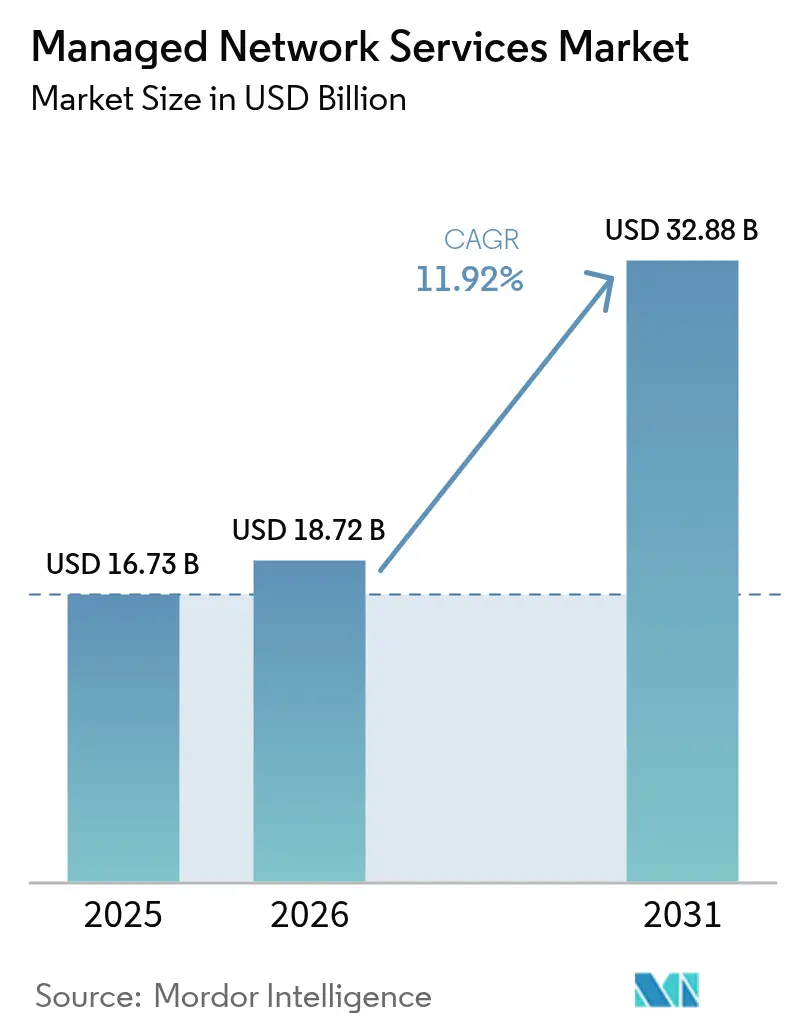
| Market Size (2026) | USD 18.72 Billion |
| Market Size (2031) | USD 32.88 Billion |
| Growth Rate (2026 - 2031) | 11.92% CAGR |
| Fastest Growing Market | Asia Pacific |
| Largest Market | North America |
| Market Concentration | Medium |
Major Players *Disclaimer: Major Players sorted in no particular order Image © Mordor Intelligence. Reuse requires attribution under CC BY 4.0. | |
Managed Network Services Market Analysis by Mordor Intelligence
The Network managed services market size is expected to grow from USD 16.73 billion in 2025 to USD 18.72 billion in 2026 and is forecast to reach USD 32.88 billion by 2031 at 11.92% CAGR over 2026-2031. This rapid growth stems from enterprises’ need to outsource increasingly complex network operations, turning managed services into mission-critical infrastructure that underpins corporate digital transformation strategies. Enterprises report double-digit cost reductions, faster time-to-market for new applications, and improved resiliency when moving to proactive, AI-enabled managed service models. The global shortage of qualified network engineers further accelerates demand; 95% of technology leaders cite hiring challenges while talent costs escalate, especially for emerging SD-WAN, SASE, and private 5G skill sets. [1]Robert Half, “New Research Reveals Severity of the Technology Skills Gap,” roberthalf.comConsolidation among vendors reshapes the competitive field, Hewlett Packard Enterprise’s USD 14 billion purchase of Juniper Networks exemplifies the trend toward end-to-end, software-defined, subscription-based portfolios. Finally, the Asia-Pacific investment boom in data centers and fiber backbones positions that region as the volume growth engine, even as North America remains the largest revenue contributor.
Key Report Takeaways
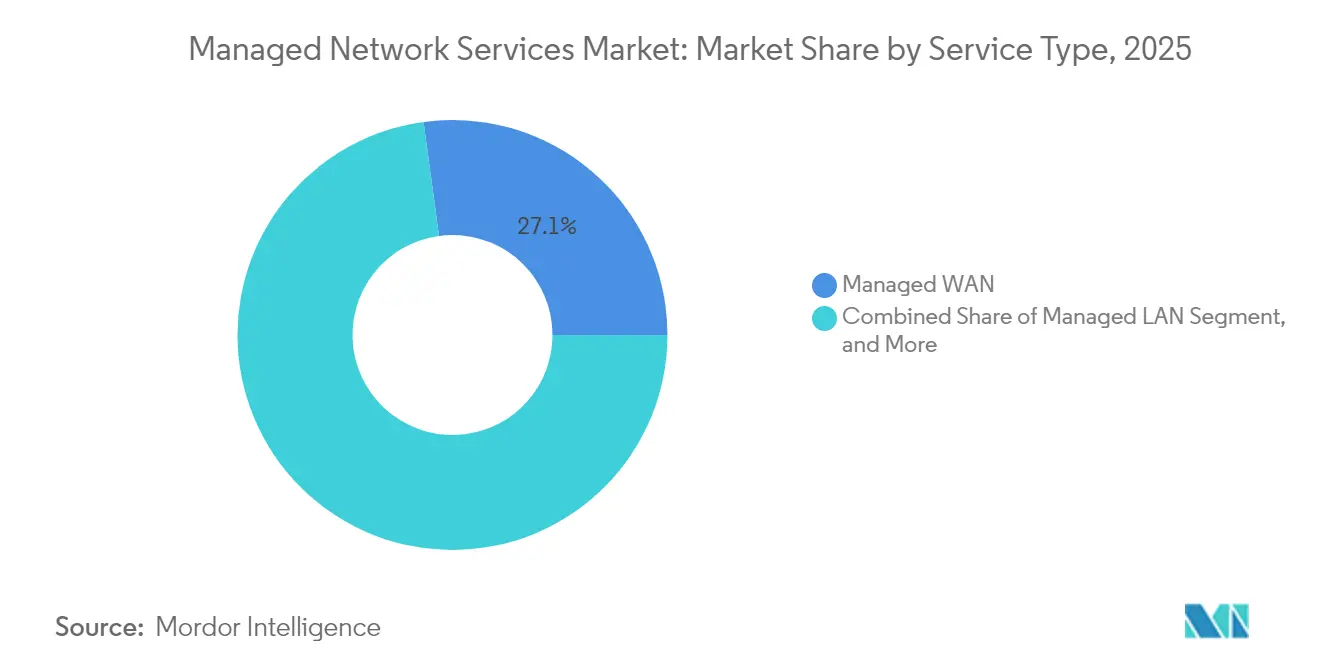
- By service type, managed WAN captured 27.15% of the Network managed services market share in 2025; Managed SD-WAN is projected to advance at a 18.4% CAGR through 2031.
- By deployment mode, on-premise solutions commanded 59.80% of the Network managed services market size in 2025, whereas cloud/NaaS models are set to grow at an 17.6% CAGR to 2031.
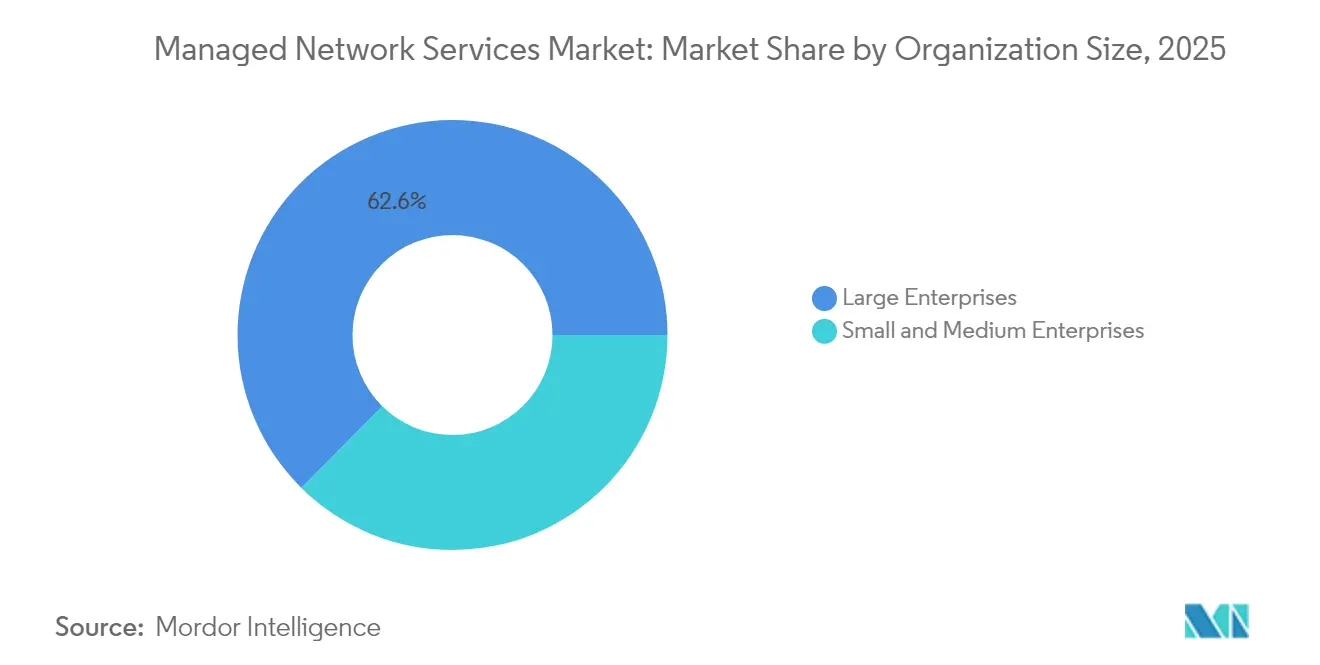
- By organization size, large enterprises held 62.60% of the Network managed services market share in 2025, while the SME segment is expected to expand at a 13.2% CAGR through 2031.
- By end-user vertical, BFSI accounted for a 21.55% share of the Network managed services market size in 2025, and healthcare is projected to grow at a 15.1% CAGR between 2026 and 2031.
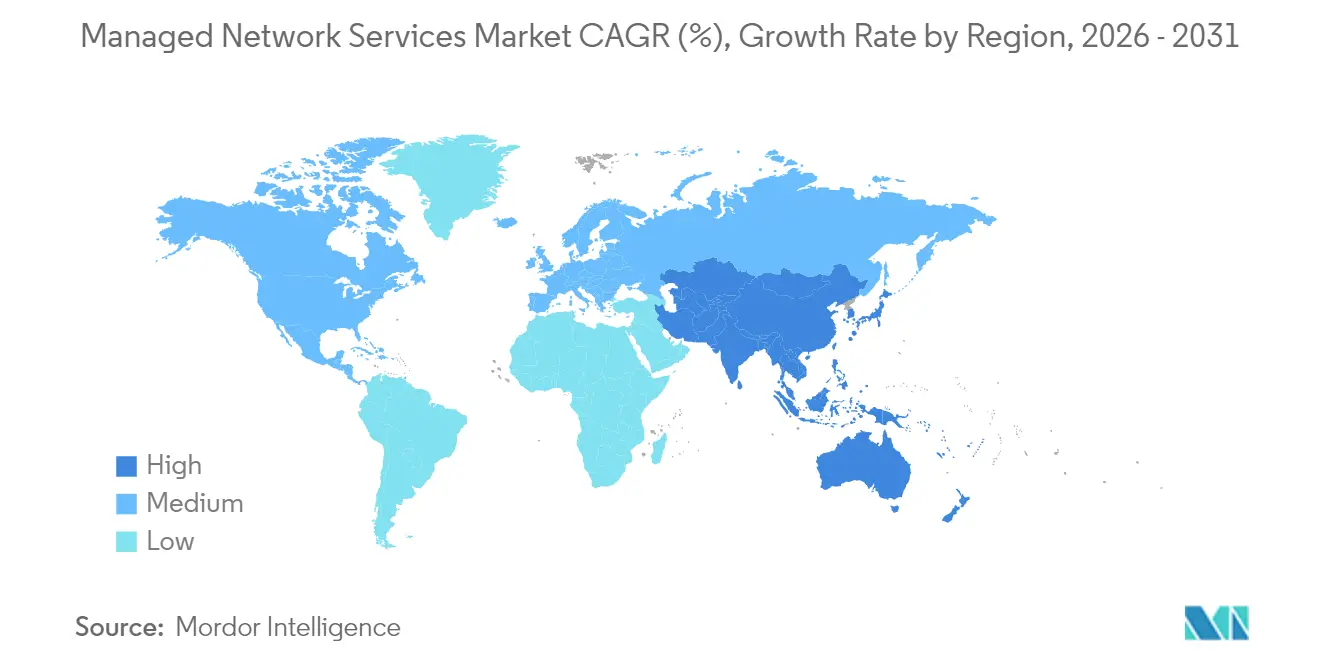
- By geography, North America accounted for 40.20% of the Network managed services market share in 2025, with the Asia-Pacific region registering the fastest growth at a 13.9% CAGR from 2026 to 2031.
Note: Market size and forecast figures in this report are generated using Mordor Intelligence’s proprietary estimation framework, updated with the latest available data and insights as of 2026.
Global Managed Network Services Market Trends and Insights
Drivers Impact Analysis*
| Driver | (~) % Impact on CAGR Forecast | Geographic Relevance | Impact Timeline |
|---|---|---|---|
| Cost-saving outsourcing imperative | +1.8% | North America, Europe, global spill-over | Short term (≤ 2 years) |
| Scarcity of in-house network talent | +1.5% | North America, Western Europe | Medium term (2-4 years) |
| Surge in cloud/SaaS traffic volumes | +1.4% | Global with Asia-Pacific acceleration | Medium term (2-4 years) |
| AI-driven auto-remediation lowers SLAs | +1.2% | North America, EU core, Asia-Pacific rollout | Long term (≥ 4 years) |
| Private 5G campus rollouts | +0.8% | Manufacturing hubs worldwide | Long term (≥ 4 years) |
| EU Digital Operational Resilience Act (DORA) | +0.6% | European Union, aligned jurisdictions | Short term (≤ 2 years) |
| Source: Mordor Intelligence | |||


Cost-saving outsourcing imperative
Organizations replacing capex-intensive network ownership with opex-based managed services record 24% lower infrastructure spend and 42% higher staff productivity. [2]IBM, “The Business Value of Managed Services,” ibm.com Roughly half of adopters save at least 25% annually on IT budgets, prompting 62% of users to expand contract scope over the next 24 months. The predictable subscription model frees funds for innovation and aligns service quality to clear SLAs, making the Network managed services market a primary lever for CFO-led efficiency drives. Cloud-first SMEs amplify this trend; more than 50% already deploy AI-enabled automation that was previously unaffordable on-premise.
Scarcity of in-house network talent
The projected 75% U.S. IT labor deficit by 2034 intensifies competition for certified engineers. Enterprises struggle to maintain skills spanning SD-WAN, SASE, and zero-trust, pushing them toward providers that pool expertise across hundreds of clients. Managed service vendors invest heavily in certification programs and centralized Network Operations Centers (NOCs) to meet 24/7 coverage demands. Access to these shared resources shortens innovation cycles and reduces downtime, further enlarging the Network managed services market.
Surge in cloud and SaaS traffic volumes
AI workloads and multi-cloud architectures create unpredictable bandwidth spikes that legacy MPLS cannot accommodate. Lumen reported USD 5 billion in new AI connectivity contracts, doubling intercity backbone capacity plans. [3]Lumen Technologies, “AI Demand Drives USD 5 Billion in New Business,” lumen.com Managed service specialists leverage analytics to optimize traffic across public clouds, edge nodes, and private links, ensuring application performance without overspending on redundant circuits. As enterprise workloads migrate, managed services that dynamically scale connectivity capture a growing share of network budgets.
AI-driven auto-remediation lowers SLAs
AIOps platforms correlate millions of telemetry points to prevent incidents and slash mean-time-to-repair. Cisco’s deployments achieve sizable alert-noise reduction and downtime avoidance, underpinning SLA guarantees once deemed impossible. [4]Cisco, “Putting AI into AIOps,” cisco.com Machine learning combined with large language models delivers human-readable root-cause analyses, democratizing troubleshooting and allowing service providers to commit to “five nines” availability while trimming operational headcount.
Restraints Impact Analysis*
| Restraint | (~) % Impact on CAGR Forecast | Geographic Relevance | Impact Timeline |
|---|---|---|---|
| Reluctance to outsource mission-critical nodes | −0.9% | Global, acute in regulated sectors | Medium term (2-4 years) |
| Vendor lock-in and opaque pricing models | −0.7% | EU, North America, global | Short term (≤ 2 years) |
| Energy-intensive AIOps Scope-3 emissions | −0.5% | EU, North America | Long term (≥ 4 years) |
| Edge-sovereignty mandates | −0.4% | Asia-Pacific, EU | Medium term (2-4 years) |
| Source: Mordor Intelligence | |||
Reluctance to outsource mission-critical nodes
Financial institutions and hospitals fear third-party risk, seeing network outages as existential threats. Compliance frameworks stipulate stringent data-handling rules, leading some boards to retain in-house control over core routers. Providers counter by adopting zero-trust designs, sovereign-cloud options, and transparent incident-response playbooks, yet hesitation still trims percentage points from overall Network managed services market growth.
Vendor lock-in and opaque pricing models
Variable per-device or per-user fees ranging from USD 99 to USD 275 monthly complicate cost forecasting. Proprietary toolchains also limit portability, raising exit barriers. Regulators are now pushing for greater interoperability, and customers are increasingly demanding consumption-based, cancel-any-time contracts. Providers responding with API-rich, platform-agnostic offerings stand to regain lost momentum in the Network managed services market.
*Our forecasts treat driver/restraint impacts as directional, not additive. The impact forecasts reflect baseline growth, mix effects, and variable interactions.
Segment Analysis
By Service Type: Software-defined momentum outpaces legacy WAN
Managed WAN remains the anchor at a 27.15% Network managed services market share in 2025, equating to a Network managed services market size of about USD 4.54 billion. Yet Managed SD-WAN’s 18.4% CAGR through 2031 is re-allocating budgets toward software-based overlay networks that lower costs by 30-50% compared with MPLS. Providers integrate SASE features, boosting customer stickiness through unified security and connectivity. In parallel, Managed LAN and Wi-Fi refresh cycles adopt AI-driven configuration engines that cut manual effort in half. Over the forecast window, traditional WAN revenues flatten while SD-WAN and SASE jointly exceed 40% of segment revenues, reinforcing the long-term pivot toward programmable architectures within the broader Network managed services market.
The shift also elevates managed network security demand; zero-trust mandates embed security into every service bundle, widening average contract value. Vendors such as Nile bundle secure Wi-Fi with deterministic SLAs, winning 300% revenue growth in 2024. Private 5G managed services will contribute incremental revenue late in the period as manufacturers modernize campus connectivity. Together, these trends re-draw the competitive map, favoring providers with cloud-native orchestration and multi-access edge capabilities.


By Deployment Mode: Hybrid consumption rises
On-premise installations commanded 59.80% of the Network managed services market size in 2025, but their share erodes as cloud and NaaS models expand at an 17.6% CAGR. Consumption-based pricing aligns network spending with actual usage, resonating with CFOs who seek agility. Verizon’s NaaS subscriptions eliminate capex while delivering SLA-backed performance, prompting rapid uptake among mid-market clients.
Latency-sensitive workloads remain on-site while orchestration shifts to the cloud. Edge computing reinforces this pattern, requiring localized processing with centralized policy control. Sovereign-cloud variants address GDPR and similar mandates, removing a historical barrier to off-premise network management in Europe. Consequently, cloud-hosted control planes will oversee over 70% of enterprise ports by 2030, even as physical data paths remain diversified across branch, campus, and edge locations.
By Organization Size: SMEs close the capability gap
Large enterprises generated 62.60% of 2025 revenues, but SMEs added the most incremental users, growing at a 13.2% CAGR and moving the Network managed services market toward democratized access to premium tooling. The average SME now runs three cloud applications, driving complexity that outstrips in-house resources. More than 60% plan to deploy generative AI within 12 months, yet only 22% retain dedicated networking staff. Managed service bundles, priced at USD 150-400 per user per month, offer enterprise-grade SLAs, security, and compliance without upfront hardware or staffing costs.
Providers craft simplified onboarding, automated ticketing, and tiered support to meet the expectations of SMEs. At the same time, large multinationals renew multi-year master service agreements to secure global coverage and unified policy enforcement, creating a dual-track market where both scalability and customer intimacy are important.
By End-User Vertical: Healthcare outpaces BFSI
BFSI institutions held 21.55% of the 2025 segment revenue because of always-on trading platforms and stringent regulatory audits under rules such as DORA. Their contracts favor redundant architectures, active-active data centers, and 15-minute recovery objectives, sustaining premium pricing. Conversely, healthcare’s 15.1% CAGR through 2031 positions it as the fastest riser, driven by telehealth, connected diagnostics, and AI-assisted care pathways that demand secure, high-capacity networks. McKinsey estimates digital health could unlock up to USD 360 billion in cost efficiencies, nudging hospital boards toward outsourced network operations.
Retail, manufacturing, and energy verticals follow suit, each embracing private 5G or edge analytics to streamline operations. Managed service providers develop vertical playbooks for pre-certified medical devices, PCI-compliant retail bundles, or IEC-62443 industrial security stacks to shorten sales cycles and ensure regulatory alignment.
Geography Analysis
North America contributed 40.20% of 2025 revenue owing to entrenched cloud adoption, aggressive AI pilots, and a vibrant MSP ecosystem headquartered across the United States. Mature enterprises budget for proactive refresh schedules and multi-cloud optimization, funneling steady work to managed service providers. Federal sector initiatives around zero-trust also expand addressable spending. Yet growth tapers to mid-single digits as penetration reaches saturation in large accounts. Europe posts moderate expansion, buoyed by DORA-driven outsourcing among financial entities and rising sustainability mandates that favor energy-optimized managed services. Country-level data-sovereignty laws elevate demand for sovereign-cloud variants, particularly in Germany and France, adding complexity that vendors monetize through regionalized service hubs. Meanwhile, the Middle East and Africa enter an acceleration phase; national 2030 agendas and green-field smart-city projects call for turnkey network management, albeit from a lower base.
Asia-Pacific, however, provides the standout trajectory, growing at 13.9% CAGR and accounting for an ever-larger slice of the global Network managed services market size. Hyperscale cloud players announce multi-billion-dollar data-center parks in Malaysia, Indonesia, and India, catalyzing fiber builds and managed connectivity contracts. Enterprises leapfrog legacy MPLS, deploying SD-WAN and wireless WAN from day one. Local telecom incumbents partner with global MSPs to offer unified NaaS portals, blending domestic reach with global SLA coverage. Consequently, Asia-Pacific overtakes Europe in annual new-logo count by 2027 and narrows the revenue gap by 2030.

Competitive Landscape
The competitive field sits at a moderate concentration level top five providers commanding about 45% of 2024 spend, earning a market concentration score of 6. HPE’s acquisition of Juniper exemplifies hardware-software-services convergence, enabling full-stack AI-native offerings that directly confront Cisco in both enterprise and service-provider accounts. Cisco defends its share through continuous AIOps rollouts and private 5G bundles, while also deepening MSP partnership programs for mid-market reach.
Challengers such as Nile leverage cloud-born architectures to guarantee performance “as-a-service,” targeting green-field deployments and renovation cycles alike. Kyndryl aligns with Cloudflare to pair consulting depth with globally distributed connectivity clouds, creating an enterprise on-ramp free of legacy appliance baggage. Verizon, Lumen, and AT&T are pivoting to NaaS constructs to offset legacy wireline losses, integrating SD-WAN orchestration, security, and edge computing in a single SKU.
Strategic moves continue thick and fast. Comcast Business bought Nitel to scale enterprise SD-WAN; BMC acquired Netreo to embed full-stack observability into its Helix platform. Private-equity roll-ups such as Shield Technology Partners consolidate regional MSPs, building national footprints with centralized tooling. Providers able to combine AI-assisted operations with transparent consumption pricing gain competitive headroom in an environment where vendor lock-in skepticism runs high.
Managed Network Services Industry Leaders
IBM
HCL Technologies Limited
Dell
Verizon
Accenture PLC
- *Disclaimer: Major Players sorted in no particular order


Recent Industry Developments
- July 2025: Hewlett Packard Enterprise closed its USD 14 billion Juniper Networks acquisition, forming a unified AI-native networking and managed services portfolio.
- June 2025: Shield Technology Partners raised USD 100 million to build a national MSP platform via initial partnerships with ClearFuze Networks, IronOrbit, Delval Technology Solutions, and OneNet Global.
- June 2025: NWN Corporation acquired InterVision Systems, expanding AI-powered managed services across enterprise and public-sector clients.
- April 2025: Comcast Business completed its purchase of Nitel, adding 6,600 enterprise customers and bolstering Network-as-a-Service offerings.


Global Managed Network Services Market Report Scope
Managed network services (MNS) are a class of managed services that facilitate businesses to outsource the management of their customer premise equipment (CPE) and networks, such as switches, routers, access points, and firewalls. In most cases, managed service providers (MSP) promote multi-vendor environments, giving customers the flexibility to choose their favored vendors for network devices.
The managed network services market is segmented by Type (Managed LAN, Managed WAN, Managed Wi-Fi, Managed Network Security), Organization Size (Small & Medium Enterprises (SMEs), Large Enterprises), End Users (BFSI, IT & Telecom, Healthcare & Pharmaceutical, Manufacturing, Retail, Education), and Geography (North America, Europe, Asia-Pacific, Middle East and Africa, Latin America). The market sizes and forecasts are provided in terms of value (USD) for all the above segments.
| Managed LAN |
| Managed WAN |
| Managed Wi-Fi |
| Managed Network Security |
| Managed SD-WAN |
| On-premise |
| Cloud / NaaS |
| Small and Medium Enterprises |
| Large Enterprises |
| BFSI |
| IT and Telecom |
| Healthcare and Life-Science |
| Retail and eCommerce |
| Manufacturing |
| Education |
| Energy and Utilities |
| North America | United States | |
| Canada | ||
| Mexico | ||
| South America | Brazil | |
| Argentina | ||
| Rest of South America | ||
| Europe | United Kingdom | |
| Germany | ||
| France | ||
| Italy | ||
| Rest of Europe | ||
| Asia-Pacific | China | |
| Japan | ||
| India | ||
| South Korea | ||
| Rest of Asia-Pacific | ||
| Middle East and Africa | Middle East | Israel |
| Saudi Arabia | ||
| United Arab Emirates | ||
| Turkey | ||
| Rest of Middle East | ||
| Africa | South Africa | |
| Egypt | ||
| Rest of Africa | ||
| By Service Type | Managed LAN | ||
| Managed WAN | |||
| Managed Wi-Fi | |||
| Managed Network Security | |||
| Managed SD-WAN | |||
| By Deployment Mode | On-premise | ||
| Cloud / NaaS | |||
| By Organization Size | Small and Medium Enterprises | ||
| Large Enterprises | |||
| By End-user Vertical | BFSI | ||
| IT and Telecom | |||
| Healthcare and Life-Science | |||
| Retail and eCommerce | |||
| Manufacturing | |||
| Education | |||
| Energy and Utilities | |||
| By Geography | North America | United States | |
| Canada | |||
| Mexico | |||
| South America | Brazil | ||
| Argentina | |||
| Rest of South America | |||
| Europe | United Kingdom | ||
| Germany | |||
| France | |||
| Italy | |||
| Rest of Europe | |||
| Asia-Pacific | China | ||
| Japan | |||
| India | |||
| South Korea | |||
| Rest of Asia-Pacific | |||
| Middle East and Africa | Middle East | Israel | |
| Saudi Arabia | |||
| United Arab Emirates | |||
| Turkey | |||
| Rest of Middle East | |||
| Africa | South Africa | ||
| Egypt | |||
| Rest of Africa | |||


Key Questions Answered in the Report
How big will the Network managed services market be by 2031?
It is projected to reach USD 32.88 billion, expanding at a 11.92% CAGR between 2026-2031.
Which service type is growing fastest?
Managed SD-WAN services are forecast to grow at 18.4% CAGR as organizations shift from MPLS to software-defined connectivity.
Why are SMEs adopting managed network services so quickly?
Cloud-first strategies and limited in-house talent push SMEs toward subscription bundles that deliver enterprise-grade security and automation at predictable costs.
What role does AI play in managed network operations?
AIOps platforms automate incident detection and remediation, enabling providers to guarantee higher SLAs while reducing operational overhead.
Page last updated on:


