OpenStack Services Market Size and Share
Market Overview
| Study Period | 2020 - 2031 |
|---|---|
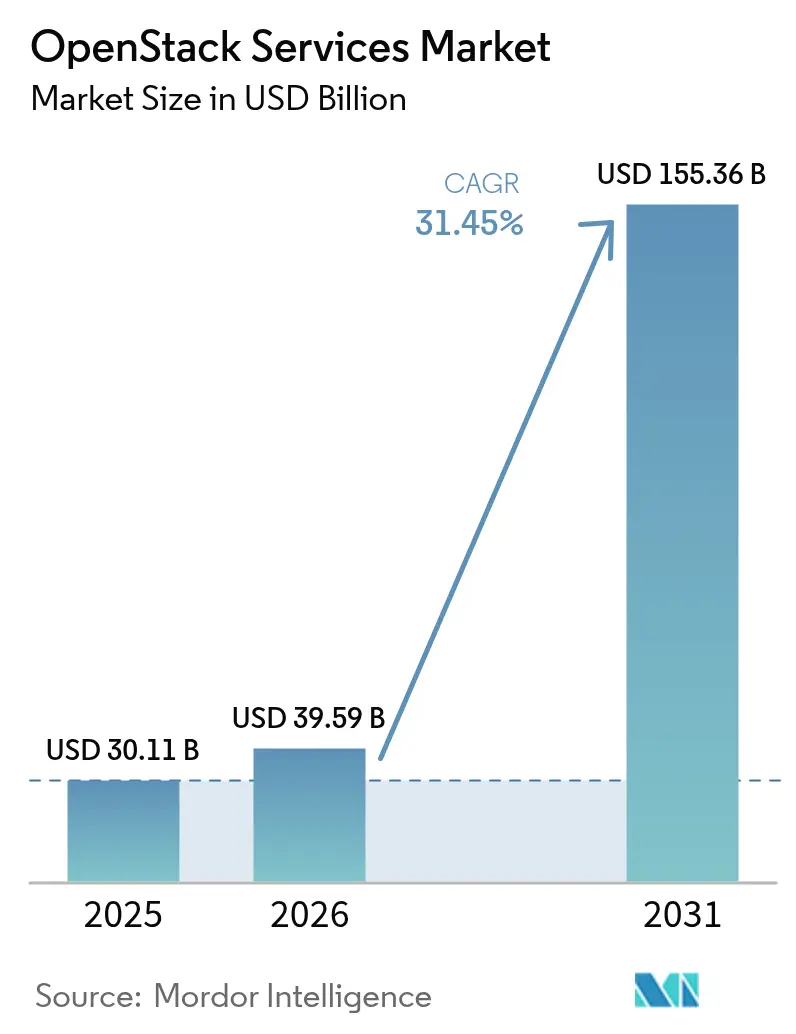
| Market Size (2026) | USD 39.59 Billion |
| Market Size (2031) | USD 155.36 Billion |
| Growth Rate (2026 - 2031) | 31.45% CAGR |
| Fastest Growing Market | Asia Pacific |
| Largest Market | North America |
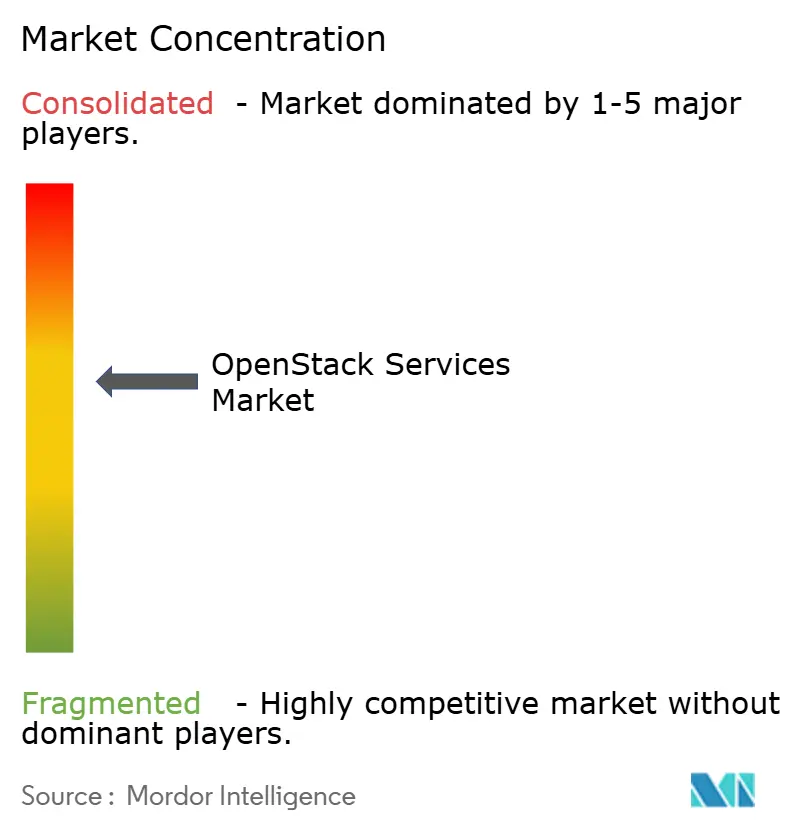
| Market Concentration | Medium |
Major Players *Disclaimer: Major Players sorted in no particular order Image © Mordor Intelligence. Reuse requires attribution under CC BY 4.0. | |
OpenStack Services Market Analysis by Mordor Intelligence
The OpenStack Services market size is expected to grow from USD 30.11 billion in 2025 to USD 39.59 billion in 2026 and is forecast to reach USD 155.36 billion by 2031 at 31.45% CAGR over 2026-2031. The growth reflects accelerated enterprise migrations from proprietary clouds, strong telecommunications demand, and rising preference for hybrid architectures. Telecom operators continue to scale Network Function Virtualization on OpenStack, large enterprises shift workloads away from VMware after Broadcom’s licensing changes, and managed service providers lower barriers for small and medium enterprises. Regulatory pushes for data sovereignty in Europe and Asia-Pacific also increase private-cloud spending on OpenStack. Competitive differentiation centers on turnkey managed offerings, automation, and vertical specialization, while ecosystem partnerships broaden platform integrations across AI and edge-computing use cases.
Key Report Takeaways
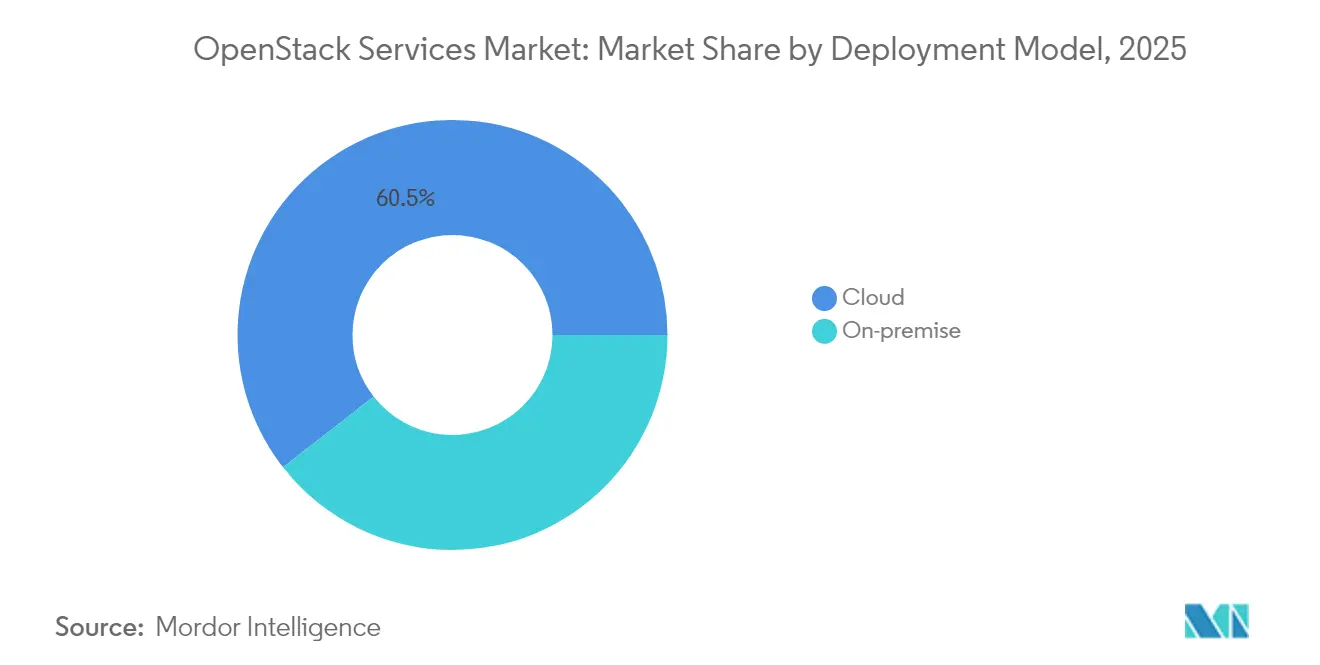
- By deployment model, Cloud implementations represented 60.55% share of the OpenStack Services market size in 2025 and are progressing at a 33.05% CAGR to 2031.
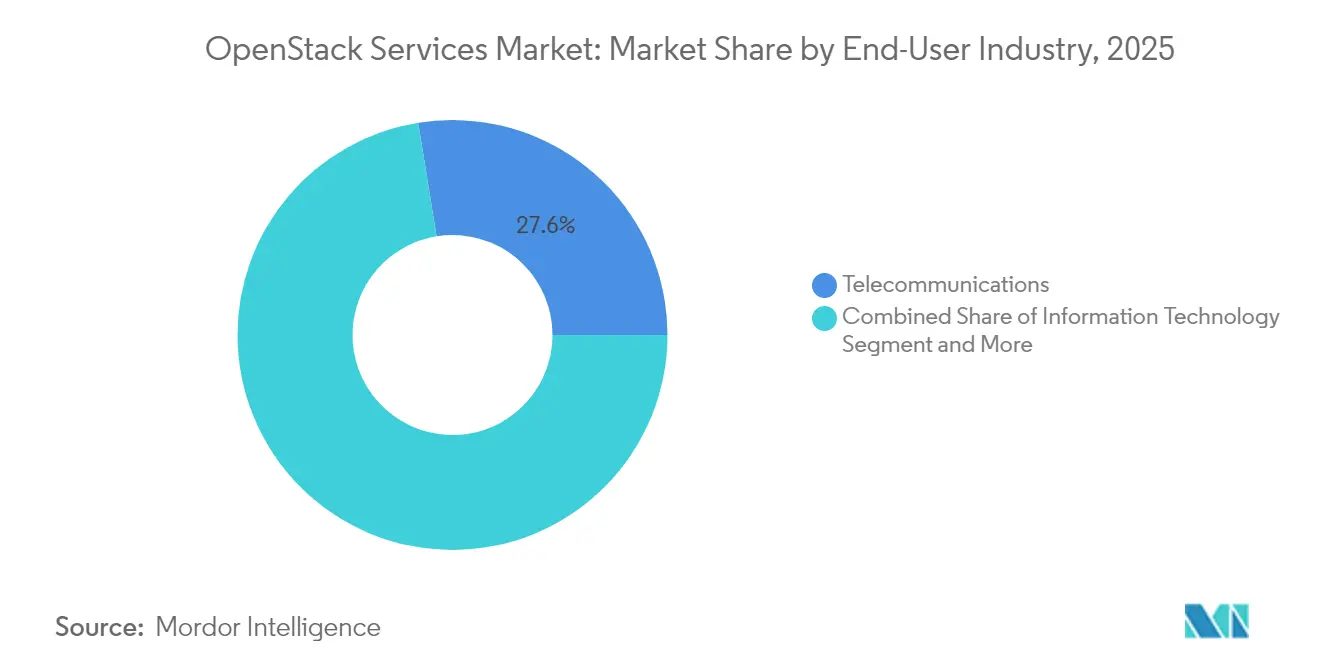
- By end-user industry, telecommunications captured 27.55% of the OpenStack Services market share in 2025 and is advancing at a 32.55% CAGR through 2031.
- By service type, the managed services segment accounted for 42.85% of the OpenStack Services market size in 2025 and is projected to grow at a 33.6% CAGR between 2026-2031.
- By organization size, small and medium enterprises are forecast to expand at a 31.95% CAGR, closing the gap with large-enterprise adoption.
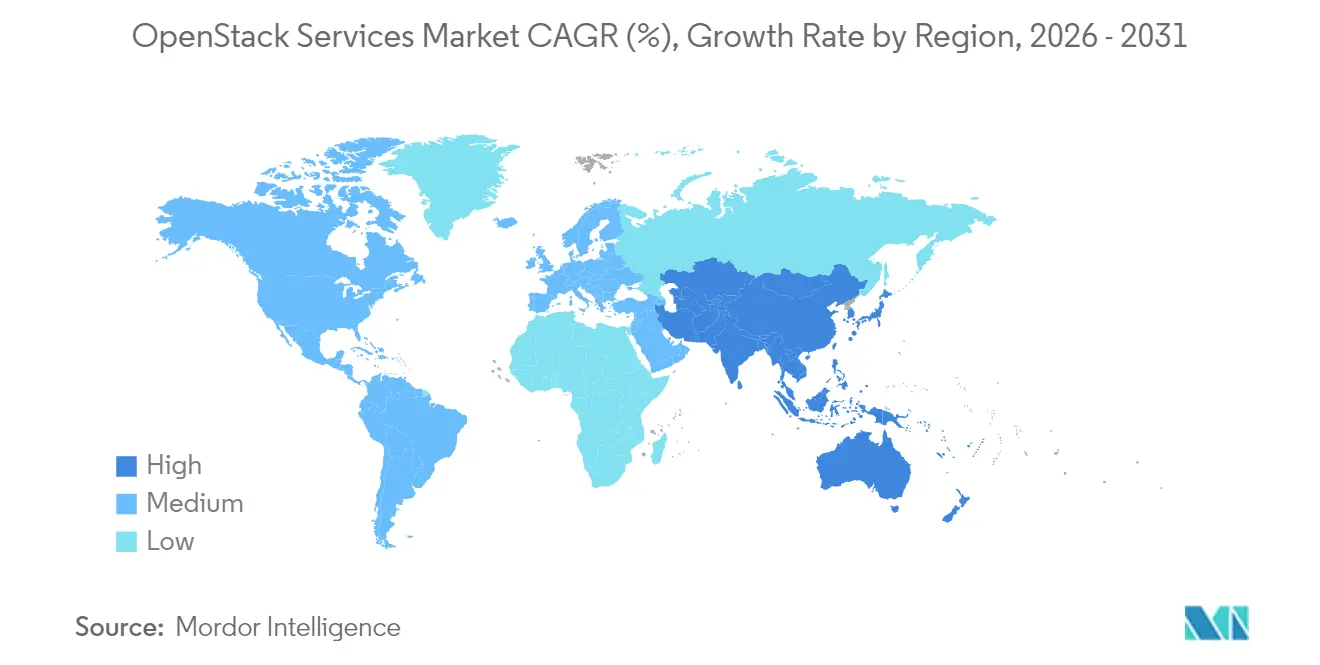
- By geography, North America led with 34.10% revenue in 2025, while Asia-Pacific is expected to post the fastest regional CAGR at 32.4% through 2031.
Note: Market size and forecast figures in this report are generated using Mordor Intelligence’s proprietary estimation framework, updated with the latest available data and insights as of 2026.
Global OpenStack Services Market Trends and Insights
Drivers Impact Analysis*
| Driver | (~) % Impact on CAGR Forecast | Geographic Relevance | Impact Timeline |
|---|---|---|---|
| Faster business agility and IT efficiency | +8.2% | Global | Medium term (2-4 years) |
| Lower TCO versus proprietary cloud stacks | +7.8% | Global | Short term (≤ 2 years) |
| Surging NFV adoption in telecommunications | +6.5% | Global, strongest in Asia-Pacific and North America | Medium term (2-4 years) |
| Post-Broadcom VMware licensing uncertainty | +5.1% | North America and Europe | Short term (≤ 2 years) |
| EU data-sovereignty mandates | +2.8% | Europe | Long term (≥ 4 years) |
| AI-ready OpenInfra projects | +1.7% | Global | Long term (≥ 4 years) |
| Source: Mordor Intelligence | |||
Need for faster business agility and IT efficiency
Enterprises pursuing digital transformation replace static virtualization stacks with cloud-native platforms that shorten deployment cycles. OpenStack’s API-driven control plane allows self-service provisioning, which helped Sicredi quadruple parallel job capacity after adopting Canonical OpenStack.[1]Canonical Ltd., “OpenStack: Your open source VMware alternative,” canonical.com Infrastructure-as-code workflows cut provisioning times to minutes, letting development teams iterate quickly while meeting corporate security policies. Pairing OpenStack with Kubernetes unifies legacy and microservices workloads under consistent governance, making speed a board-level metric rather than a back-office aspiration. Competitive industries measure value in days saved, converting agility into direct revenue capture. As enterprises encounter refresh cycles for aging virtualization estates, agility gains reinforce OpenStack as a strategic, not tactical, platform choice.
Lower TCO versus proprietary cloud stacks
Canonical benchmarks indicate up to 40% lower total cost of ownership against VMware vSphere Enterprise Plus, driven by license elimination and commodity hardware freedom. Rackspace customers save USD 258,000 per 20 servers annually using managed OpenStack compared with self-managed estates.[2]Rackspace Technology, “OpenStack Private Cloud | Increase Cloud Agility and Lower Costs,” rackspace.com Savings extend across operations, where automation reduces administration-to-server ratios, and across scale, where incremental nodes avoid escalating license tiers. Predictable economics grow even more compelling when IT budgets scrutinize vendor lock-in costs, prompting finance teams to frame open-source adoption as a multiyear capital-efficiency initiative.
Surging NFV adoption in telecommunications
Eighty-four percent of telecom operators rely on OpenStack for Network Function Virtualization, valuing carrier-grade availability, open APIs, and edge-ready architecture.[3]OpenStack Foundation, “Advancing Telecom Use Cases with OpenStack,” openstack.org Verizon’s deployment spans multiple data centers and remains one of the world’s largest production NFV clouds. The arrival of 5G and densified edge nodes demands flexible orchestration that proprietary stacks struggle to match. Operators extend OpenStack to remote sites with StarlingX, aligning distributed packet core, MEC, and RAN workloads under uniform lifecycle management. Investment cycles through 2030 position telecommunications as both the largest and the fastest-growing vertical in the OpenStack Services market.
Post-Broadcom VMware licensing uncertainty accelerates migrations
Following Broadcom’s VMware acquisition, 48% of users report license cost doubling, triggering migration evaluations toward open platforms. OpenInfra Foundation members note an influx of inquiries, with enterprises such as Geico confirming large-scale production moves to OpenStack. CFOs prioritize budget predictability and CIOs reduce single-vendor risk, combining to propel an exodus that compresses traditional refresh timelines into rapid transition projects. North American and European organizations lead the shift due to higher VMware penetration, but policy and cost pressure signal a broader global wave during the forecast horizon.
Restraints Impact Analysis*
| Restraint | (~) % Impact on CAGR Forecast | Geographic Relevance | Impact Timeline |
|---|---|---|---|
| Enterprise-grade robustness and security gaps | -4.2% | Global | Medium term (2-4 years) |
| Shortage of certified OpenStack talent | -3.8% | Global, acute in emerging markets | Short term (≤ 2 years) |
| Fragmentation across diverging sub-projects | -2.1% | Global | Long term (≥ 4 years) |
| Shift to managed-K8s and serverless | -1.9% | North America and Europe | Long term (≥ 4 years) |
| Source: Mordor Intelligence | |||
Enterprise-grade robustness and security gaps
Large organizations demand five-nines availability, and OpenStack’s distributed services raise configuration and monitoring complexity. Misaligned identity policies or network isolation errors can undermine regulatory compliance, prompting risk-averse sectors to stall deployments. Firms lacking integrated observability often revert to proprietary suites where support contracts cover the entire stack. This perception gap moderates adoption velocity, even though the open-source community continues to harden defaults and publish security advisories.
Shortage of certified OpenStack talent
Rapid demand meets limited supply: enterprises search for architects versed in Nova, Neutron, and Cinder but find few candidates, especially outside mature North American and European labor pools. Canonical’s instructor-led fundamentals program costs USD 23,500 for 15 attendees, a price point that proves steep for mid-market adopters. Dependence on a narrow talent pipeline inflates payroll costs, extends project timelines, and fuels the move toward fully managed services. Until certification throughput accelerates and emerging-market universities refresh curricula, skills scarcity will cap the OpenStack Services market growth potential.
*Our forecasts treat driver/restraint impacts as directional, not additive. The impact forecasts reflect baseline growth, mix effects, and variable interactions.
Segment Analysis
By Deployment Model: On-Cloud Dominance Accelerates
On-cloud implementations held 60.55% revenue in 2025, and the segment is expected to post a 33.05% CAGR through 2031. The OpenStack Services market size for on-cloud deployments benefits from enterprises blending on-premise control with public-cloud scale under unified APIs. Workload portability tools reduce lock-in concerns, while consumption-based billing aligns with elastic demand periods. Vendor roadmaps that bundle monitoring, billing, and governance dashboards further simplify hybrid-cloud adoption.
Many regulated industries still prefer on-premise stacks for data residency. These private clouds integrate AI-ready services from Airship that allow sensitive model training inside sovereign facilities. Banks, healthcare networks, and governments balance sovereignty with modernization by extending on-premise OpenStack to edge nodes for analytics close to data sources. Collectively, on-premise remains strategically relevant, and its evolution toward micro-data-center fabrics adds nuanced demand to the overall OpenStack Services market.


By Service Type: Managed Services Lead Market Evolution
Managed services commanded 42.85% revenue in 2025 and will expand at a 33.6% CAGR, the highest among service lines. Providers such as Rackspace accumulate more than 1 billion OpenStack server hours, converting operational knowledge into hardened SLAs. This outsourcing trend offsets customer talent shortages and accelerates time-to-value without capital outlays. Flexible pricing—USD 15 per host per day or flat tiers up to USD 350,000 annually—broadens accessibility to enterprises of all sizes.
Consulting and implementation services secure early-phase revenue as enterprises scope migrations and integrate with existing toolchains. Training and support emerge as the fastest subsegment because clients eventually build internal Centers of Excellence to optimize spend. Each service layer feeds the OpenStack Services market as organizations progress from pilot to production and then toward continuous improvement cycles.
By End-user Industry: Telecommunications Drives Adoption
Telecommunications retained the largest slice at 27.55% in 2025, and the segment is on track for a 32.55% CAGR over the forecast period. Operators deploy OpenStack clouds to virtualize packet core, IMS, and RAN functions, gaining agility for 5G rollouts and edge services. Verizon’s implementation demonstrates multi-data-center scale without compromising uptime targets. The OpenStack Services market share of telecom is therefore expected to widen as 5G densification and future 6G research intensify compute requirements at the network’s edge.
Information-technology providers leverage OpenStack to host developer platforms, while financial-services firms adopt it to meet sovereignty laws and mitigate public-cloud egress fees. Academic institutions favor community governance and cost efficiency for research clusters. Retail and e-commerce firms use seasonal elasticity, and government agencies integrate OpenStack into sovereign-cloud frameworks such as Germany’s Open Telekom Cloud.
By Organization Size: SME Adoption Accelerates
Large enterprises contributed 55.10% of 2025 revenue, reflecting capital depth and early experimentation with private cloud. Walmart operates over 1 million OpenStack cores to serve internal commerce and data-analytics workloads. Mature governance processes and integration budgets keep large companies central to ecosystem influence.
Small and medium enterprises recorded the fastest trajectory at 31.95% CAGR. Managed service packaging, container-native blueprints, and simplified installers lower barriers to entry, letting SMEs adopt enterprise-grade infrastructure without heavy up-front investment. As cloud costs grow under hyperscale providers’ egress pricing, SMEs perceive OpenStack as a pathway to cost control and strategic autonomy, feeding sustained demand within the OpenStack Services market.
Geography Analysis
North America held 34.10% revenue in 2025, anchored by early adoption and heavy telecom virtualization. Enterprises such as Walmart validate hyperscale private-cloud practicality at million-core scale, encouraging peers across finance and retail to replicate similar hybrid architectures. Post-Broadcom uncertainty accelerates migrations, and local talent pools enable complex integrations, keeping North America both lucrative and innovative for OpenStack vendors.
Asia-Pacific represents the fastest growing region at 32.4% CAGR. China ranks second globally in OpenStack code contributions, with Baidu, Tencent, and China Mobile driving community commits and deploying production clusters exceeding tens of thousands of nodes. National digital sovereignty policies and 5G network rollouts intensify spending on open infrastructures. Japan and India add further momentum through telecom network upgrades and enterprise digitalization, widening regional opportunity for the OpenStack Services market.
Europe’s growth stems from regulatory imperatives like NIS2 and Gaia-X that enforce data residency. Deutsche Telekom’s sovereign Open Telekom Cloud showcases a production OpenStack platform aligned with European security standards . As banks and public agencies seek home-region data governance, OpenStack fulfills both compliance and cost criteria. Continued public funding for cyber resilience and AI infrastructure sustains demand, particularly among midsize enterprises aiming to meet new EU cyber mandates.

Competitive Landscape
The OpenStack Services market features moderate concentration. Red Hat leverages OpenShift integration to embed OpenStack within a broader cloud-native suite, contributing to IBM software revenue momentum. Mirantis specializes in Kubernetes-native OpenStack, while Canonical promotes lightweight operations and per-host managed pricing. Rackspace positions as a full-service managed provider, and telecom equipment makers integrate OpenStack into network automation offerings.
Partnership ecosystems shape competitive tactics. Red Hat collaborates with Nokia for telco 5G deployments, Canonical teams with AMD for AI acceleration, and Mirantis partners with VMware migration consultancies. Vendors invest in upstream code commits to boost credibility and secure influence over roadmap direction. Strategic alliances also extend to chipmakers and storage firms, ensuring validated reference architectures that de-risk customer rollouts.
MandA underscores value creation around automation. IBM’s USD 6.4 billion HashiCorp deal signals appetite for multi-cloud infrastructure orchestration, hinting at tighter coupling between OpenStack and Terraform pipelines. Smaller acquisitions focus on edge orchestration and observability start-ups, integrating missing capabilities into vendor stacks. With the top five suppliers holding an estimated 60% of total revenue, the market leaves space for niche specialists but rewards scale advantages, especially in managed services.
OpenStack Services Industry Leaders
Cisco Systems, Inc.
Red Hat, Inc.
Hewlett Packard Enterprise Development LP
VMware, Inc.
Mirantis, Inc.
- *Disclaimer: Major Players sorted in no particular order

Recent Industry Developments
- March 2025: OpenInfra Foundation confirmed integration with Linux Foundation to streamline governance while retaining independent budget controls.
- February 2025: Mirantis unveiled k0rdent, an open-source DCME for multi-cloud AI workloads.
- November 2024: Red Hat released Enterprise Linux AI 1.3, adding generative-AI model support to hybrid clouds.
- October 2024: OpenStack community shipped release 2024.2 Dalmatian with AI and security upgrades.


Global OpenStack Services Market Report Scope
OpenStack is an open-source platform that utilizes pooled virtual resources to build and manage private and public clouds. The tools that comprise the OpenStack platform, called projects, handle the core cloud-computing services of networking, computing, identity, storage, and image services. More than a dozen optional projects could also be bundled together to create unique, deployable clouds. As part of our market coverage, the adoption of OpenStack technologies is studied and categorized by deployment type, end users, and geographical coverage.
The openstack services market is segmented by deployment model (on-cloud and on-premise), end-user industry (information technology, telecommunication, banking and financial services, academic, and retail/e-Commerce), and geography (North America, Europe, Asia-Pacific, and Rest of the World). The market sizes and forecasts are provided in terms of value in USD for all the above segments.
| On-Cloud |
| On-Premise |
| Consulting |
| Implementation |
| Managed Services |
| Training and Support |
| Information Technology |
| Telecommunications |
| Banking and Financial Services |
| Academic and Education |
| Retail and E-Commerce |
| Government and Public Sector |
| Large Enterprises |
| Small and Medium Enterprises |
| North America | United States | |
| Canada | ||
| Mexico | ||
| South America | Brazil | |
| Argentina | ||
| Rest of South America | ||
| Europe | Germany | |
| United Kingdom | ||
| France | ||
| Netherlands | ||
| Spain | ||
| Italy | ||
| Russia | ||
| Rest of Europe | ||
| Asia-Pacific | China | |
| Japan | ||
| India | ||
| South Korea | ||
| Australia and New Zealand | ||
| Rest of Asia-Pacific | ||
| Middle East and Africa | Middle East | Saudi Arabia |
| United Arab Emirates | ||
| Turkey | ||
| Israel | ||
| Rest of Middle East | ||
| Africa | South Africa | |
| Nigeria | ||
| Kenya | ||
| Rest of Africa | ||
| By Deployment Model | On-Cloud | ||
| On-Premise | |||
| By Service Type | Consulting | ||
| Implementation | |||
| Managed Services | |||
| Training and Support | |||
| By End-user Industry | Information Technology | ||
| Telecommunications | |||
| Banking and Financial Services | |||
| Academic and Education | |||
| Retail and E-Commerce | |||
| Government and Public Sector | |||
| By Organization Size | Large Enterprises | ||
| Small and Medium Enterprises | |||
| By Geography | North America | United States | |
| Canada | |||
| Mexico | |||
| South America | Brazil | ||
| Argentina | |||
| Rest of South America | |||
| Europe | Germany | ||
| United Kingdom | |||
| France | |||
| Netherlands | |||
| Spain | |||
| Italy | |||
| Russia | |||
| Rest of Europe | |||
| Asia-Pacific | China | ||
| Japan | |||
| India | |||
| South Korea | |||
| Australia and New Zealand | |||
| Rest of Asia-Pacific | |||
| Middle East and Africa | Middle East | Saudi Arabia | |
| United Arab Emirates | |||
| Turkey | |||
| Israel | |||
| Rest of Middle East | |||
| Africa | South Africa | ||
| Nigeria | |||
| Kenya | |||
| Rest of Africa | |||


Key Questions Answered in the Report
What is the current size of the OpenStack Services market?
The OpenStack Services market size stands at USD 39.59 billion in 2026 and is forecast to reach USD 155.36 billion by 2031.
Which sector leads OpenStack adoption?
Telecommunications leads with 27.55% market share in 2025 and is growing at a 32.55% CAGR through 2031, driven by Network Function Virtualization rollouts.
Why are enterprises moving from VMware to OpenStack now?
Broadcom’s VMware license changes doubled costs for many customers, prompting migrations to the lower-TCO OpenStack platform and reducing vendor lock-in risk.
How fast is the Asia-Pacific region growing?
Asia-Pacific is the fastest geographic segment, projected to expand at a 32.4% CAGR between 2026 and 2031, supported by Chinese telecom and sovereignty initiatives.
Page last updated on:


