Open Source Service Market Size and Share
Market Overview
| Study Period | 2020 - 2031 |
|---|---|
| Market Size (2026) | USD 44.12 Billion |
| Market Size (2031) | USD 93.46 Billion |
| Growth Rate (2026 - 2031) | 16.22% CAGR |
| Fastest Growing Market | Asia Pacific |
| Largest Market | North America |
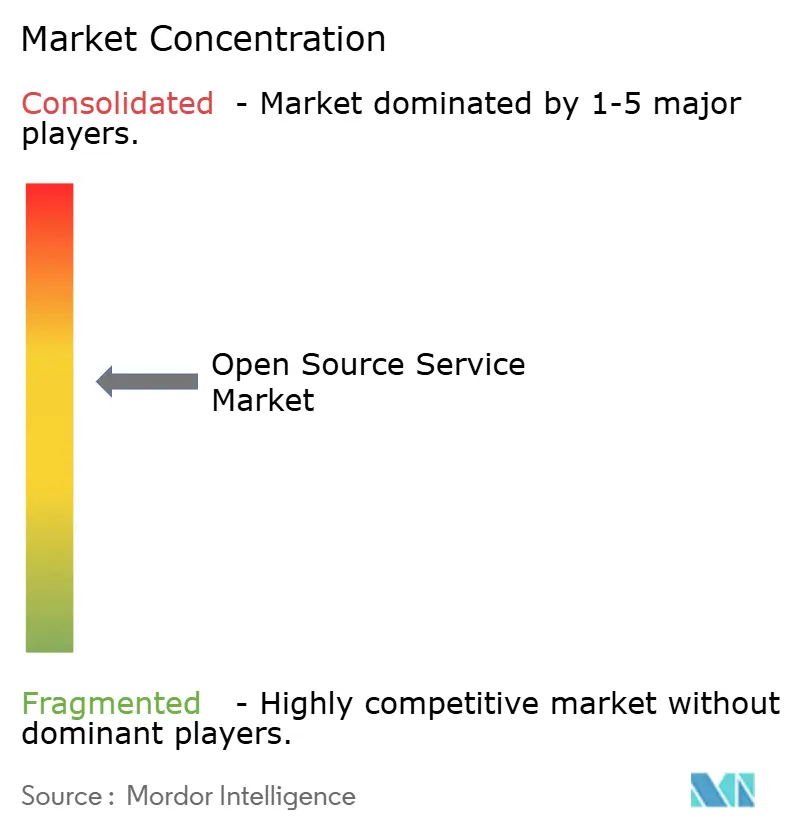
| Market Concentration | Medium |
Major Players *Disclaimer: Major Players sorted in no particular order Image © Mordor Intelligence. Reuse requires attribution under CC BY 4.0. | |
Open Source Service Market Analysis by Mordor Intelligence
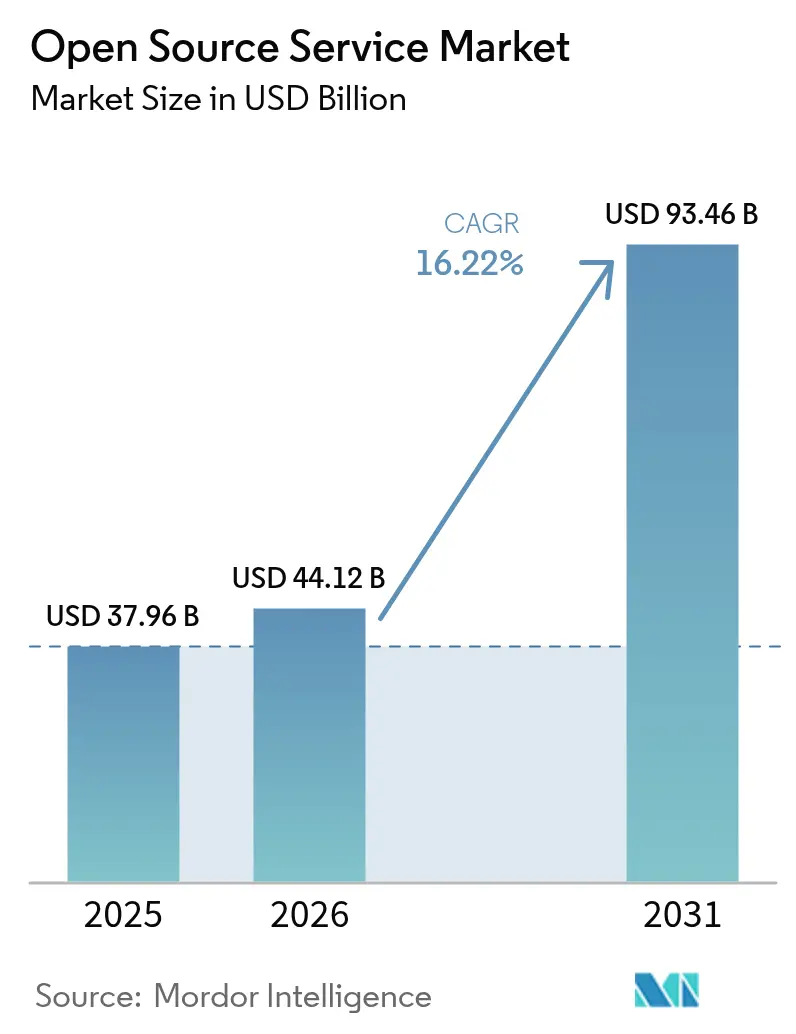
The Open Source Service market size is expected to grow from USD 37.96 billion in 2025 to USD 44.12 billion in 2026 and is forecast to reach USD 93.46 billion by 2031 at 16.22% CAGR over 2026-2031. Heightened enterprise focus on digital sovereignty, vendor-lock-in reduction and cost optimization is turning the Open Source Service market into a strategic pillar of transformation budgets. Organizations increasingly view community-developed code as an innovation accelerator, with 96% maintaining or expanding open-source use. Regulatory momentum—such as the EU Digital Markets Act and Switzerland’s open-source mandate—continues to steer procurement toward open standards[1]European Commission, “Digital Markets Act: Designation of Gatekeepers,” ec.europa.eu. Implementation complexity propels service revenues because 93% of hiring managers still struggle to find qualified talent. Skills shortages, rising security expectations and hybrid-cloud adoption keep managed services growth ahead of consulting, while on-premise deployments remain relevant for data-sensitive industries.
Key Report Takeaways
- By service type, Consulting and Implementation led with 42.74% of Open Source Service market share in 2025, while Managed Services is projected to expand at a 17.6% CAGR through 2031.
- By deployment mode, On-premise held 67.78% share of the Open Source Service market size in 2025; cloud deployment is advancing at an 18.03% CAGR to 2031.
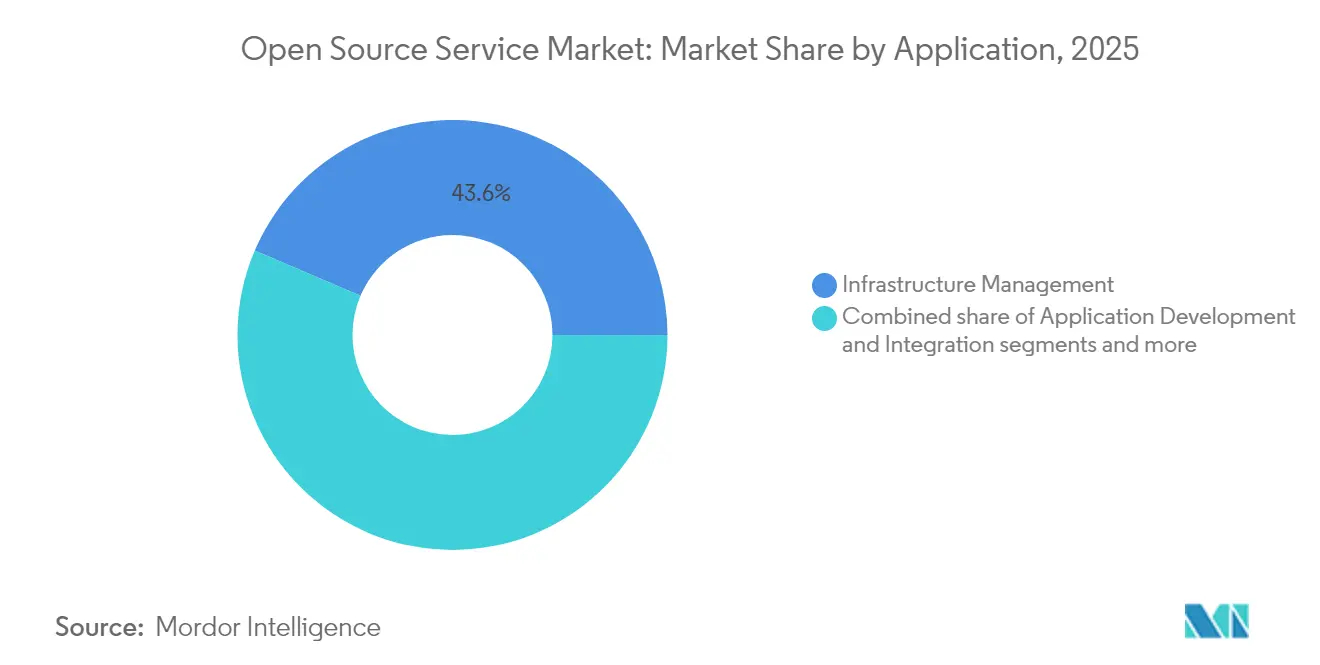
- By application, Infrastructure Management accounted for a 43.58% share of the Open Source Service market size in 2025, and Data Management and Analytics is forecast to grow at 17.28% CAGR.
- By end-user industry, IT and Telecom captured 26.35% revenue share in 2025, whereas Healthcare and Life Sciences shows the fastest CAGR at 16.61% through 2031.
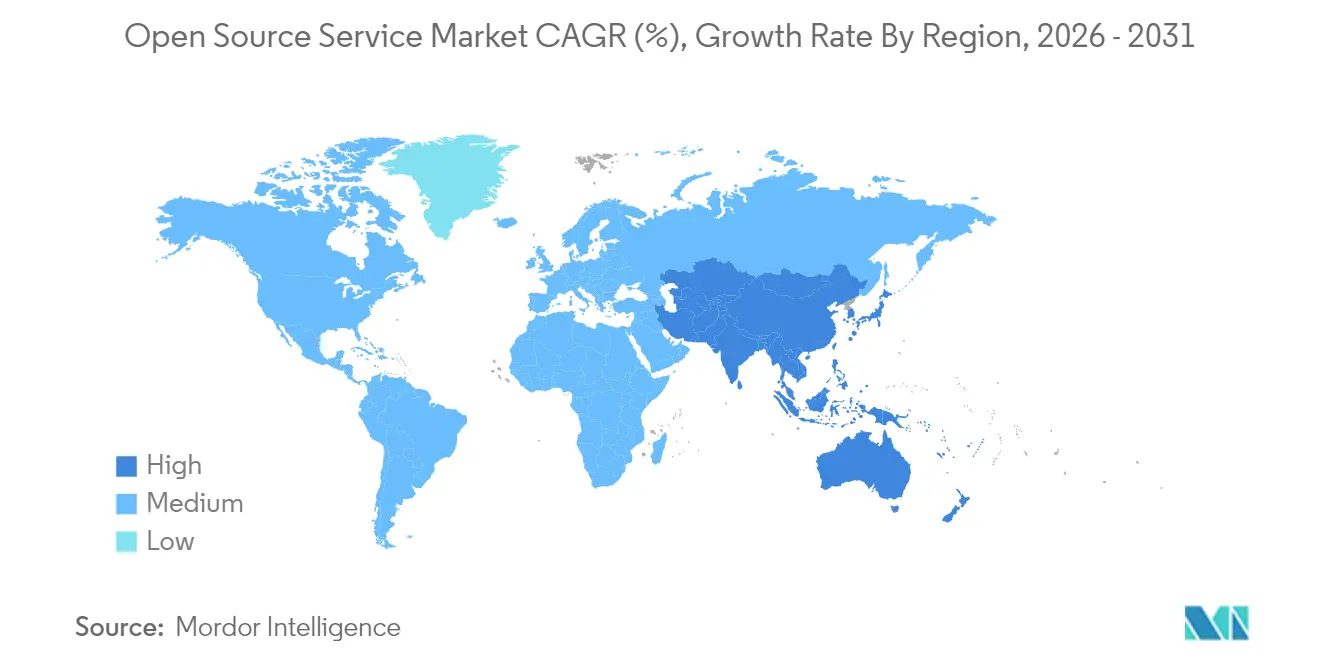
- By geography, North America contributed 37.35% revenue in 2025; Asia-Pacific is the fastest-growing region with a 16.92% CAGR through 2031.
Note: Market size and forecast figures in this report are generated using Mordor Intelligence’s proprietary estimation framework, updated with the latest available data and insights as of 2026.
Global Open Source Service Market Trends and Insights
Drivers Impact Analysis*
| Driver | (~) % Impact on CAGR Forecast | Geographic Relevance | Impact Timeline |
|---|---|---|---|
| Reduced cost of ownership and time-to-market | +3.2% | Global, with strongest impact in APAC and Latin America | Medium term (2-4 years) |
| Interoperability and customisation flexibility | +2.8% | Global, particularly EU due to DMA compliance | Long term (≥ 4 years) |
| Cloud-native and DevOps adoption surge | +4.1% | North America & EU leading, APAC following | Short term (≤ 2 years) |
| Enterprise digital-transformation budgets | +3.5% | Global, concentrated in developed markets | Medium term (2-4 years) |
| EU Digital Markets Act-driven open standards push | +1.9% | EU primary, spillover to other regulated markets | Long term (≥ 4 years) |
| Sustainability-led vendor-lock-in avoidance | +1.7% | EU and North America leading, global adoption | Long term (≥ 4 years) |
| Source: Mordor Intelligence | |||
Reduced Cost of Ownership and Time-to-Market
Organizations select open source to cut licensing fees and accelerate solution rollout. In 2025, 53% cited cost reduction as their prime adoption impulse. Financial-services firms illustrate this shift: 78% reported higher value from open-source implementations and 90% deemed the approach vital for future operations. Rapid prototyping in AI projects, made possible by freely available frameworks, trims procurement cycles, yet the need for secure production rollouts fuels paid support engagements.
Cloud-Native and DevOps Adoption Surge
Enterprises pursuing containerization and GitOps rely heavily on open-source tooling, pushing demand for specialized consulting. Container usage now spans 90% of surveyed firms, with 86% running Kubernetes clusters, while 85% require professional assistance to manage these environments. Telecommunications groups such as Deutsche Telekom apply these practices to re-architect 5G networks, proving the scalability of open standards.
Enterprise Digital-Transformation Budgets
Global managed services spending surpassed USD 100 billion in 2023, with 15% of contracts tied to AI initiatives. Manufacturing exemplifies the pivot: 93% of firms launched new AI projects during 2024, many on open-source toolchains. Healthcare researchers likewise rely on community code bases for genomics and collaborative R&D, tightening the link between IT budgets and professional open-source services.
Interoperability and Customisation Flexibility
Cross-platform integration and code transparency ease regulatory compliance. The EU Digital Markets Act designates six gatekeepers, compelling enterprises to favor open standards to avoid ecosystem lock-in. Germany’s public-sector migration to openDesk and Switzerland’s legal requirement for government software transparency show how policy catalyzes service demand.
Restraints Impact Analysis*
| Restraint | (~) % Impact on CAGR Forecast | Geographic Relevance | Impact Timeline |
|---|---|---|---|
| Security and vulnerability concerns | -2.4% | Global; acute in regulated industries | Short term (≤ 2 years) |
| Scarcity of skilled open-source talent | -1.8% | Global; acute in APAC and emerging markets | Medium term (2-4 years) |
| Licence-compliance complexity | -1.2% | EU and North America due to tight regulation | Medium term (2-4 years) |
| Risk of community project abandonment | -0.9% | Global; smaller firms relying on niche tools most affected | Long term (≥ 4 years) |
| Source: Mordor Intelligence | |||
Security and Vulnerability Concerns
Although 91% of financial institutions express confidence in open-source security, high-profile supply-chain attacks elevate risk perceptions. The April 2025 withdrawal of federal funding for the CVE system complicates vulnerability tracking. Recent flaws in Linux and Ruby-SAML spotlight long discovery lags, prompting enterprises to purchase professional monitoring and patching services.
Scarcity of Skilled Open-Source Talent
Ninety-three percent of hiring managers struggle to recruit qualified candidates. Certified engineers command premium pay, particularly in cloud, container, and cybersecurity domains. Red Hat has trained more than 200,000 students through its Academy program to mitigate the shortfall. Labor constraints lengthen project timelines and elevate costs, tempering overall market expansion.
*Our forecasts treat driver/restraint impacts as directional, not additive. The impact forecasts reflect baseline growth, mix effects, and variable interactions.
Segment Analysis
By Service Type: Consulting Leads While Managed Services Accelerate
Consulting and Implementation retained a 42.74% Open Source Service market share in 2025 as enterprises tackled complex migrations. Managed Services, however, is forecast to post a 17.6% CAGR as firms pivot toward outcome-based engagements and continuous optimization. Enterprises confronting container sprawl—85% need help with production workloads—prefer long-term managed contracts to ad-hoc support.
Training and Certification grows quickly because 52% of managers favor certified hires, while Support, Maintenance and Management remains a staple for organizations scaling diverse stacks. The Open Source Service market benefits from this layered demand structure, turning skill scarcity into recurring-revenue opportunities for service vendors.


By Deployment Mode: Cloud Gains Momentum Despite On-Premise Dominance
On-premise held 67.78% of the Open Source Service market size in 2025, reflecting regulatory and data-sovereignty needs. Yet cloud deployments are advancing at an 18.03% CAGR as hybrid architectures normalize. Telecom operators report 77% effectiveness for cloud migrations, but maintain private environments for sensitive workloads.
Container adoption blurs deployment distinctions because 90% of firms run containerized code on both on-premise and public-cloud platforms. This convergence keeps the Open Source Service market resilient across infrastructure models and expands the addressable scope for integration specialists.
By Application: Infrastructure Management Leads While Data Analytics Surges
Infrastructure Management commanded 43.58% of revenue in 2025, underpinned by modernization projects. Data Management and Analytics is set to grow 17.28% annually, buoyed by generative-AI workloads requiring scalable, low-cost data platforms. Pharmaceutical and manufacturing firms illustrate this pivot, embedding open-source analytics into R&D and predictive-maintenance initiatives.
Application Development and Integration and Security and Compliance also gain traction as DevOps teams standardize on open APIs and regulators tighten data-handling rules. Multiple use-cases ensure the Open Source Service market remains diversified, limiting over-dependence on any single category.
By End-User Industry: IT and Telecom Mature While Healthcare Accelerates
IT and Telecom contributed 26.35% of revenue in 2025, reflecting deep-rooted Linux and Kubernetes penetration. Healthcare and Life Sciences is projected to expand 16.61% yearly, propelled by collaborative research and bioinformatics workloads. BFSI continues to scale open-source footprints; 52% of banks already operate formal Open Source Program Offices.
Government mandates in Germany and Switzerland fuel public-sector demand, while manufacturing leverages open-source platforms for Industry 4.0 automation. Cross-industry proliferation underpins long-run growth for the Open Source Service market.
Geography Analysis
North America accounted for 37.35% of 2025 revenue thanks to mature enterprise adoption, a deep talent pool, and venture-capital backing for commercial open-source startups. Financial-services consortia such as FINOS encourage code sharing, and large-scale M&A—IBM’s USD 6.4 billion HashiCorp purchase—shows incumbents doubling down on open-source portfolios. The region’s value proposition centers on complex, high-margin consulting engagements.
Asia-Pacific is the fastest-growing region, projected at 16.92% CAGR through 2031. China positions open source as a pillar of tech self-reliance, while India’s IT services sector exports expertise worldwide. APAC organizations lead global modernization metrics, with 67% using open-source infrastructure tools. Telecommunications carriers in Japan, South Korea, and Australia deploy Kubernetes-driven 5G cores, sustaining regional service momentum.
Europe’s trajectory benefits from the Digital Markets Act and national sovereignty programs. Germany’s openDesk rollout and Switzerland’s federal EMBAG law are spurring migration away from proprietary suites. Service providers with compliance know-how and multilingual delivery teams capture rising demand, making the Open Source Service market outlook robust across the continent.

Competitive Landscape
The Open Source Service market features a mid-level concentration where global technology vendors compete with focused specialists. Red Hat leads in enterprise Linux and OpenShift container platforms, maintaining roughly USD 2 billion annual revenue while seeding partner ecosystems. SUSE’s Rancher acquisition sharpened its Kubernetes profile, and Canonical’s Ubuntu enjoys a broad public-cloud presence.
Platform vendors such as AWS, Google, and Oracle embed open-source stacks into wider cloud-service portfolios, cross-subsidizing support with platform revenue. Emerging providers—Crunchy Data for PostgreSQL or Grafana Labs for observability—address niche growth pockets and often become acquisition targets. Snowflake’s USD 250 million Crunchy Data deal underscores mounting interest in database-as-a-service plays.
Competitive focus is shifting from break-fix support to managed services, AI integration, and vertical solutions. Container software is illustrative: Red Hat holds a 47.8% share through proactive training programs, whereas SUSE commands 3.9% after consolidating Rancher. Market entrants differentiate via security tooling and compliance automation, leveraging the persistent talent gap to price premium engagements in the Open Source Service market.
Open Source Service Industry Leaders
Red Hat Inc.
Oracle Corporation
Cisco Systems, Inc.
Infosys Limited
Hewlett Packard Enterprise Company
- *Disclaimer: Major Players sorted in no particular order

Recent Industry Developments
- June 2025: Snowflake announced its acquisition of Crunchy Data for approximately USD 250 million to create Snowflake Postgres, an enterprise-ready version of open-source PostgreSQL.
- May 2025: Deutsche Telekom launched sustainability initiatives integrating OpenStack and Kubernetes to cut network energy use while engaging the developer community.
- December 2024: Sonar acquired Tidelift to enhance code-security and quality-management offerings.
- April 2024: IBM completed its USD 6.4 billion acquisition of HashiCorp, bolstering hybrid-cloud automation capabilities.


Research Methodology Framework and Report Scope
Market Definitions and Key Coverage
Our study defines the open-source services market as the revenue earned when third-party providers consult, integrate, host, support, manage, or train on software released under an OSI-approved license for corporate or public sector workloads. According to Mordor Intelligence, value-added offers such as managed Kubernetes clusters or enterprise Linux support are counted, while license fees for closed-source add-ons are not.
Scope exclusion: Pure open-source intelligence tools, hardware installation work, and commercial plug-ins whose code is not openly shared lie outside this report.
Segmentation Overview
- By Service Type
- Consulting and Implementation
- Support, Maintenance and Management
- Managed Services
- Training and Certification
- By Deployment Mode
- On-premise
- Cloud
- By Application
- Infrastructure Management
- Application Development and Integration
- Data Management and Analytics
- Security and Compliance
- By End-user Industry
- Banking, Financial Services and Insurance (BFSI)
- IT and Telecom
- Manufacturing
- Government and Public Sector
- Healthcare and Life Sciences
- Other End-user Industries
- By Geography
- North America
- United States
- Canada
- Mexico
- Europe
- Germany
- United Kingdom
- France
- Italy
- Spain
- Rest of Europe
- Asia-Pacific
- China
- Japan
- India
- South Korea
- Australia
- Rest of Asia-Pacific
- South America
- Brazil
- Argentina
- Rest of South America
- Middle East and Africa
- Middle East
- Saudi Arabia
- United Arab Emirates
- Turkey
- Rest of Middle East
- Africa
- South Africa
- Egypt
- Nigeria
- Rest of Africa
- Middle East
- North America
Detailed Research Methodology and Data Validation
Primary Research
Mordor analysts speak with chief technology officers, open-source program office heads, cloud platform architects, and community maintainers across North America, Europe, and Asia. These dialogues validate price corridors, utilization ratios, and the speed at which legacy stacks migrate to community-driven software.
Desk Research
We begin with structured reviews of non-paywalled authorities such as Linux Foundation usage surveys, US Bureau of Labor Statistics ICT spend tables, UN Comtrade server shipment codes, GitHub Octoverse trend files, OECD ICT price indices, and Securities and Exchange Commission filings. Supplemental context flows from D&B Hoovers, Dow Jones Factiva, and Questel patent alerts that flag enterprise adoption patterns. These materials guide us as we map demand pockets and cross-check service tariff benchmarks; many other public and proprietary sources also inform the model.
Market-Sizing and Forecasting
We rebuild the global revenue pool through a top-down filter that starts with enterprise outsourcing and cloud managed-services spending, then applies open-source penetration ratios drawn from survey data, server install bases, and container cluster counts. Select bottom-up checks, provider revenue snapshots and average day-rate times billed hours tighten the totals. Key model levers include Linux server shipments, share of DevOps pipelines using open tools, active GitHub enterprise repositories, cloud migration intensity, regional wage inflation, and subscription renewal churn. A multivariate regression with scenario analysis produces the 2025-2030 trajectory and flags sensitivity to wage and adoption shocks.
Data Validation and Update Cycle
Outputs pass variance tests, peer comparison, and senior analyst review before sign-off. We refresh numbers each year, with interim updates when material provider mergers, regulation, or pricing swings occur.
Why Mordor's Open Source Service Baseline Commands Reliability
Published estimates differ because firms mix unlike service buckets, price ladders, and refresh cadences. Our baseline anchors its totals to a clear scope, transparent variables, and an annual audit, which several others skip.
Key gap drivers include whether advisory hours are bundled, if community donations are treated as revenue, and the currency year chosen for cloud-price deflation adjustments.
Benchmark comparison
| Market Size | Anonymized source | Primary gap driver |
|---|---|---|
| USD 37.96 B (2025) | Mordor Intelligence | |
| USD 33.90 B (2023) | Global Consultancy A | counts only professional services, omits managed hosting |
| USD 28.09 B (2023) | Industry Research B | uses constant price, ignores wage variation |
| USD 35.30 B (2024) | Regional Consultancy C | excludes small-enterprise spend, limited survey base |
Taken together, the comparison shows that Mordor Intelligence delivers a balanced, transparent view that decision-makers can retrace and trust.


Key Questions Answered in the Report
What is the current value of the Open Source Service market?
The Open Source Service market size stood at USD 44.12 billion in 2026 and is forecast to reach USD 93.46 billion by 2031.
Which segment is growing fastest within the Open Source Service market?
Managed Services is the fastest-growing service segment, projected at a 17.6% CAGR through 2031 as enterprises seek outcome-based engagements.
Why are enterprises shifting toward open source solutions?
Drivers include lower total cost of ownership, faster time-to-market, regulatory pushes for interoperability and the flexibility to customize code for unique needs.
Which region will see the highest growth?
Asia-Pacific is expected to expand at a 16.92% CAGR, boosted by China’s open-source initiatives and India’s expanding IT-services footprint.
What are the main challenges facing the Open Source Service market?
Key restraints are security and vulnerability concerns, licence-compliance complexity and a global shortage of skilled open-source professionals.
Who are the leading companies in the Open Source Service market?
Major players include Red Hat, IBM, SUSE, Canonical, AWS and specialized firms such as Crunchy Data and Grafana Labs, each focusing on different layers of the ecosystem.
Page last updated on:


