
Market Overview
| Study Period | 2020 - 2031 |
|---|---|
| Market Size (2026) | USD 57.05 Billion |
| Market Size (2031) | USD 67.02 Billion |
| Growth Rate (2026 - 2031) | 3.28 % |
| Fastest Growing Market | Asia Pacific |
| Largest Market | Asia Pacific |
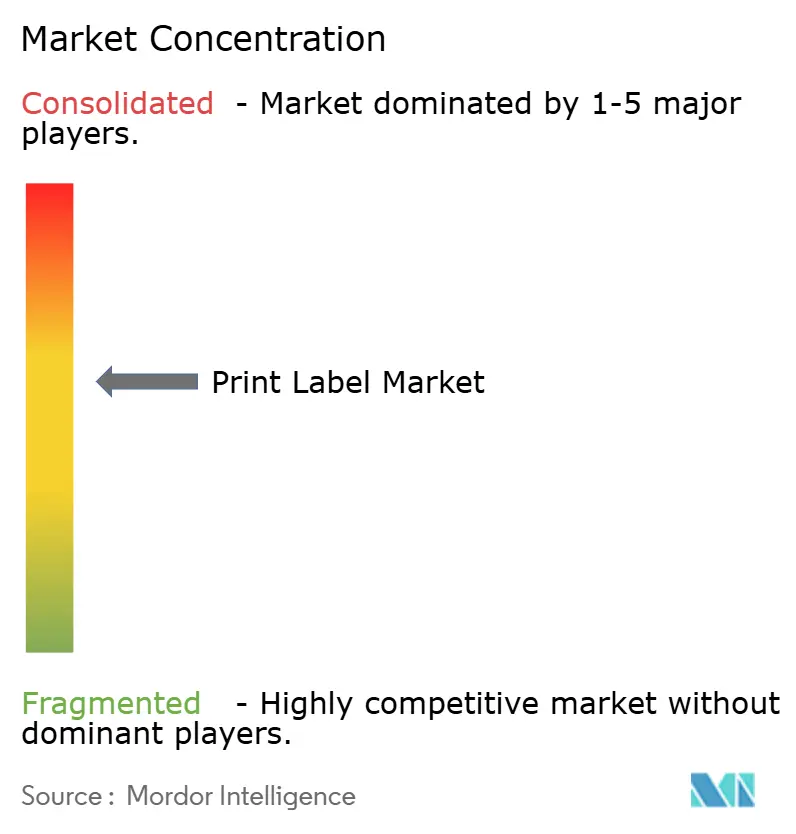
| Market Concentration | Medium |
Major Players *Disclaimer: Major Players sorted in no particular order Image © Mordor Intelligence. Reuse requires attribution under CC BY 4.0. | |
Print Label Market Analysis by Mordor Intelligence
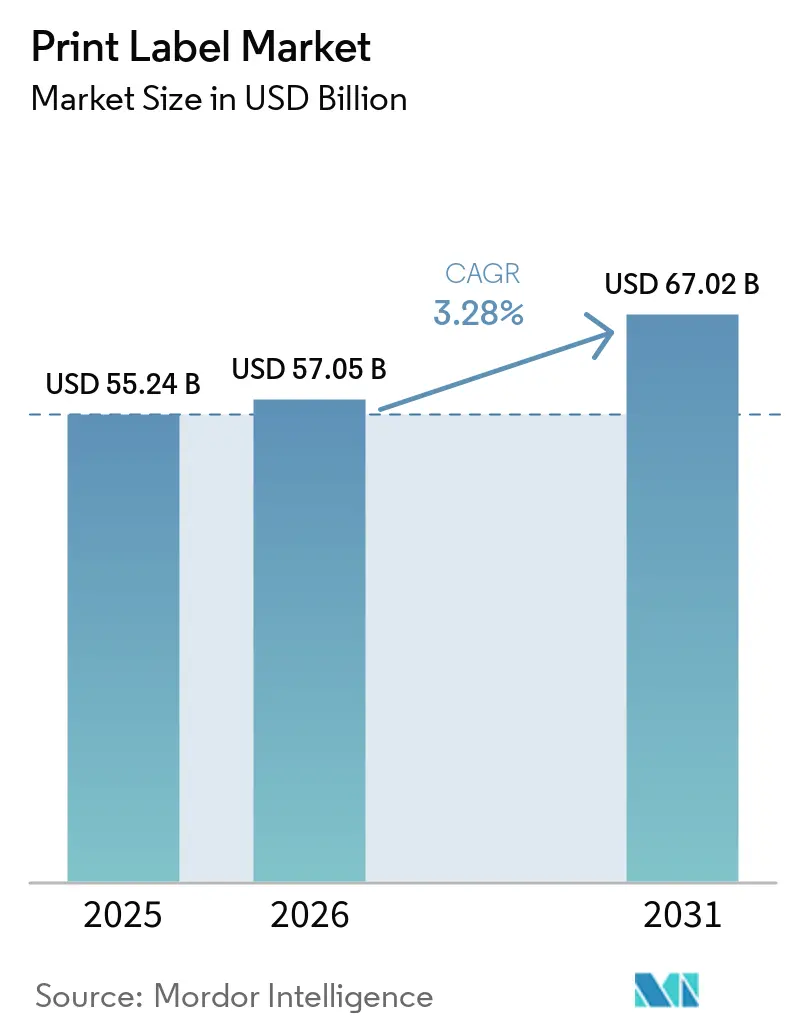
Print label market size in 2026 is estimated at USD 57.05 billion, growing from 2025 value of USD 55.24 billion with 2031 projections showing USD 67.02 billion, growing at 3.28% CAGR over 2026-2031. Steady expansion reflects the sector’s shift from purely analog processes to digitally enabled, sustainability-focused production frameworks that lower minimum order quantities, compress lead times, and cut material waste. Flexography still controls the largest share of installed capacity, yet inkjet systems are scaling rapidly as converters look to satisfy proliferating SKUs and e-commerce labeling needs. Brand owners’ preference for linerless formats and intelligent identifiers, plus mandated pharmaceutical serialization and food traceability, is reshaping converter investment priorities. Cost pressure from substrate and adhesive volatility continues, but margin resilience hinges on hybrid digital-flexo workflows, supply-chain integration, and circular-economy compliant materials.
Key Report Takeaways
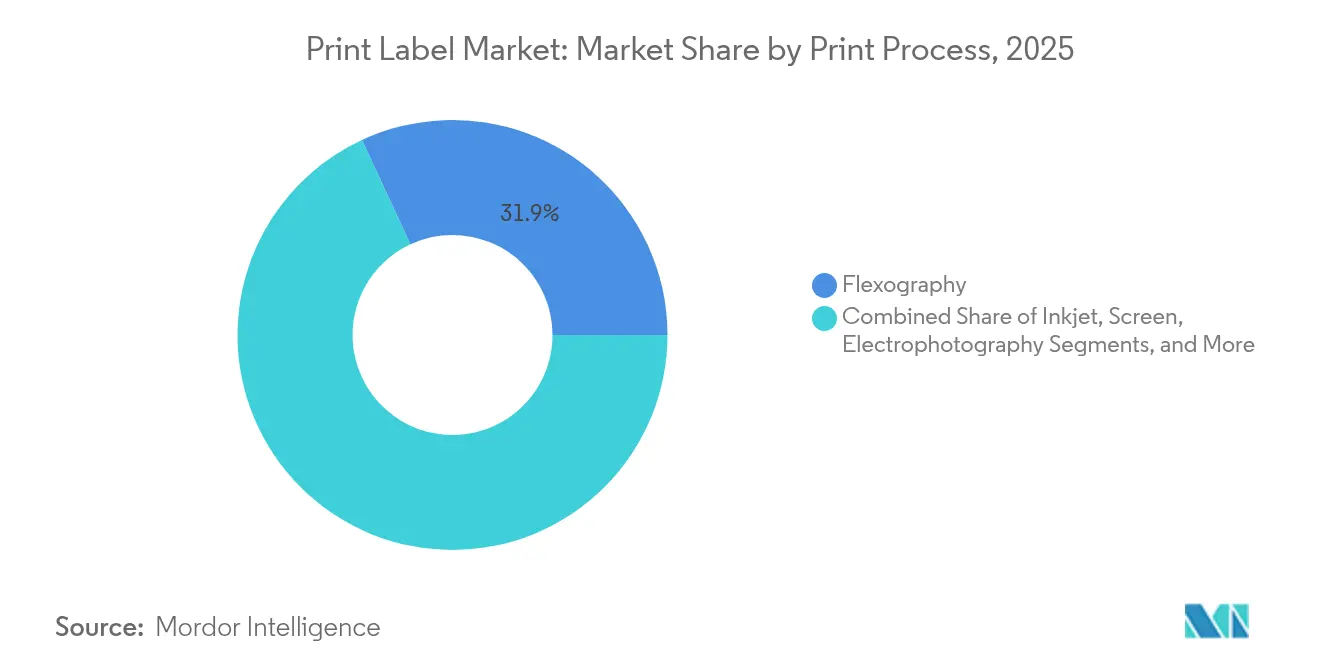
- By print process, flexography captured 31.92% of the print label market share in 2025.
- By label format, the print label market size for linerless labels is projected to grow at a 5.56% CAGR between 2026-2031.
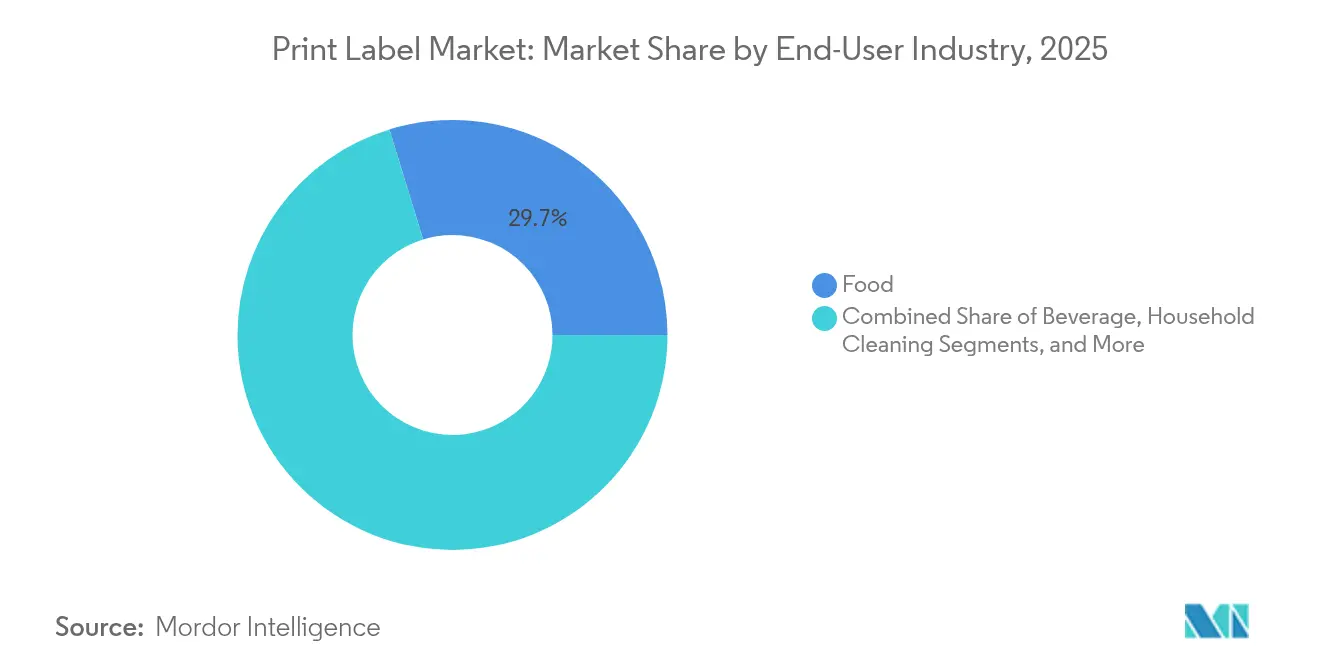
- By end-user industry, food captured 29.74% of the print label market share in 2025.
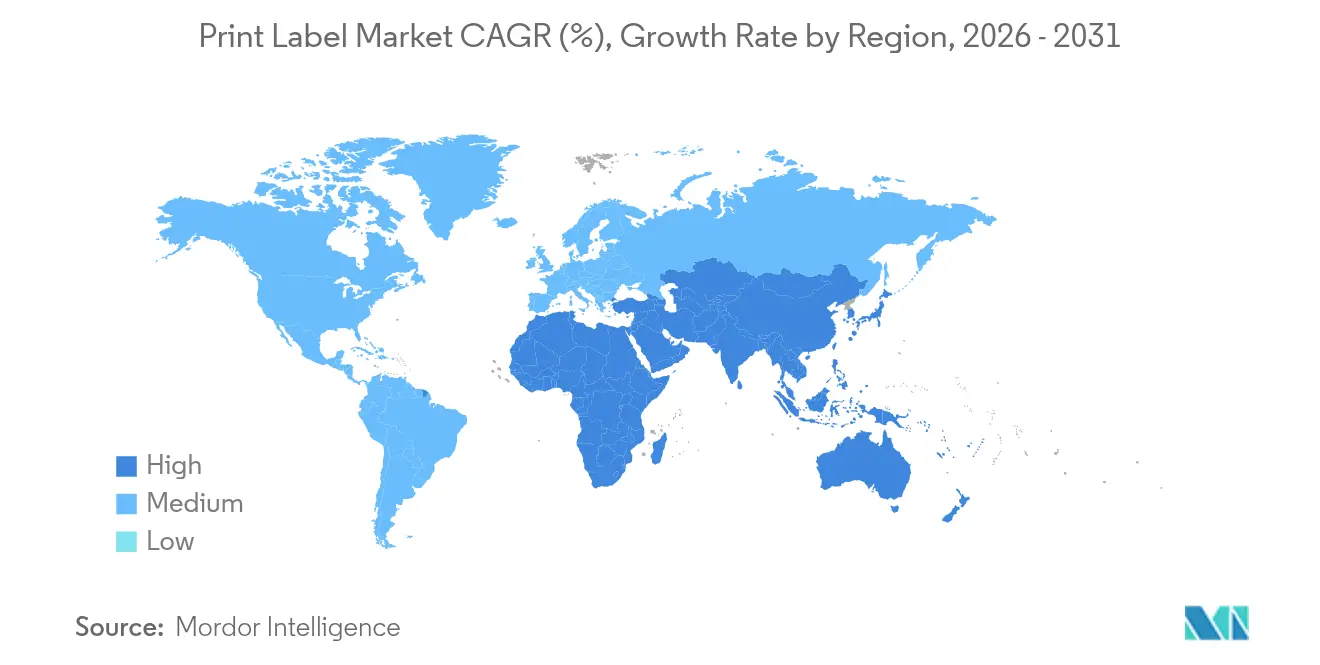
- By geography, the print label market size for Asia-Pacific is projected to grow at a 4.63% CAGR between 2026-2031.
Note: Market size and forecast figures in this report are generated using Mordor Intelligence’s proprietary estimation framework, updated with the latest available data and insights as of 2026.
Market Trends and Insights
Drivers Impact Analysis of Print Label Market*
| Driver | (~) % Impact on CAGR Forecast | Geographic Relevance | Impact Timeline |
|---|---|---|---|
| Accelerated adoption of high-speed digital (inkjet) presses for short-run, SKU-proliferated label jobs | +0.8% | Global, with early adoption in North America and Europe | Medium term (2-4 years) |
| Brand-owner shift toward linerless pressure-sensitive labels to cut waste and logistics costs | +0.6% | Global, strongest in North America and Europe | Medium term (2-4 years) |
| E-commerce boom driving demand for variable-data shipping and return labels | +0.7% | Global, led by North America and Asia-Pacific | Short term (≤ 2 years) |
| Regulatory push for smart/barcode labels enabling end-to-end traceability (EU FMD, U.S. DSCSA) | +0.5% | North America and Europe, expanding to Asia-Pacific | Long term (≥ 4 years) |
| Growth of craft beverage and gourmet foods requiring premium, embellishment-rich labels | +0.3% | North America and Europe, emerging in Asia-Pacific | Medium term (2-4 years) |
| Emerging antimicrobial label coatings for food safety in cold-chain logistics | +0.2% | Global, with regulatory focus in North America and Europe | Long term (≥ 4 years) |
| Source: Mordor Intelligence | |||
Accelerated Adoption of High-Speed Digital Presses for Short-Run Production
Digital inkjet platforms enable profitable runs as low as 500 pieces, contrasting with flexography’s historical 10,000-unit threshold, thereby unlocking new SKU strategies for consumer brands. Capital outlays, such as R.R. Donnelley’s USD 25 million Georgia upgrade, illustrate the scale converters commit to gain throughput and variable-data flexibility. Hybrid lines integrating inkjet and flexo towers streamline changeovers yet create operator-skill gaps that industry groups like the Flexographic Technical Association address through FIRST 5.0 curricula. As high-speed digital productivity converges with analog economics, the print label market will migrate toward mixed-technology production cells that compress lead times and inventory.
Brand-Owner Shift Toward Linerless Labels for Waste Reduction
Eliminating release liners cuts label waste up to 30% and boosts roll density, generating logistics savings that resonate with sustainability scorecards.[1] Market leaders report double-digit linerless revenue growth, especially within food retail, where Extended Producer Responsibility fees spur adoption. Transition barriers include specialized applicators and adhesive formulations that must perform across humidity swings, but suppliers are scaling capacity. UPM Raflatac reported 13% quarter-on-quarter growth in Q1 2025, partly on European linerless demand. Converter competitiveness hinges on mastering new coating and slitting techniques that diverge from conventional pressure-sensitive workflows.
E-Commerce Expansion Driving Variable-Data Printing Demand
U.S. Postal Service automation rules effective February 2025 compel shippers to employ machine-readable labels, accelerating variable-data volumes for tracking and returns. Software consolidation Seagull’s merger with Mojix supports more than 100 billion labels annually, signaling infrastructure scale behind omnichannel fulfillment. NIST’s Uniform E-commerce Regulation standardizes label data elements, pushing converters to integrate real-time serialization capabilities. As parcel traffic rises, digital print modules embedded in finishing lines let converters personalize content regionally without extra makeready, strengthening the print label market against direct-to-package alternatives.
Regulatory Traceability Requirements Accelerating Smart-Label Adoption
The U.S. DSCSA and EU FMD mandate item-level serialization, driving demand for 2D codes and RFID-enabled identifiers on every pharmaceutical pack. Smart labels capture EPCIS events to authenticate products and combat counterfeits, creating multi-year technology replacement cycles. Avery Dennison targets 15% organic growth in RFID tags as retailers expand use cases beyond apparel into food and logistics. High-memory inlays and cloud platforms converge, positioning converters that master electronics integration to secure premium margins within the print label market.
Restraints Impact Analysis of Print Label Market*
| Restraint | (~) % Impact on CAGR Forecast | Geographic Relevance | Impact Timeline |
|---|---|---|---|
| Volatile paper, film and adhesive prices squeezing converter margins | -0.4% | Global, most severe in North America and Europe | Short term (≤ 2 years) |
| Skill-gap in operating hybrid digital–flexo presses among SME converters | -0.3% | Global, particularly acute in Asia-Pacific SME sector | Medium term (2-4 years) |
| Rising brand-owner preference for direct-to-package digital printing (no label) | -0.2% | North America and Europe, emerging in Asia-Pacific | Long term (≥ 4 years) |
| Difficult recycling of multi-layer shrink and in-mold labels in circular-economy markets | -0.2% | Europe and North America, expanding to Asia-Pacific | Medium term (2-4 years) |
| Source: Mordor Intelligence | |||
Raw Material Price Volatility Pressuring Converter Margins
Paper pulp, PET, and acrylic adhesive indices have swung by double digits since 2024, leaving converters exposed because materials account for up to 75% of cost of sales. While global players leverage hedging and scale, Avery Dennison reported a 0.1% sales dip yet preserved EBIT via cost controls, SME converters struggle to pass surcharges to brand owners under annual contracts. Consolidators such as Sonoco channel USD 30 million into adhesive capacity expansions to secure supply and dilute input swings.[2] Until substrate markets stabilize, margin compression will temper investment appetite among smaller firms in the print label market.
Technical Skill Gaps in Hybrid Digital-Flexo Operations
OECD analysis confirms SMEs lag in digital upskilling, hampering the adoption of integrated press lines that demand ICC-based color management and variable-data RIP expertise. FIRST 5.0 underscores cross-functional communication between design and press crews, yet many converters lack certified trainers. Brady Corporation’s USD 67.7 million R&D spend highlights talent intensity associated with next-gen labeling solutions. Without structured apprenticeships, waste rates and rework can erode the modest gains digital presses promise, restraining overall print label market efficiency.
*Our forecasts treat driver/restraint impacts as directional, not additive. The impact forecasts reflect baseline growth, mix effects, and variable interactions.
Print Label Market Segment Analysis
By Print Process:
Digital Inkjet Disrupts Traditional FlexographyInkjet technology’s 5.3% CAGR underscores its role in reshaping the print label market. Flexography still produces the bulk of long-run SKUs thanks to mature platemaking ecosystems, but inkjet’s substrate versatility and 1-click changeovers let converters secure high-margin micro-runs for promotional campaigns. The print label market size associated with inkjet presses is forecast to grow steadily as equipment costs fall and white ink opacity rivals screen-print quality. Across converters, hybrid architectures that bolt inkjet bars onto flexo lines dominate capex roadmaps, enabling variable data without abandoning proven analog die-cutting workflows.
AstroNova’s TrojanLabel platform, launched at Drupa 2024, typifies the mid-web category aimed at craft beverage and cosmetics converters seeking near-offset registration with minimal setup. Gravure’s niche in ultra-long runs remains secure for large beverage co-packers, yet offset lithography’s footprint narrows as UV-inkjet delivers comparable Pantone coverage. Screen technology survives in electronics durables where film thickness is critical, but its share within the print label market will continue to erode.

By Label Format:
Pressure-Sensitive Dominance Challenged by Linerless InnovationPressure-sensitive constructions own 43.62% of 2025 volume, benefiting from established dispensing lines and multi-layer constructions that incorporate RFID or NFC inlays. The print label market share for linerless, while low today, is accelerating as brand owners quantify landfill avoidance and logistics savings. Wet-glue labels retain beverage strongholds in Europe due to heritage glass bottling infrastructure, yet retrofitting plants to PSA or shrink-sleeve solutions is gaining traction among new canning facilities.
Intelligent pressure-sensitives under Avery Dennison’s portfolio show 20% growth, demonstrating appetite for dual-frequency RFID tags that marry supply-chain visibility with consumer engagement. Shrink sleeves confront recycling scrutiny because multilayer PET-G structures hinder bottle-to-bottle loops; innovations such as Siegwerk’s washable cPET sleeve inks aim to mitigate these concerns.
By End-User Industry:
Food Sector Leadership Faces E-Commerce ChallengeFood manufacturers’ regulatory labeling obligations keep the segment atop revenue rankings, yet e-commerce shipping labels represent the fastest-growing slice of the print label market. Parcel operators now mandate scannable codes resilient to abrasion and condensation, pushing demand for topcoated thermal blanks and durable inks. Beverage labels require scuff resistance and premium finishes sparkling wines, RTDs, and hard seltzers all leverage tactile embellishments, driving higher unit prices. Pharmaceuticals lean on robust security features, including tamper-evident cuts, color-shift inks, and serialized 2D codes compliant with DSCSA, adding complexity and margin potential.
Cosmetics rely on small-format labels that withstand oils and offer high chroma for brand storytelling; the segment benefits from digital micro-runs aligned to influencer collaborations. Digital printing technologies are increasingly used in industrial labels, enabling flexible production for regional SKUs, seasonal promotions, and shorter print runs. Industrial and automotive labels call for UL-recognized adhesives and high-heat films, ensuring traceability across extended product lifecycles. Logistics and e-commerce will keep outpacing GDP as consumers habituate to same-day delivery norms, cementing variable-data printing as an engine of print label market expansion.
Geography Analysis
APAC Print Label Market
Asia-Pacific dominated the print label market in 2025 with a 35.86% share and is projected to post the highest 4.63% CAGR to 2031. China’s extensive manufacturing base and India’s packaging expansion valued at USD 204.81 billion for 2025 underpin regional momentum. Local converters invest in mid-web digital presses to handle proliferating consumer brands, while government recycling mandates in Japan and South Korea encourage adoption of recyclable facestock and wash-off inks. Southeast Asian nations pivot toward e-commerce fulfillment hubs, stimulating demand for thermal shipping labels and QR-based return tags.
North America Print Label Market
North America remains a technology bellwether, with rapid uptake of cloud-connected RFID labels driven by big-box retail mandates. Margin pressures from resin deflation challenged revenue in 2024, yet converters offset headwinds via automation and high-value applications. The region’s pharma serialization deadline of November 2024 spurred hardware upgrades across U.S. plants, reinforcing smart-label penetration within the print label market.
Europe Print Label Market
Europe combines mature demand with stringent circular-economy rules. Extended Producer Responsibility fees in France and Germany favor linerless and mono-material constructions. The UK’s Essential Requirements Regulations guide downgauging and recyclability, stimulating R&D into solvent-free adhesives. Eastern European converters attract contract manufacturing for pan-EU brands seeking cost efficiency without sacrificing regulatory compliance.
LATAM and MEA Print Label Market
Latin America, the Middle East, and Africa account for smaller but rising contributions. Brazil and Mexico scale capacity for beverage shrink sleeves, while Gulf Cooperation Council members diversify into packaged foods, importing technical know-how alongside capital equipment. African markets grapple with trade barriers and infrastructure constraints, yet mobile commerce growth signals long-term potential for variable-data label solutions.
Regulatory Landscape
Regulatory requirements for print labels are being shaped by expanding traceability mandates and packaging waste policy, which increasingly specify both the data carried on labels for track-and-trace and how packaging must be identified for collection and recycling. In pharmaceuticals, item-level serialization requirements such as the U.S. DSCSA and EU FMD continue to drive adoption of 2D codes and smart identifiers on labels, pushing converters toward variable-data capable workflows and tighter quality controls.
In Europe, Regulation (EU) 2025/40 (Packaging and Packaging Waste Regulation, PPWR) entered into force on 11 February 2025 and applies from 12 August 2026, adding new compliance obligations that flow into label design and production. The PPWR establishes a harmonized labeling system based on material composition using pictograms, with implementation tied to 12 August 2028 or 24 months from adoption of implementing acts (whichever is later), while legacy identification under Commission Decision 97/129/EC remains valid until 12 August 2028. The PPWR also introduces conformity assessment and documentation requirements for packaging placed on the EU market, increasing the importance of supplier declarations, technical documentation retention, and harmonized approaches to on-pack information for multinational brand owners.
Value Chain Analysis
The print label value chain starts with raw materials (paper and film facestocks, release liners, pressure-sensitive and wet-glue adhesives, inks and coatings), then moves through prepress and consumables (plates, anilox rolls, digital RIP/workflow software), label conversion and printing (flexography, gravure, offset, screen, electrophotography, and inkjet), and finishing (die-cutting, slitting, embellishment, inspection) before delivery to brand owners and co-packers.
The chain is increasingly data-enabled as converters integrate serialization, RFID/NFC inlays, and barcode/QR generation to meet regulatory traceability and retail and logistics scanning requirements. Converter economics are highly sensitive to input availability and price movements, since substrates and adhesives dominate cost of sales, making procurement scale and dual sourcing key differentiators. Downstream, distribution splits between direct supply to large CPG and pharma accounts and channel-driven fulfillment for logistics and e-commerce labels, where data accuracy and service levels drive tighter integration with customer IT and warehouse operations.
Competitive Landscape
The print label market exhibits moderate consolidation: the top five suppliers control roughly 50% of global revenue, granting them procurement leverage and R&D scale. CCL Industries executed nine acquisitions since January 2023, lifting 2024 sales to USD 7.245 billion and strengthening its automation and RFID capabilities. Avery Dennison’s EUR 60 million (USD 64 million) European expansion adds Industry 4.0 adhesive coaters that raise throughput and lower waste, illustrating how incumbents protect margins through technology investments.
Multi-Color Corporation leverages a global gravure plant network to service premium beverage and personal-care customers, while emerging challengers target digital-first niches. M&A activity is forecast to continue as converters pursue geographic fill-ins and specialty coatings know-how. Patent filings for multi-view beverage label assemblies and antimicrobial coatings signal ongoing innovation pipelines. Competitive advantage increasingly rests on integrating software, automation, and sustainability credentials to satisfy brand and regulatory stakeholders.
Print Label Industry Leaders
-
CCL Industries Inc.
-
Avery Dennison Corporation
-
Multi-Color Corporation
-
Fuji Seal International, Inc.
-
Huhtamaki Oyj
- *Disclaimer: Major Players sorted in no particular order
Print Label Market Companies Covered in this Report
- CCL Industries Inc.
- Avery Dennison Corporation
- Multi-Color Corporation
- Fuji Seal International, Inc.
- Mondi plc
- Huhtamaki Oyj
- 3M Company
- Brady Corporation
- Ahlstrom-Munksjo Oyj
- Autajon Group
- Taghleef Industries LLC
- Ravenwood Packaging Ltd.
- SATO Holdings Corporation
- Taylor Corporation
- Weber Packaging Solutions, Inc.
- Resource Label Group, LLC
- Advanced Labelworx, Inc.
- Alliance Prints USA, Inc.
- Clarion Safety Systems, LLC
Market Opportunities and Future Outlook
Compliance-driven packaging identification creates whitespace for converters and material suppliers that can translate new rules into scalable, production-ready label architectures. Regulation (EU) 2025/40 (PPWR), applying from 12 August 2026, introduces harmonized packaging labeling based on material composition pictograms and broader conformity and documentation obligations. This is lifting demand for standardized multi-market label content management and faster artwork and version control across SKUs, particularly where brand owners need consistent on-pack information.
Material and process shifts tied to waste reduction also open near-term capacity and product development pockets, especially linerless and mono-material constructions that reduce disposal burdens and logistics costs. Converter investments cited for 2026, such as Saica Flex investing in an automatic coating machine at its Deeside facility to support linerless label production and Royal Geostick adding a 12-color BOBST MASTER M5 flexo press for higher-throughput multilayer labels, point to spend concentrating on coating and adhesive know-how, speed-focused inspection, and higher-complexity constructions that carry more regulatory and traceability content per unit. Demand is moving toward capabilities that fuse print with identification, including RFID/NFC and serialization for food, logistics, and pharmaceuticals, expanding the serviceable scope for converters that can support compliant print and reliable data capture within a single production workflow.
Recent Industry Developments in Print Label Market
- March 2026: BASF and Avery Dennison announced a collaboration to commercialize butyl acrylate RE and 2-ethylhexyl acrylate RE produced at BASF's Freeport, Texas site using renewable electricity. The collaboration supports lower-footprint adhesive raw materials for pressure-sensitive label constructions, aligning converter material choices with customer sustainability and compliance scorecards.
- June 2025: The Georgia facility upgrade at RR Donnelley expands short-run and variable-data capacity, with HP Indigo 120K and PageWide Advantage 2200 presses installed and autonomous robots deployed. The additional capacity supports SKU proliferation workflows and e-commerce labeling.
- December 2024: Multi-Color Corporation acquired Eximpro, a Mexico-based shrink sleeve label manufacturer. The deal broadens MCC's shrink-sleeve footprint in North America, improves proximity to regional beverage and consumer goods customers, and adds specialty conversion capability.
Print Label Market Report Scope and Research Methodology
Market Definition and Coverage
For this study, the print label market covers printed labels applied to products and packs for identification, compliance, tracking, and branding. The market value reflects converter and printer revenues tied to producing these labels across major print processes and label formats.
Scope exclusions: It excludes packaging structures where labeling is not a separate printed label, and it also excludes downstream retail markups and redistribution margins.
Segments Covered in This Report
- By Print Process
- Offset Lithography
- Gravure
- Flexography
- Screen
- Letterpress
- Electrophotography
- Inkjet
- By Label Format
- Wet-Glue Labels
- Pressure-Sensitive Labels
- Linerless Labels
- Multi-Part Tracking Labels
- In-Mold Labels
- Shrink and Stretch Sleeves
- By End-User Industry
- Food
- Beverage
- Healthcare and Pharmaceuticals
- Cosmetics and Personal Care
- Household Cleaning
- Industrial and Automotive
- Logistics and E-commerce
- Electronics and Appliances
- By Geography
- North America
- United States
- Canada
- Mexico
- South America
- Brazil
- Argentina
- Rest of South America
- Europe
- United Kingdom
- Germany
- France
- Italy
- Spain
- Russia
- Rest of Europe
- Asia Pacific
- China
- Japan
- India
- South Korea
- Australia
- Rest of Asia Pacific
- Middle East and Africa
- Middle East
- United Arab Emirates
- Saudi Arabia
- Turkey
- Rest of Middle East
- Africa
- South Africa
- Nigeria
- Rest of Africa
- Middle East
- North America
Data Sources, Market Sizing, and Validation
Desk Research
Desk work was used to map the demand pool and the operating context for printed labels before any modeling was finalized. We referenced public sources such as UN Comtrade for trade signals tied to label stock and related inputs, USITC and EU trade statistics for tariff and cross-border movement context, and official guidance such as the US FDA and the European Commission on food and healthcare labeling requirements, which shape minimum label content.
To keep assumptions grounded, we reviewed company annual reports, investor presentations, and association websites for capacity notes, price pass-through language, and technology shifts (for example, digital versus conventional print). A paid company financials and intelligence subscription and a paid patent database were also used to cross-check revenue splits, M&A footprints, and the pace of printing technology filings. The desk sources named here are illustrative, and other public and paid references were used to collect, validate, and clarify data points.
Primary Interviews and Surveys
Primary interviews and surveys were used to validate conversion economics and how label demand tracks end-use production, especially where public disclosures are limited. We spoke with stakeholders across label converting, material supply, printing equipment, brand owners, and packaging procurement, and then aligned feedback across APAC, EMEA, and the Americas so regional mixes and pricing behavior could be sanity-checked.
Distribution of primary research fieldwork respondents
| Company type | Respondent position | Region |
|---|---|---|
| Top tier: 35% | CXOs: 14% | APAC: 44% |
| Mid tier: 50% | Functional/Unit leaders: 29% | EMEA: 29% |
| Smaller Players: 15% | Managers: 57% | Americas: 27% |
Market-Sizing & Forecasting
Sizing starts from a top-down build that reconstructs label demand from end-use output and packaging activity, and then converts that demand into value using observed price ranges. In practice, we linked label consumption to indicators such as packaged food and beverage production, pharmaceutical packaging volumes (including serialization-driven label content changes), retail and logistics labeling intensity tied to e-commerce shipment growth, and the mix shift across label formats like pressure-sensitive, wet-glue, linerless, and sleeves.
Once the global total was formed, selective bottom-up approximations were used to confirm the order of magnitude and adjust outliers, including sampled converter revenue roll-ups by region, capacity utilization channel checks, and simple ASP times volume tests for common label types. When disclosures did not break out print labels cleanly, gaps were handled using application mix proxies and verified ranges from interviews, and then the split was re-tested against regional demand signals.
For forecasting, scenario analysis was used so growth could be flexed around the variables that move this market, such as packaged goods output, regulatory labeling content changes, substrate cost pass-through timing, and the adoption pace of digital printing for short runs. The final path was selected after cross-checking scenarios with expert consensus from primary respondents on what is achievable over the next five years.
Data Validation & Update Cycle
Validation is done through repeated checks at each modeling layer so unusual jumps are caught early rather than explained later. We compare derived market totals against independent signals such as print capacity announcements, regional packaging demand direction, and implied label spend per unit in key end-use sectors, then investigate and correct variances.
Before sign-off, the model goes through multi-step internal review where assumptions, units, and currency conversions are rechecked, followed by re-contact triggers when a key input shifts beyond the expected range. Reports are refreshed annually, with interim updates when a material event changes supply, demand, or pricing. Right before delivery, a final pass is completed so the numbers and narrative reflect the latest available information.
Mordor Intelligence's Global Print Label Market Market Size Compared With Other Published Estimates
Published market sizes for print labels often differ because each publisher draws the line differently on what counts as a label, what is treated as printing services, and how pricing is normalized across regions. Variance also shows up when one estimate is built from end-use packaging demand, while another is built from printer revenues or from a narrower packaging-only lens.
Some estimates include label printing services beyond printed labels on products, and others narrow scope to printed packaging labels while using constant-price assumptions. That approach can compress value growth when inflation is high. The main gap comes from whether non-label printing revenues and adjacent printed identifiers are counted, where Mordor Intelligence counts only printed labels across defined label formats and print processes and does not inflate the total by adding broader printing service categories.
Benchmark comparison
| Source | Market Size | Gaps in Research Methodology |
|---|---|---|
| Mordor Intelligence | USD 57.05 B (2026) | |
| Trade Journal A | USD 44.80 B (2024) | Uses a printed packaging labels scope and reports value at constant prices, which can exclude some non-packaging label demand and also dampen the measured value trend versus current-price models. |
| Global Consultancy B | USD 51.64 B (2025) | Frames the market as label printing revenue, which can pull in broader printing service definitions and different inclusion rules across applications, making it less comparable to a label-output based market total. |
Taken together, the spread is mainly explained by scope (packaging labels versus broader print labels) and by pricing treatment (constant prices versus current values), followed by how printing revenues are mapped back to label output. By keeping inputs tied to clear demand indicators and then checking them with supplier and capacity signals, the estimate stays traceable and easier to reproduce when assumptions need updating.
Key Questions Answered in the Report
What is the projected value of the print label market in 2031?
The print label market is expected to reach USD 67.02 billion in 2031 at a 3.28% CAGR.
Which print process is growing fastest within labeling applications?
Inkjet printing leads growth with a 5.3% CAGR through 2031 as converters pursue short-run and variable-data jobs.
Why are linerless labels gaining traction?
They eliminate release liners, cutting up to 30% of label waste and improving roll density for logistics savings.
How are regulations influencing smart-label adoption?
U.S. DSCSA and EU FMD require item-level serialization, driving demand for 2D-code and RFID-enabled labels across pharma and food.
What region commands the largest share of label demand?
Asia-Pacific holds 35.86% of global demand and remains the fastest-expanding geography through 2031.
Which companies dominate the competitive landscape?
CCL Industries, Avery Dennison, and Multi-Color Corporation together account for more than 30% of global label revenue.