Print And Apply Labeling And Labeling Equipment Market Size and Share
Market Overview
| Study Period | 2020 - 2031 |
|---|---|
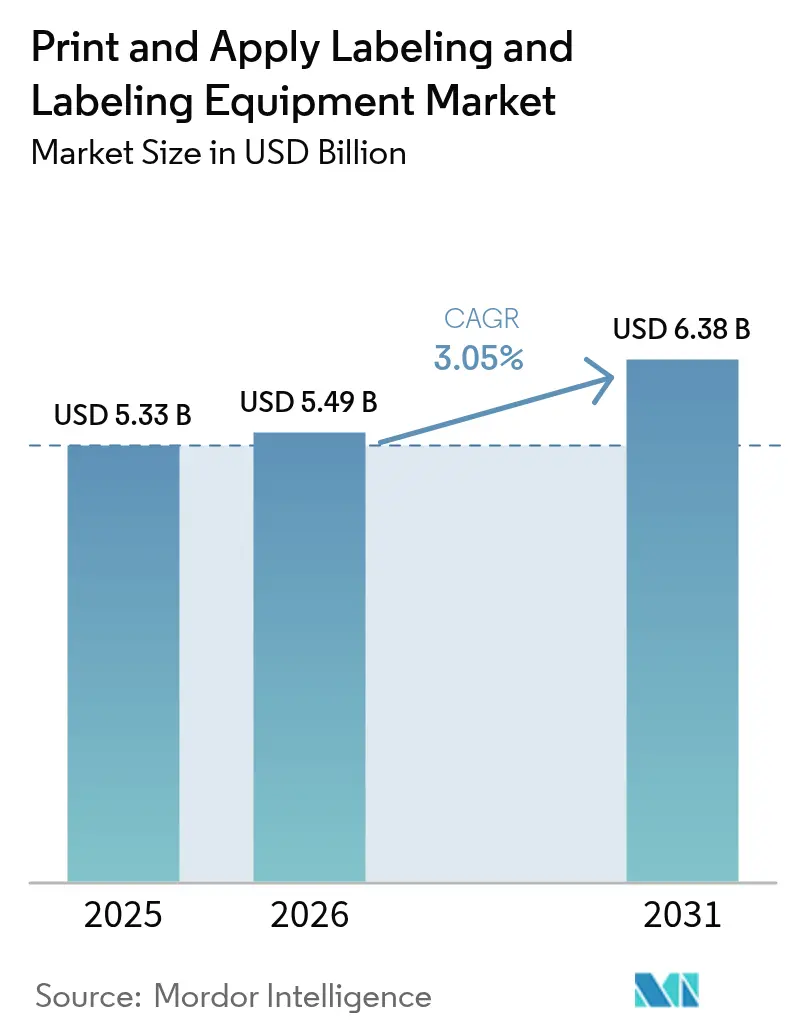
| Market Size (2026) | USD 5.49 Billion |
| Market Size (2031) | USD 6.38 Billion |
| Growth Rate (2026 - 2031) | 3.05% CAGR |
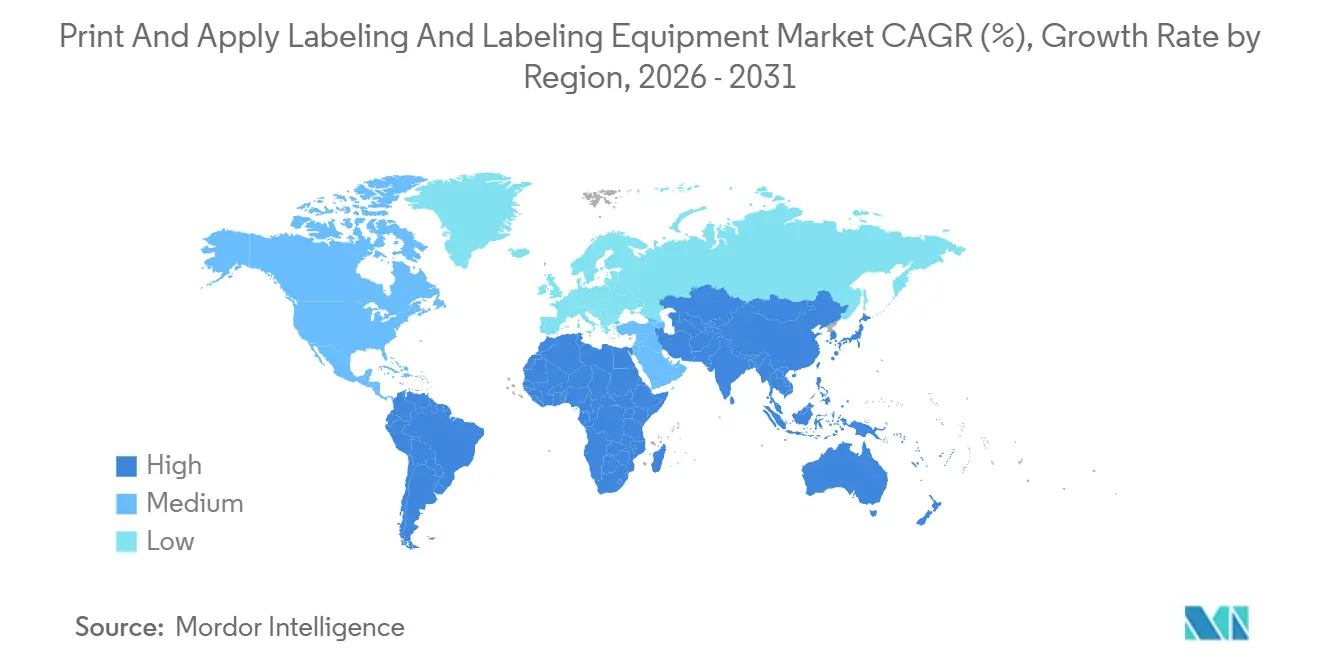
| Fastest Growing Market | Asia Pacific |
| Largest Market | Asia Pacific |
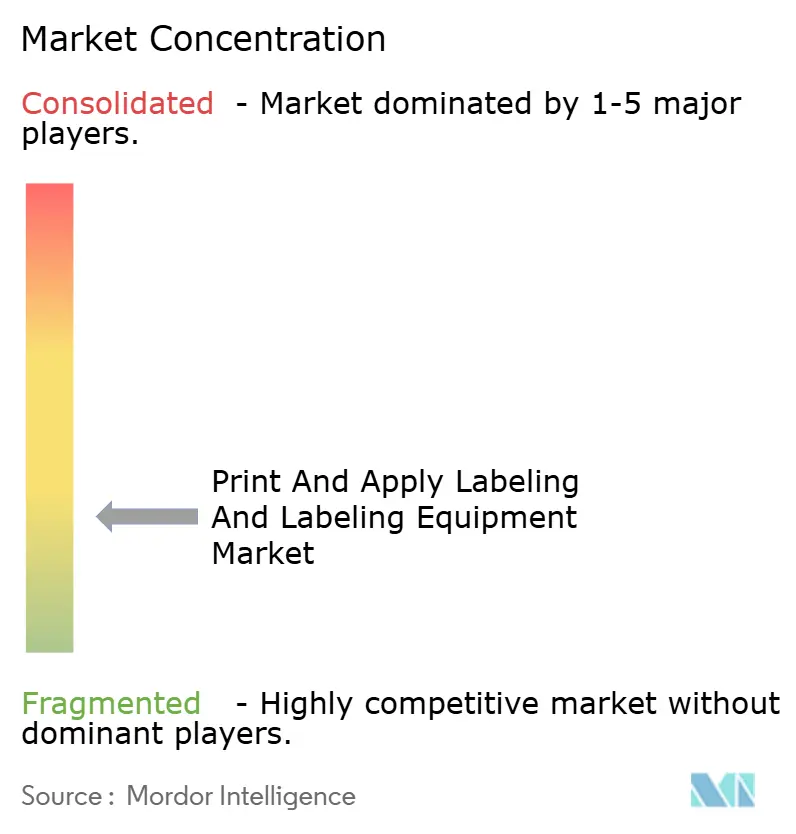
| Market Concentration | Low |
Major Players *Disclaimer: Major Players sorted in no particular order Image © Mordor Intelligence. Reuse requires attribution under CC BY 4.0. | |
Print And Apply Labeling And Labeling Equipment Market Analysis by Mordor Intelligence
The print and apply labeling and labeling equipment market size is projected to be USD 5.33 billion in 2025, USD 5.49 billion in 2026, and reach USD 6.38 billion by 2031, growing at a CAGR of 3.05% from 2026 to 2031. Demand is anchored in high-speed food and beverage packaging, pharmaceutical serialization programs, and e-commerce fulfillment workflows that favor on-demand variable data printing. Edge-AI defect detection is shortening changeover windows while digital inkjet modules deliver lot-size-of-one economics, encouraging brand owners to run short promotional campaigns without holding weeks of pre-printed inventory. Asia-Pacific remains the volume growth engine as China’s parcel throughput and India’s RFID investments translate into factory-floor automation budgets, whereas North America and Europe continue to target sustainability and traceability mandates that reward fully automatic systems with integrated vision inspection. Competitive rivalry is moderate: five global OEMs still control nearly half of installed capacity, yet price-aggressive Chinese integrators are scaling modular cells that undercut Western list prices by up to 40%, forcing incumbents to lean on IoT-enabled service contracts for margin defense.
Key Report Takeaways
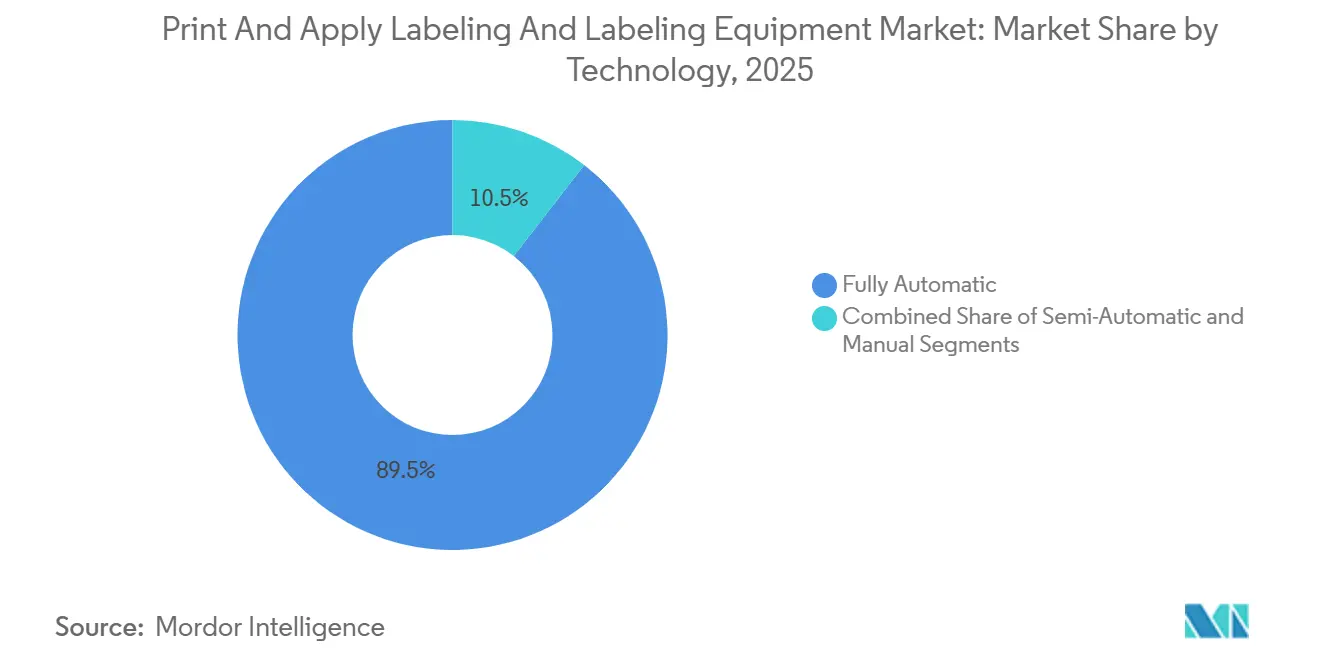
- By technology, fully automatic systems held 89.51% of revenue in 2025 and is projected to grow at a 4.51% CAGR between 2026 and 2031.
- By label type, pressure-sensitive formats accounted for 43.68% of the market in 2025. Smart-label RFID and QR solutions are forecast to register a 4.63% CAGR through 2031.
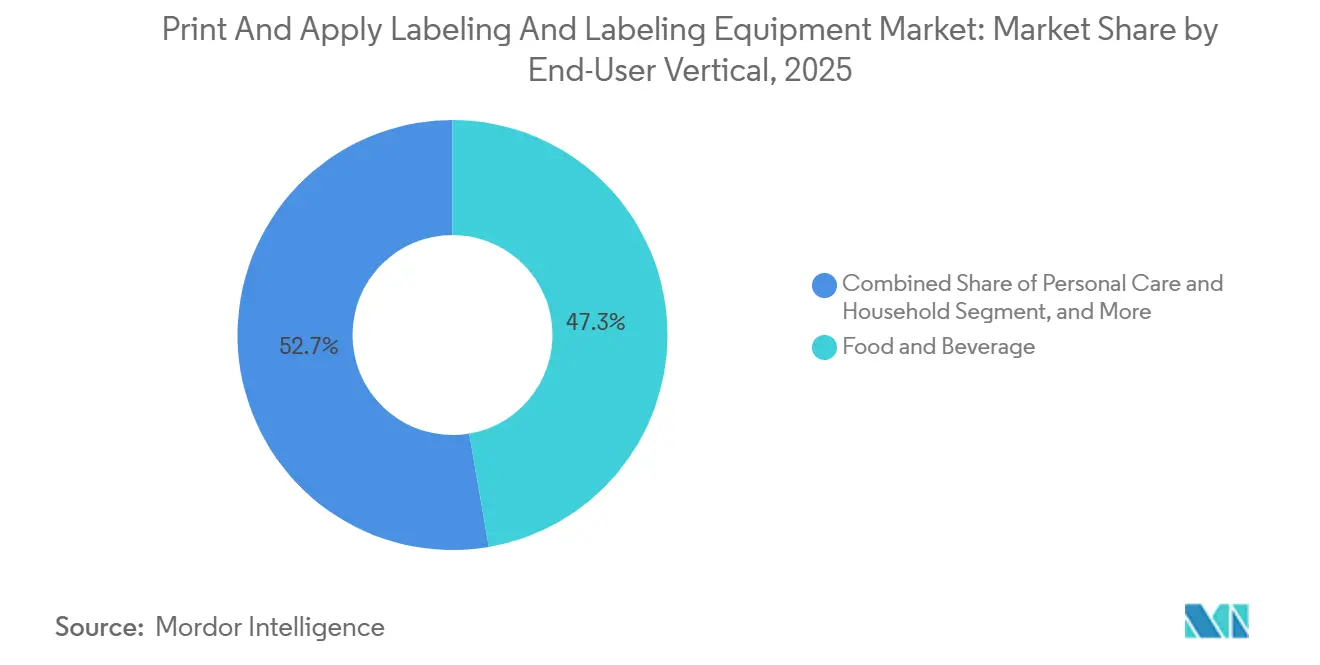
- By end-user vertical, food and beverage led with 47.31% revenue share in 2025. Personal care and household labeling is expected to expand at a 4.87% CAGR over 2026-2031.
- By geography, Asia-Pacific accounted for 37.89% of global revenue in 2025 and is anticipated to record a 4.92% CAGR through 2031.
Note: Market size and forecast figures in this report are generated using Mordor Intelligence’s proprietary estimation framework, updated with the latest available data and insights as of 2026.
Global Print And Apply Labeling And Labeling Equipment Market Trends and Insights
Drivers Impact Analysis*
| Driver | (~) % Impact on CAGR Forecast | Geographic Relevance | Impact Timeline |
|---|---|---|---|
| Evolution of Digital Printing and Fully-Automatic Applicators | +1.2% | Global, with early adoption in North America and Europe; rapid uptake in Asia-Pacific manufacturing hubs | Medium term (2-4 years) |
| Stringent Trace-and-Trace and Serialization Mandates | +0.9% | North America and Europe (FDA, EU FMD compliance); expanding to Middle East and South America | Short term (≤ 2 years) |
| Automation Demand in Food and Beverage High-Speed Packaging Lines | +0.8% | Global, concentrated in Asia-Pacific beverage corridors and European dairy clusters | Medium term (2-4 years) |
| E-Commerce Cold-Chain Dual-Temperature Label Needs | +0.6% | North America and Europe e-commerce fulfillment networks; emerging in Asia-Pacific urban centers | Short term (≤ 2 years) |
| Sustainability Push Toward Liner-Less Label Formats | +0.5% | Europe (PPWR compliance), North America (retailer mandates); pilot projects in Asia-Pacific | Long term (≥ 4 years) |
| IoT-Edge Predictive Maintenance for Labeling Lines | +0.4% | North America and Europe Industry 4.0 facilities; gradual adoption in Asia-Pacific and Middle East | Medium term (2-4 years) |
| Source: Mordor Intelligence | |||
Evolution Of Digital Printing And Fully Automatic Applicators
Digital inkjet and UV-LED modules now rival flexography on speed while eliminating plates, enabling beverage co-packers to slash label inventory from twelve weeks to three days and unlock working-capital savings. Domino’s Dx1060i laser coder, released in November 2025, prints 200 meters per minute on corrugated and frozen seafood cartons while cutting energy use by 40%.[1]Domino Printing Sciences, “Domino Launches Dx1060i Laser Coder,” domino-printing.com Konica Minolta’s AccurioLabel 400 adds inline spectrophotometry, keeping color drift within 0.5 Delta-E for brands juggling hundreds of SKUs. Servo-guided applicators equipped with vision systems compensate for carton misalignment and drive defect rates below 0.05%, a metric validated by Erdinger Weissbräu’s January 2026 installation of AI-enabled print engines. Together, high-resolution printheads and closed-loop robotics move the print and apply labeling and labeling equipment market toward lights-out production and lot-size-of-one personalization.
Stringent Trace And Trace And Serialization Mandates
The U.S. Drug Supply Chain Security Act requires unit-level 2D DataMatrix coding by November 2024, converting print-and-apply stations into compliance assets rather than post-printing niceties. In Europe, Falsified Medicines Directive rules plus tamper-evident seals have already shifted procurement toward combination shrink-sleeve and inkjet serialization modules. ForgeStop’s January 2026 NFC-enabled label merges serialization with temperature tracking to combat USD 35 billion of annual cold-chain spoilage. Brazil and Saudi Arabia are phasing in parallel mandates that extend addressable demand across emerging regions. These requirements explain why serialization-ready platforms command premium pricing yet still outgrow legacy semi-automatic lines in the print and apply labeling and labeling equipment market.
Automation Demand In Food And Beverage High-Speed Packaging Lines
Lines running 600 units per minute cannot afford manual interventions. KHS upgraded its Innoket Neo Flex in September 2025, trimming changeover time from 45 minutes to eight and earning rapid payback for dairy co-packers juggling 15 SKU rotations per shift.[2]KHS GmbH, “Innoket Neo Flex Labeling Platform Enhancements,” khs.com Krones’ Flectra labeler maintains ±0.5 millimeter accuracy at 72,000 bottles per hour, meeting zero-defect tolerances for premium spirits. Vision-integrated applicators also flag missing allergen panels, preventing the type of mislabeling that triggered 47 U.S. FDA recalls in 2024. Cost models show a EUR 180,000 (USD 193,000) robotic upgrade paying for itself in under two years through labor and scrap savings, further cementing food and beverage as the largest contributor to the print and apply labeling and labeling equipment market.
E-Commerce Cold-Chain Dual-Temperature Label Needs
Direct-to-consumer grocery and biologic shipments experience thermal swings from -20 °C storage to +35 °C courier vans. IATA’s January 2025 guidance now mandates color-change indicators for parcels exceeding 48 hours in transit.[3]IATA, “Time and Temperature Sensitive Label Guidance Update,” iata.org Avery Dennison’s February 2026 partnership with Pragmatic Semiconductor embeds flexible NFC chips in pressure-sensitive labels, enabling geolocation and temperature logging without batteries. Weber Packaging’s Alpha HSM effortlessly toggles between cold-chain synthetics and kraft paper, minimizing downtime at omnichannel hubs. As cold-chain volumes grow at an estimated 18% CAGR to 2030, demand for dual-performance labels will lift the print and apply labeling and labeling equipment market well above baseline growth.
Restraints Impact Analysis*
| Restraint | (~) % Impact on CAGR Forecast | Geographic Relevance | Impact Timeline |
|---|---|---|---|
| Cap-Ex Intensity of High-Speed Print-and-Apply Systems | -0.7% | Global, acute in South America and Africa where SME access to equipment financing is limited | Short term (≤ 2 years) |
| Durability Issues in Extreme Humidity and Freezer Tunnels | -0.4% | Tropical Asia-Pacific, Middle East, and cold-chain corridors in North America and Europe | Medium term (2-4 years) |
| Shortage of Integration and Maintenance Technicians | -0.6% | North America and Europe; emerging in Asia-Pacific as automation adoption accelerates | Medium term (2-4 years) |
| RFID Inlay Supply Volatility Inflating Raw-Material Cost | -0.3% | Global, concentrated in retail and logistics verticals dependent on smart-label rollouts | Short term (≤ 2 years) |
| Source: Mordor Intelligence | |||
Cap-Ex Intensity Of High-Speed Print-And-Apply Systems
Next-generation lines integrating dual-sided coding, vision inspection, and database serialization cost USD 250,000-500,000, pushing payback horizons beyond the comfort level of small and medium enterprises. North American surveys in 2025 showed 62% of contract packagers delaying automation, instead adding shifts to legacy gear. Leasing options have emerged in Europe, yet double-digit interest rates in South America and Africa keep utilization low. Rapid obsolescence compounds the risk, as printhead resolution doubled between 2023 and 2025. Unless equipment-as-a-service models proliferate globally, capital intensity will continue to shave growth points from the print and apply labeling and labeling equipment market.
Shortage Of Integration And Maintenance Technicians
Ninety-five percent of North American plants report difficulty hiring specialists able to align servo axes, calibrate thermal heads, and tune vision cameras. Average technician age reached 52 in 2024, and retirements outpace vocational graduation three to one. OMRON’s Bengaluru Automation Center opened in October 2025 with mixed-reality labs that cut training cycles, yet the talent pipeline remains thin. OEM responses include AI front-ends that automate 80% of setup tasks, as Domino demonstrated with its Sunrise software in August 2025. Until workforce gaps close, deployment schedules will slip, marginally restraining the print-and-apply labeling equipment market.
*Our forecasts treat driver/restraint impacts as directional, not additive. The impact forecasts reflect baseline growth, mix effects, and variable interactions.
Segment Analysis
By Technology: Servo Precision Drives Fully Automatic Dominance
Fully automatic platforms captured 89.51% share of the print and apply labeling and labeling equipment market in 2025 and are projected to advance at a 4.51% CAGR to 2031. These systems replace operator intervention with closed-loop robotics, trimming labor cost per unit by up to 70%. At Erdinger Weissbräu, AI-guided print engines pushed defect rates below 0.05% after a January 2026 retrofit. Semi-automatic equipment still fits co-packing sites handling frequent SKU swaps, while manual stations linger in artisanal food production and clinical trial labeling.
Interest in IoT connectivity widens the gulf. SATO’s July 2025 Thailand expansion added a line dedicated to sensor-rich, cloud-monitored machines that flag printhead wear before downtime occurs. Semi-automatic units now ship with touchscreen setup wizards, making training accessible during the technician shortage. Manual tools decline steadily as modular low-cost print-and-apply cells often below USD 30,000 enter the print and apply labeling and labeling equipment market, broadening automation access for micro-breweries and niche cosmetic brands.


By Label Type: Smart Labels Outpace Traditional Formats
Pressure-sensitive labels retained 43.68% of the print and apply labeling and labeling equipment market in 2025, yet RFID-enabled smart labels are advancing at a 4.63% CAGR through 2031. NXP’s UCODE X chip, introduced in February 2026, extends read range to 15 meters while dropping tag cost to USD 0.08, making item-level deployment economical for apparel. Shrink sleeves gain share in beverage and personal care thanks to 360-degree graphics and tamper evidence, while HERMA’s InNo-Liner platform removes silicone liners entirely and cuts adhesive waste by 40%.
Hybrid capability is a rising differentiator. Weber’s Model 4050 allows hot-swap changeovers between linerless rolls and conventional pressure-sensitives, maximizing uptime at e-commerce fulfillment centers. With regulatory pressure steering Europe toward recyclability targets for 2030, linerless labels will widen their footprint, adding momentum to the print and apply labeling and labeling equipment market size expansion.
By End-User Vertical: Personal Care Accelerates Past Food Dominance
Food and beverage lines accounted for 47.31% of 2025 revenue, reflecting around-the-clock bottling operations that prize uptime over flexibility. Yet personal care and household products are pacing the field with a 4.87% CAGR to 2031, spurred by clean-beauty brands installing tamper-evident sleeves on refillable containers. KHS’s Innoket Neo Flex cut changeovers to eight minutes in September 2025, a necessity for co-packers managing 15 daily SKU flips.
Pharmaceutical demand follows serialization timelines, drawing contract packagers toward systems that integrate cameras, reject stations, and database handshakes in a single frame. Industrial logistics also presents upside: Amazon’s 2025 directive that third-party sellers affix GS1-compliant RFID tags is driving pallet-tracking investments. Together, these dynamics reinforce diversified growth across verticals, sustaining volume for the print and apply labeling and labeling equipment market.
Geography Analysis
Asia-Pacific held 37.89% of 2025 revenue and is expected to expand at a 4.92% CAGR, underpinned by China’s 175 billion parcel throughput in 2024 and India’s RFID capacity build-outs. Avery Dennison’s USD 30 million Pune inlay plant, inaugurated in April 2025, can output 5 billion tags per year to satisfy surging omnichannel retail demand. OMRON’s Bengaluru Automation Center further addresses technician shortages that might otherwise bottleneck adoption.
North America and Europe grow near the global average of 3.05% yet focus on higher-margin fully automatic systems that comply with serialization and sustainability statutes. The European Commission’s Packaging and Packaging Waste Regulation sets a 15% packaging-reduction target by 2030, boosting linerless and digital print interest. In the United States, FDA traceability rules mean 40% of food lines require upgrades by 2027, feeding retrofit demand.
South America gains traction as Brazil phases pharmaceutical serialization in by 2027 and as foreign direct investment pours into automation. Daifuku’s USD 24 million Telangana facility, announced April 2025, underscores interest in the region’s logistics hubs. The Middle East and Africa remain nascent, yet Saudi Arabia’s 2024 serialization rules and United Arab Emirates air-cargo RFID projects foreshadow a lift in the print and apply labeling and labeling equipment market over the next five years.

Competitive Landscape
The print and apply labeling and labeling equipment market remains fragmented. Domino, Markem-Imaje, SATO, Avery Dennison, and Krones defend market share through IoT-enabled maintenance contracts and proprietary consumables that convert one-time cap-ex into predictable annuities. Chinese challengers such as Shenzhen Shuangcheng and Shanghai Precision Pack Tech price modular cells 30-40% below Western equivalents and promise six-week lead times, appealing to cost-focused mid-tier buyers.
Technology roadmaps emphasize predictive maintenance. OEMs now embed thermal, vibration, and print-quality sensors that feed cloud dashboards predicting printhead failure, reducing unplanned downtime from 8% to 2% and justifying premium list prices. Sidel’s CoboReel, launched June 2025, shrank floor-space needs by 60% via cobot actuation, giving contract packagers overnight reconfiguration capability for fast-turn campaigns.
Patent filings highlight innovation in smart label integration. NXP’s UCODE X RFID chip claims 40% lower power draw while extending read range to 15 meters. Meanwhile, GS1 Digital Link compliance is becoming a must-have; applicators lacking native encoding risk exclusion from retailer approved-vendor lists. Vertical integration also matters: Avery Dennison combines RFID inlay production with converting lines, allowing single-source supply that competitors must replicate through partnerships.
Print And Apply Labeling And Labeling Equipment Industry Leaders
SIDEL (Tetra Laval Group)
Krones AG
Sacmi Imola S.C.
KHS GmbH
Marchesini Group SpA
- *Disclaimer: Major Players sorted in no particular order

Recent Industry Developments
- February 2026: Avery Dennison partnered with Pragmatic Semiconductor to embed flexible NFC chips into pressure-sensitive labels, targeting a 2027 commercial rollout at sub-USD 0.15 tag cost.
- February 2026: NXP Semiconductors unveiled the UCODE X RFID chip with a 15-meter read range and 40% energy reduction, priced at USD 0.08 in 10-million-unit lots.
- January 2026: Domino Printing Sciences completed AI-guided print-engine installation at Erdinger Weissbräu, cutting defect rates to 0.05% and eliminating manual calibration.
- January 2026: ForgeStop introduced NFC smart labels combining temperature sensing and geolocation for pharmaceutical cold-chain compliance.


Global Print And Apply Labeling And Labeling Equipment Market Report Scope
The study takes into account the profits made from the sales of labeling equipment as well as from the sales of label printing and application equipment by various market vendors. Print and apply labeling and labeling equipment revenue (USD) is considered for the market size and forecasts. The market study factors the impact of COVID-19 on the print and apply labeling and labeling equipment markets based on the prevalent base scenarios, key themes, and end-user vertical-related demand cycles.
The Print and Apply Labeling and Labeling Equipment Market Report is Segmented by Technology (Fully Automatic, Semi-Automatic, and Manual), Label Type (Pressure-Sensitive, Shrink-Sleeve, Glue-Based, In-Mold, Linerless, and Smart-Label RFID and QR), End-User Vertical (Food and Beverage, Pharmaceutical, Personal Care and Household, Industrial and Logistics, and Other End-User Verticals), and Geography (North America, South America, Europe, Asia-Pacific, Middle East and Africa). The Market Forecasts are Provided in Terms of Value (USD).
| Fully Automatic |
| Semi-Automatic |
| Manual |
| Pressure-Sensitive / Self-Adhesive |
| Shrink-Sleeve |
| Glue-Based |
| In-Mold |
| Liner less Label Applicators |
| Smart-Label (RFID / QR) Systems |
| Food and Beverage |
| Pharmaceutical |
| Personal Care and Household |
| Industrial and Logistics |
| Others End-User Verticals |
| North America | United States | |
| Canada | ||
| Mexico | ||
| South America | Brazil | |
| Argentina | ||
| Chile | ||
| Rest of South America | ||
| Europe | Germany | |
| United Kingdom | ||
| France | ||
| Rest of Europe | ||
| Asia-Pacific | China | |
| Japan | ||
| India | ||
| South Korea | ||
| Australia | ||
| Rest of Asia-Pacific | ||
| Middle East and Africa | Middle East | Saudi Arabia |
| United Arab Emirates | ||
| Turkey | ||
| Rest of Middle East | ||
| Africa | South Africa | |
| Nigeria | ||
| Rest of Africa | ||
| By Technology | Fully Automatic | ||
| Semi-Automatic | |||
| Manual | |||
| By Label Type | Pressure-Sensitive / Self-Adhesive | ||
| Shrink-Sleeve | |||
| Glue-Based | |||
| In-Mold | |||
| Liner less Label Applicators | |||
| Smart-Label (RFID / QR) Systems | |||
| By End-User Vertical | Food and Beverage | ||
| Pharmaceutical | |||
| Personal Care and Household | |||
| Industrial and Logistics | |||
| Others End-User Verticals | |||
| By Geography | North America | United States | |
| Canada | |||
| Mexico | |||
| South America | Brazil | ||
| Argentina | |||
| Chile | |||
| Rest of South America | |||
| Europe | Germany | ||
| United Kingdom | |||
| France | |||
| Rest of Europe | |||
| Asia-Pacific | China | ||
| Japan | |||
| India | |||
| South Korea | |||
| Australia | |||
| Rest of Asia-Pacific | |||
| Middle East and Africa | Middle East | Saudi Arabia | |
| United Arab Emirates | |||
| Turkey | |||
| Rest of Middle East | |||
| Africa | South Africa | ||
| Nigeria | |||
| Rest of Africa | |||


Key Questions Answered in the Report
How fast is the print and apply labeling and labeling equipment market expected to grow through 2031?
It is projected to rise from USD 5.49 billion in 2026 to USD 6.38 billion by 2031, reflecting a 3.05% CAGR.
Which technology segment leads current demand?
Fully automatic systems dominate with an 89.51% share in 2025 and remain the fastest-growing option due to serialization and high-speed food packaging needs.
What is driving adoption of smart labels over pressure-sensitive formats?
Retailer mandates for item-level visibility and the February 2026 launch of NXP’s cost-efficient UCODE X RFID chip are accelerating RFID and QR smart-label uptake.
Why is Asia-Pacific the highest-growth region?
Massive parcel volumes in China and new RFID production capacity in India underpin a 4.92% regional CAGR through 2031.
What supply-side trend is most shaping competition?
Integration of IoT sensors that enable predictive maintenance is emerging as a decisive differentiator among leading OEMs.
Page last updated on:


