Packaging Printing Market Size and Share
Market Overview
| Study Period | 2020 - 2031 |
|---|---|
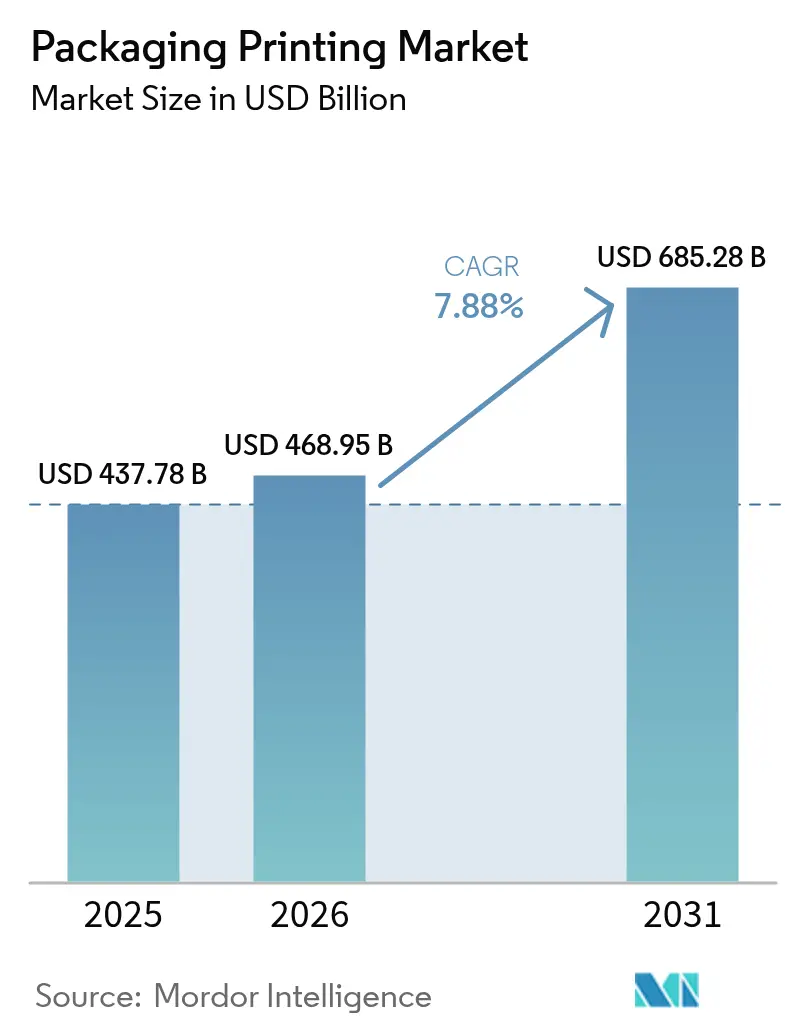
| Market Size (2026) | USD 468.95 Billion |
| Market Size (2031) | USD 685.28 Billion |
| Growth Rate (2026 - 2031) | 7.88% CAGR |
| Fastest Growing Market | Middle East and Africa |
| Largest Market | Asia Pacific |
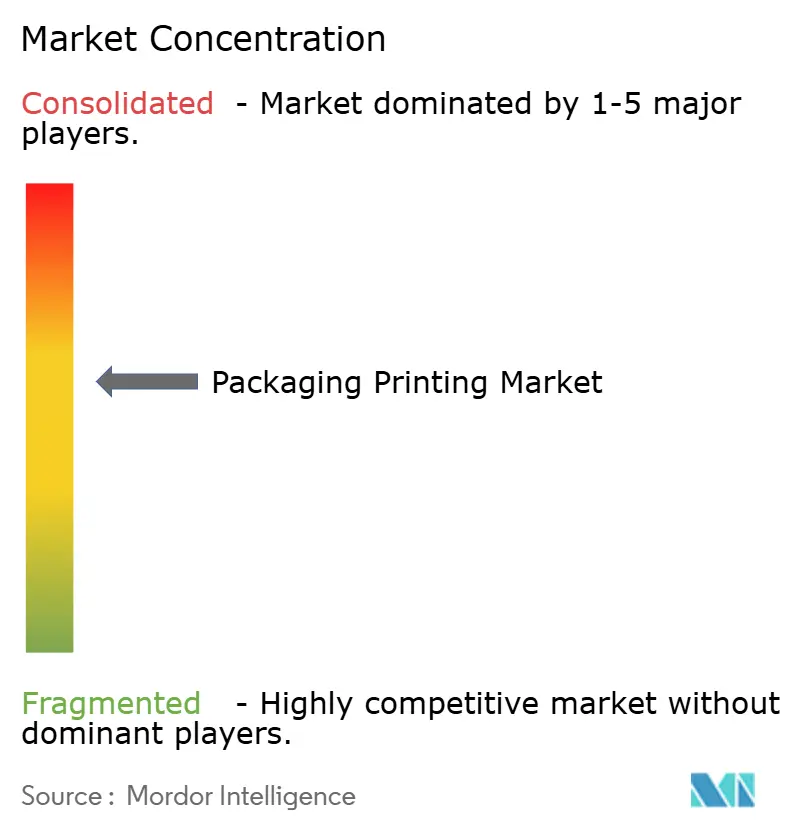
| Market Concentration | Medium |
Major Players.webp) *Disclaimer: Major Players sorted in no particular order Image © Mordor Intelligence. Reuse requires attribution under CC BY 4.0. | |
Packaging Printing Market Analysis by Mordor Intelligence
The packaging printing market size is expected to increase from USD 437.78 billion in 2025 to USD 468.95 billion in 2026 and reach USD 685.28 billion by 2031, growing at a CAGR of 7.88% over 2026-2031. Growing serialization mandates in the pharmaceutical and food sectors, rising e-commerce volumes that demand durable graphics, and a pronounced shift toward eco-friendly inks are steering the packaging printing market toward higher value work. Flexography accounted for the largest slice of 2025 revenue, yet digital platforms are scaling rapidly on the back of variable data capability and micro-factory deployment, tightening the race for short-run jobs. Substrate lightweighting goals, combined with the need for tamper evidence and anti-counterfeit elements, are recasting packaging from a protective layer into a traceable information carrier. Parallel supply-chain pressures around resin costs and labor shortages favor capital-intensive converters able to automate press rooms and lock in long-term feedstock contracts.
Key Report Takeaways
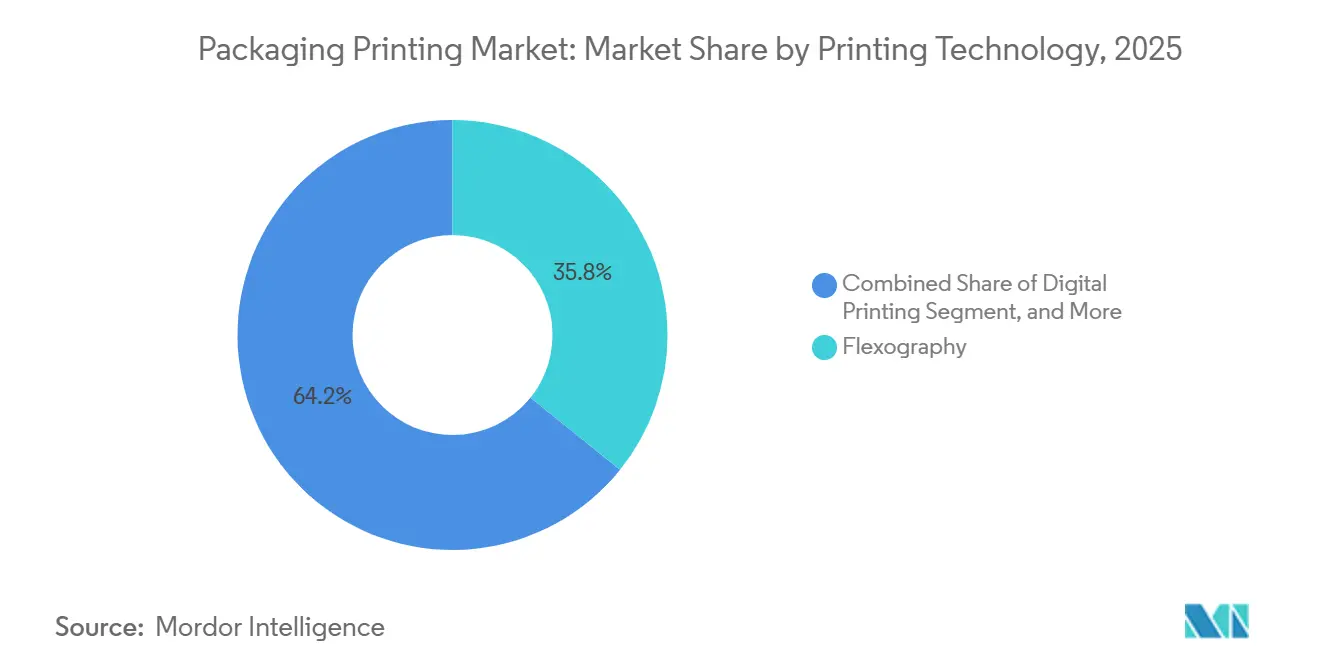
- By printing technology, flexography led with 35.79% of the packaging printing market share in 2025, while digital printing is projected to advance at an 8.54% CAGR through 2031.
- By ink type, solvent-based formulations commanded 39.43% of the market share in 2025, whereas the UV-curable inks segment is growing at an 8.23% CAGR over 2026-2031.
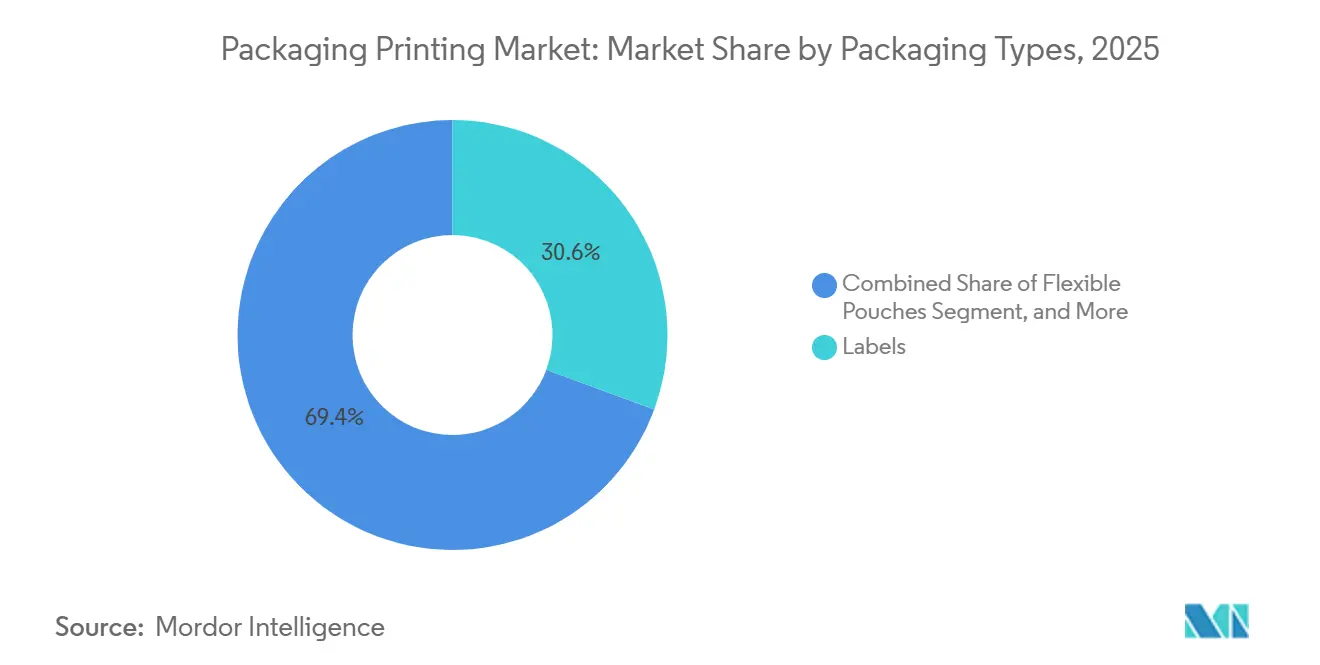
- By packaging type, labels accounted for 30.63% of the packaging printing market in 2025, and the flexible pouches segment is forecast to expand at an 8.82% CAGR through 2031.
- By end-use industry, food and beverage accounted for 28.88% of the market share in 2025, while the cosmetics and personal care segment is pacing the field with a 9.09% CAGR through 2031.
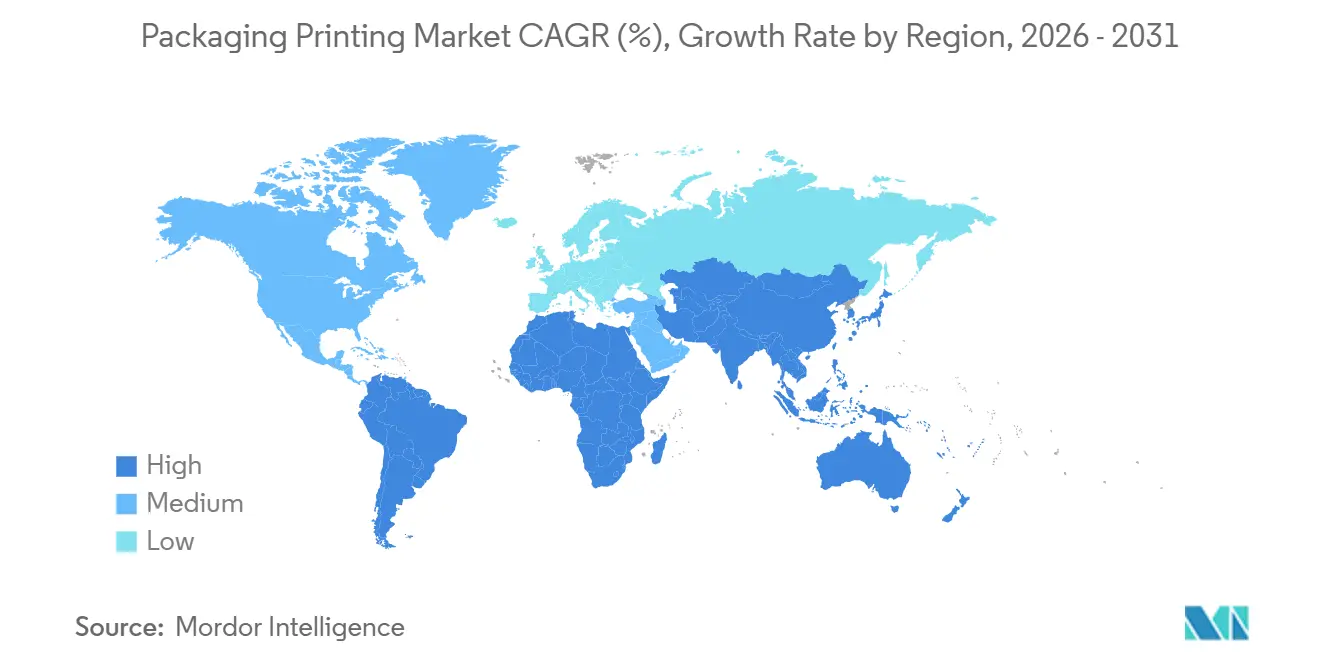
- By geography, Asia-Pacific accounted for 40.21% of the market share in 2025, whereas the Middle East and Africa region is on track for a 9.15% CAGR, the fastest worldwide.
Note: Market size and forecast figures in this report are generated using Mordor Intelligence’s proprietary estimation framework, updated with the latest available data and insights as of 2026.
Global Packaging Printing Market Trends and Insights
Drivers Impact Analysis*
| Driver | (~) % Impact on CAGR Forecast | Geographic Relevance | Impact Timeline |
|---|---|---|---|
| Demand for RFID-Enabled and Digital Printing | +1.8% | Global, concentrated in North America and Europe for pharmaceutical serialization, Asia-Pacific for retail and logistics | Medium term (2-4 years) |
| Expansion of E-Commerce Packaging Volumes | +2.1% | Asia-Pacific core, spill-over to Middle East and Africa, steady in North America | Short term (≤ 2 years) |
| Sustainability Push for Eco-Friendly Inks and Substrates | +1.5% | Europe and North America regulatory driven, Asia-Pacific brand-owner voluntary commitments | Long term (≥ 4 years) |
| Emerging-Market Consumption Boom | +1.3% | Asia-Pacific, Middle East and Africa, South America | Medium term (2-4 years) |
| Brand-Owner Adoption of Smart Pack Serialization | +1.0% | Global, led by pharmaceutical and food sectors in regulated markets | Medium term (2-4 years) |
| Rise of Localized Print-On-Demand Micro-Factories | +0.9% | North America and Europe initial deployment, Asia-Pacific scaling | Short term (≤ 2 years) |
| Source: Mordor Intelligence | |||
Demand for RFID-Enabled and Digital Printing
Retailers and pharmaceutical suppliers increasingly require item-level data to cut shrinkage and meet anti-counterfeit rules, pushing converters toward presses that can print variable QR codes and embed RFID inlays without slowing throughput. Hybrid flexo-digital lines now merge base color with serialized overprint in one pass, lowering changeover times by about one-third and unlocking new SKU rotation models. Brand owners in cosmetics refresh designs every few weeks, making digital’s plate-free workflow an operational match. The trend benefits the packaging printing market by broadening adoption beyond pilots to full-scale runs, as demonstrated when a leading converter ordered ten additional high-speed digital presses in February 2026. As regulatory scope widens, especially under the EU Falsified Medicines Directive, digitally enabled traceability becomes a baseline requirement rather than a competitive differentiator.
Expansion of E-Commerce Packaging Volumes
Online retail parcels pass automated sorters and variable climates, so graphics must resist abrasion while remaining scannable, a task well matched to UV-curable inks that dry instantly and avoid smudging. Asia-Pacific is the epicenter China alone recorded USD 1,825.65 billion in physical goods e-sales during 2023.[1]National Bureau of Statistics, “Statistical Communiqué 2023,” Stats China, stats.gov.cn Converters situated near fulfillment hubs can win rapid-turn orders that legacy analog plants cannot schedule economically, pushing flexible pouches and corrugated mailers higher in the packaging printing market stack. Regional demand also ripples into the Middle East and Africa, where sovereign funds back domestic printing plants to curb import dependence. Across mature North America, growth is steadier but still favors on-demand micro-factories embedded inside 24-hour distribution centers.
Sustainability Push for Eco-Friendly Inks and Substrates
Regulatory caps on volatile organic compounds and consumer sustainability pledges are accelerating the migration from solvent to water-based, UV-LED, and bio-based chemistries. In February 2026 Siegwerk secured third-party confirmation that its UV-LED portfolio is recycling compatible, clearing a historic hurdle for food-grade flexible packaging.[2]Siegwerk Communications, “Siegwerk Receives RecyClass Approval for UV/LED Inks,” Siegwerk, siegwerk.com Ink makers are stripping nitrocellulose and benzophenone derivatives to satisfy exclusion lists issued by trade bodies and brand auditors. LED curing cuts energy use up to 70%, an attractive lever for converters disclosing Scope 2 emissions. These factors increase average ink price per kilogram, yet converters pass costs on by positioning the finished pack as a lower-carbon, regulation-ready option, thereby lifting revenue per linear meter across the packaging printing market.
Emerging-Market Consumption Boom
Rising disposable income in Asia-Pacific, South America, and the Middle East and Africa expands demand for packaged proteins, ready meals, and personal care items translated into local languages. Vision-2030 policies in Saudi Arabia oblige retailers to source printed packs locally, steering investment into modern press halls that comply with halal food-contact norms. Brazil gains from near-shoring as North American brands diversify supply chains, channeling more work into flexible packaging that supports ambient and chilled export produce. Converters with hybrid press fleets can leapfrog analog incumbents by offering smaller batch runs and multi-SKU campaigns, deepening the addressable base of the packaging printing market.
Restraints Impact Analysis*
| Restraint | (~) % Impact on CAGR Forecast | Geographic Relevance | Impact Timeline |
|---|---|---|---|
| High Capital Investment Requirements | -1.2% | Global, most acute for SMEs in Europe and North America | Short term (≤ 2 years) |
| Complex and Varying Global Printing Regulations | -0.9% | Europe and North America stringent, Asia-Pacific fragmented | Long term (≥ 4 years) |
| Volatile Photo Initiator and Resin Prices | -0.7% | Global, supply concentration in China and Europe | Medium term (2-4 years) |
| Shortage of Skilled Flexographic Operators | -0.5% | North America and Europe aging workforce, Asia-Pacific training gaps | Medium term (2-4 years) |
| Source: Mordor Intelligence | |||
High Capital Investment Requirements
Next-generation presses bundling flexographic units, digital stations, and inline finishing often exceed USD 5 million per line, a threshold unreachable for many small converters. While financing tools such as sale-leasebacks exist, longer payback periods now stretching toward seven years strain cash flow. Market leaders mitigate exposure by locking substrate and ink volumes under multi-year deals, clawing back margin via scale. Independent shops lacking collateral either exit or accept toll-printing contracts, shrinking competitive diversity in the packaging printing market. The tilt toward fewer, larger players concentrates buying power and may ultimately compress consumable suppliers’ pricing latitude.
Complex and Varying Global Printing Regulations
Converters juggling shipments into the United States, the European Union, and Switzerland must validate each ink and adhesive against divergent migration and substance positive lists.[3]U.S. Food and Drug Administration, “Packaging and Food-Contact Substances,” FDA, fda.gov Compliance calls for duplicate laboratory tests and separate documentation packs per jurisdiction, inflating administrative overhead. Added friction arises from pharmaceutical serialization rules that overlay data-handling and vision inspection on the print line, pushing capital costs further upward. Smaller firms often triage markets, surrendering export opportunities rather than navigating a patchwork of laws, which limits the packaging printing market’s cross-border fluidity.
*Our forecasts treat driver/restraint impacts as directional, not additive. The impact forecasts reflect baseline growth, mix effects, and variable interactions.
Segment Analysis
By Printing Technology: Digital Gains Ground On Flexographic Leaders
Flexography captured 35.79% of the packaging printing market share in 2025, upheld by high-definition plates and automated register control that narrow quality gaps with gravure. Digital platforms are forecast to grow at a 8.54% CAGR, benefiting from plate-free variable imaging that aligns with the proliferation of e-commerce stock-keeping. A hybrid press installed in January 2026 showcases resolutions of 1,200 dots per inch, combining flexo lay-down with digital overprint in one web path. Rotogravure remains the go-to for ultra-long runs in tobacco and laminate décor, amortizing cylinder engraving across millions of impressions. Offset lithography is slowly ceding folding-carton work to water-based flexo as converters seek lower isopropyl emissions and faster drying profiles.
Asia-Pacific converters are installing digital engines at double the rate of European peers, propelled by shorter product life cycles in electronics and cosmetics. Retrofit modules that bolt onto legacy flexo frames allow incremental upgrades, safeguarding sunk capital. Across the packaging printing market, hybrid configurations hedge risk by enabling analog ink coverage for solid areas while reserving digital heads for serialized or language-specific elements. This flexibility supports SKU fragmentation without stocking multiple plate sets, trimming lead times and boosting plant utilization.


By Ink Type: UV-Curable Formulations Earn A Sustainability Premium
Solvent-based systems held 39.43% share in 2025 due to versatility on non-porous films, yet regulatory air emission ceilings drive interest in water, LED-UV, and bio-based chemistries. UV-curable inks are growing at an 8.23% CAGR on the back of instant curing and high scratch resistance, factors prized in e-commerce mailers. February 2026 certification that certain UV sets are recycling compliant removed a historical barrier to food contact. Water-based alternatives dominate paperboard, though longer drying cycles can curb line speed unless equipped with energy-recovery tunnels.
LED lamps consume roughly 70% less electricity than mercury bulbs, lowering Scope 2 emissions and utility bills. Latex inks offer low volatile organic compounds without wet-out issues on film, slotting neatly into midpoint applications. With lawmakers pressing for 70% packaging recycling rates by 2030, compliance advantages are expanding price differentials, allowing converters to command up to 15% premiums, a tailwind for the packaging printing market size at the segment level.
By Packaging Type: Flexible Pouches Outpace Legacy Labels
Labels contributed 30.63% of the market share in 2025, anchored in pressure-sensitive and shrink formats furnishing 360-degree branding for beverages and household chemicals. Flexible pouches, however, are scaling fastest at an 8.82% CAGR as pet food, coffee, and concentrated detergents migrate from rigid jars to lightweight, reclosable structures. A stand-up pouch reduces transport weight up to 90%, yielding freight and carbon savings. Label converters are re-tooling with wider presses and lamination lines to retain wallet share, a shift that lifts overall packaging printing market size for the flexible format niche.
Corrugated e-commerce shippers and molded fiber trays enjoy a sustainability halo, although film-lined paper cartons complicate recycling. Metal cans claim steady ground in aerosol and confectionery, leveraging aluminum’s barrier qualities. Technology choice intertwines with structure; multi-layer metallized pouches often require rotogravure or central-impression flexo to manage ink lay-down and registration, amplifying capital intensity while offering higher margin per square meter.
By End-Use Industry: Cosmetics And Personal Care Lead Growth Curve
Food and beverage users accounted for 28.88% share in 2025, driven by statutory ingredient panels and barcodes that must remain legible along chilled chains. Cosmetics and personal care advance at a 9.09% CAGR, fueled by holographic foils and soft-touch varnishes that justify retail premiums exceeding mass counterparts by triple digits. Item-level serial numbers on pharmaceuticals add consistent volume, with data-matrix barcodes and RFID inlays moving into commercial print runs. Household chemical packaging prizes chemical resistance over elaborate aesthetics, often retaining solvent inks on polyethylene bottles.
Electronics packaging mirrors rapid device refresh cycles, favoring digital presses that handle frequent artwork updates without plate costs. Specialty segments such as pet nutrition and lawn-and-garden tap flexible pouches paired with zippers, expanding run sizes and boosting the packaging printing market. Corporate sustainability commitments by global brands further funnel work toward recyclable substrates and low-migration inks, raising the technical hurdle for entrants.
Geography Analysis
Asia-Pacific cemented 40.21% of the market share in 2025 and remains the anchor of the packaging printing market. China’s towering e-commerce receipts obligate just-in-time packaging, while India’s tier-2 cities unlock fresh demand for flexible options amid infrastructure upgrades. Japan and South Korea are premium niches emphasizing cosmetic and pharma work that pays for specialty coatings. Australia prioritizes domestic capacity due to its distance from import centers, enforcing rigorous label laws that keep local operators insulated from offshore rivals.
The Middle East and Africa is projected to post a 9.15% CAGR, the fastest rate worldwide. Saudi Arabia leverages Vision 2030 procurement rules to foster indigenous converters that meet halal and Arabic-language packaging norms. Dubai free zones dangle tax holidays and customs exemptions, attracting multinational printers scouting for Gulf Cooperation Council access. Turkey’s dual EU–Central Asian gateway status offers strategic positioning, though currency swings and high inflation squeeze margin. South Africa faces rolling power outages, prompting diesel generator expenses that add cents per kilogram to production costs, yet regional demand for consumer staples continues to build underlying volume in the packaging printing market size.
Europe and North America are mature yet opportunity rich through sustainability mandates and premium brand extensions. Revised EU packaging waste rules stipulate 70% recycling by 2030, accelerating water-based ink adoption. Near-shoring trends lift U.S. converter utilization, although a 3.8 million factory-floor labor gap in 2024 hampers green-field rollouts. South America rides agricultural exports; Brazil’s flexible packs safeguard coffee and meat on long haul voyages. Argentina’s peso weakness unexpectedly positions local plants as low-cost print sources for multinational food brands targeting the Southern Cone bloc.

Competitive Landscape
The packaging printing market shows moderate concentration with the top 20 converters controlling almost half of the market in 2025, yet hundreds of regional specialists survive in niche and short-run applications. Private-equity platforms accelerate roll-ups, exemplified by a USD 45 million stake in a digital-first network that operates more than 30 micro-factories across North America and Europe. Integrated material majors such as Amcor, Mondi, and Sealed Air are forward-integrating press capacity to capture graphic margins, while pure-play printers are backward-integrating into extrusion and ink mixing to buffer resin volatility.
Technology is the frontline of competition. A February 2026 purchase of ten high-speed digital presses signals migration of digital from pilot to mainstream runs, challenging flexo incumbents on sub-500-unit economics. Vertical integration also shapes rivalry: a USD 1.2 billion label acquisition added 170 sites to a global supplier, letting brand owners consolidate procurement via single invoices. Certification hurdles create soft moats; ISO 12647 color-management compliance now appears on many brand RFQs, pressuring smaller shops to modernize or lose multinational accounts.
White-space growth centers on pharmaceutical serialization and localized e-commerce packs. Cloud-based job routing platforms funnel work to the nearest qualified plant, compressing lead times to under two days and trimming freight miles. Material price volatility such as titanium dioxide climbing to USD 3,500 per ton in 2024 rewards converters with hedged contracts or captive pigment operations. Labor scarcity in Western markets fast-tracks automation projects, including robotic plate mounting and vision-guided defect detection, raising CapEx but reducing variables that dilute yield.
Packaging Printing Industry Leaders
Avery Dennison Corporation
CCL Industries Inc.
Smurfit WestRock
Sealed Air Corporation
Mondi Group
- *Disclaimer: Major Players sorted in no particular order

Recent Industry Developments
- February 2026: Siegwerk received RecyClass approval for UV and LED-curable inks, opening food-grade flexible opportunities.
- February 2026: HP announced a USD 50 million order for ten Indigo 200K presses by ePac to expand North American capacity.
- January 2026: Schreiner Group installed a 1,200 dpi FlexoHybrid press blending flexo and digital in one pass.
- November 2025: Amcor expanded protein packaging flexographic capacity to serve modified-atmosphere meat processors.


Global Packaging Printing Market Report Scope
Packaging printing encompasses various methods, including rotogravure and flexography, distinct from publication printing. It involves printing on paper, board, metal foil, and plastic film, which are then processed into packaging products and labels. This category includes cartons, folding boxes, flexible packaging, labels, and wrapping materials. The packaging printing industry is closely related to consumer goods, food and beverage, pharmaceuticals, and other sectors that require attractive and informative packaging.
The Packaging Printing Market Report is Segmented by Printing Technology (Offset Lithography, Rotogravure, Flexography, Digital Printing, and Other Printing Technologies), Ink Type (Solvent-based Ink, UV-curable Ink, Aqueous Ink, Latex Ink, and LED-UV Ink), Packaging Types (Labels, Plastic Containers and Films, Metal Cans and Foils, Paper and Paperboard Cartons, Flexible Pouches, and Other Packaging Types), End-Use Industry (Food and Beverage, Pharmaceutical and Healthcare, Cosmetics and Personal Care, Household and Industrial, Electronics and Electrical, and Other End-Use Industries), and Geography (North America, South America, Europe, Asia-Pacific, and Middle East and Africa). The Market Forecasts are Provided in Terms of Value (USD).
| Offset Lithography |
| Rotogravure |
| Flexography |
| Digital Printing |
| Other Printing Technologies |
| Solvent-based Ink |
| UV-curable Ink |
| Aqueous Ink |
| Latex Ink |
| LED-UV Ink |
| Labels |
| Plastic Containers and Films |
| Metal Cans and Foils |
| Paper and Paperboard Cartons |
| Flexible Pouches |
| Other Packaging Types |
| Food and Beverage |
| Pharmaceutical and Healthcare |
| Cosmetics and Personal Care |
| Household and Industrial |
| Electronics and Electrical |
| Other End-Use Industries |
| North America | United States | |
| Canada | ||
| Mexico | ||
| South America | Brazil | |
| Argentina | ||
| Chile | ||
| Rest of South America | ||
| Europe | United Kingdom | |
| Germany | ||
| France | ||
| Spain | ||
| Italy | ||
| Rest of Europe | ||
| Asia-Pacific | China | |
| India | ||
| Japan | ||
| Australia | ||
| South Korea | ||
| Rest of Asia-Pacific | ||
| Middle East and Africa | Middle East | Saudi Arabia |
| United Arab Emirates | ||
| Turkey | ||
| Rest of Middle East | ||
| Africa | South Africa | |
| Nigeria | ||
| Egypt | ||
| Rest of Africa | ||
| By Printing Technology | Offset Lithography | ||
| Rotogravure | |||
| Flexography | |||
| Digital Printing | |||
| Other Printing Technologies | |||
| By Ink Type | Solvent-based Ink | ||
| UV-curable Ink | |||
| Aqueous Ink | |||
| Latex Ink | |||
| LED-UV Ink | |||
| By Packaging Types | Labels | ||
| Plastic Containers and Films | |||
| Metal Cans and Foils | |||
| Paper and Paperboard Cartons | |||
| Flexible Pouches | |||
| Other Packaging Types | |||
| By End-Use Industry | Food and Beverage | ||
| Pharmaceutical and Healthcare | |||
| Cosmetics and Personal Care | |||
| Household and Industrial | |||
| Electronics and Electrical | |||
| Other End-Use Industries | |||
| By Geography | North America | United States | |
| Canada | |||
| Mexico | |||
| South America | Brazil | ||
| Argentina | |||
| Chile | |||
| Rest of South America | |||
| Europe | United Kingdom | ||
| Germany | |||
| France | |||
| Spain | |||
| Italy | |||
| Rest of Europe | |||
| Asia-Pacific | China | ||
| India | |||
| Japan | |||
| Australia | |||
| South Korea | |||
| Rest of Asia-Pacific | |||
| Middle East and Africa | Middle East | Saudi Arabia | |
| United Arab Emirates | |||
| Turkey | |||
| Rest of Middle East | |||
| Africa | South Africa | ||
| Nigeria | |||
| Egypt | |||
| Rest of Africa | |||


Key Questions Answered in the Report
How large will the packaging printing market be by 2031?
It is projected to reach USD 685.28 billion by 2031, expanding at a 7.88% CAGR from 2026.
Which printing technology is growing fastest for consumer goods packaging?
Digital printing shows the highest growth, forecast at an 8.54% CAGR through 2031 due to variable data needs and micro-factory models.
What region offers the highest growth potential for new packaging print plants?
The Middle East and Africa leads with a projected 9.15% CAGR, backed by sovereign manufacturing investment and e-commerce adoption.
Why are flexible pouches gaining ground over rigid formats?
They cut transport weight up to 90%, support reclosable features, and align with retailer sustainability scorecards, driving an 8.82% CAGR.
How are sustainability regulations shaping ink selection?
Restrictions on volatile organic compounds and new recycling targets are shifting demand toward UV-LED and water-based inks certified as recycling compatible.
What is the biggest hurdle for small converters entering the market?
High capital costs for hybrid press lines that exceed USD 5 million and divergent global compliance rules limit affordable entry paths.
Page last updated on:


