Direct Thermal Labels Market Size and Share
Market Overview
| Study Period | 2020 - 2031 |
|---|---|
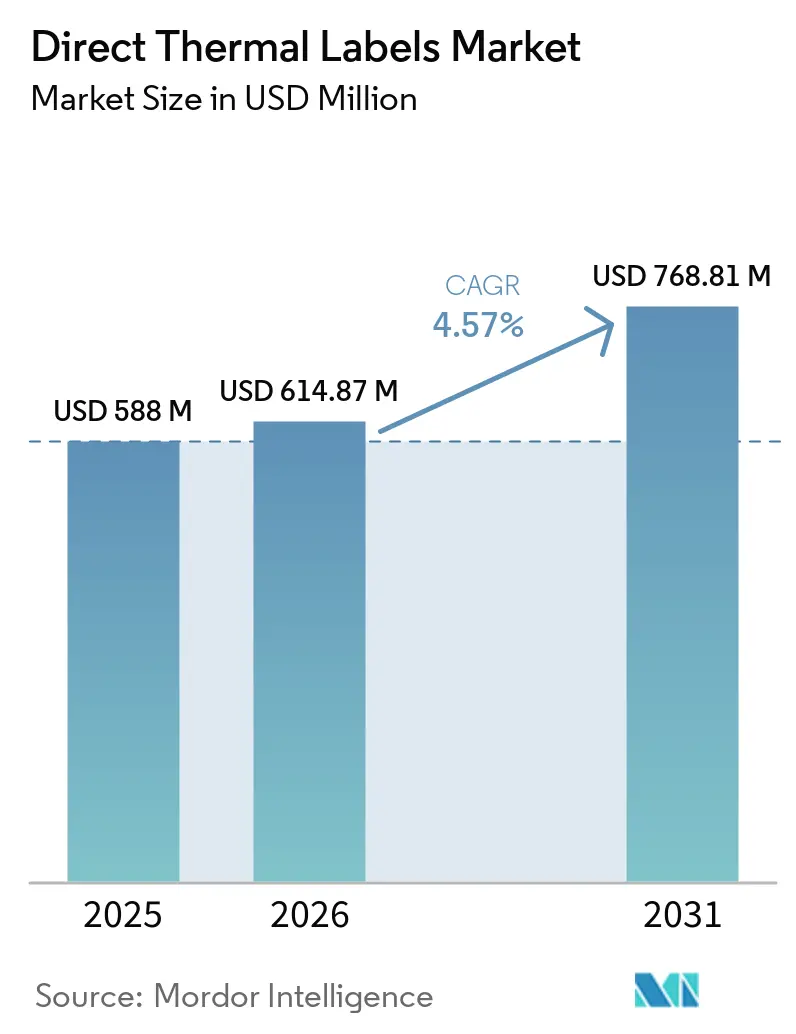
| Market Size (2026) | USD 614.87 Million |
| Market Size (2031) | USD 768.81 Million |
| Growth Rate (2026 - 2031) | 4.57% CAGR |
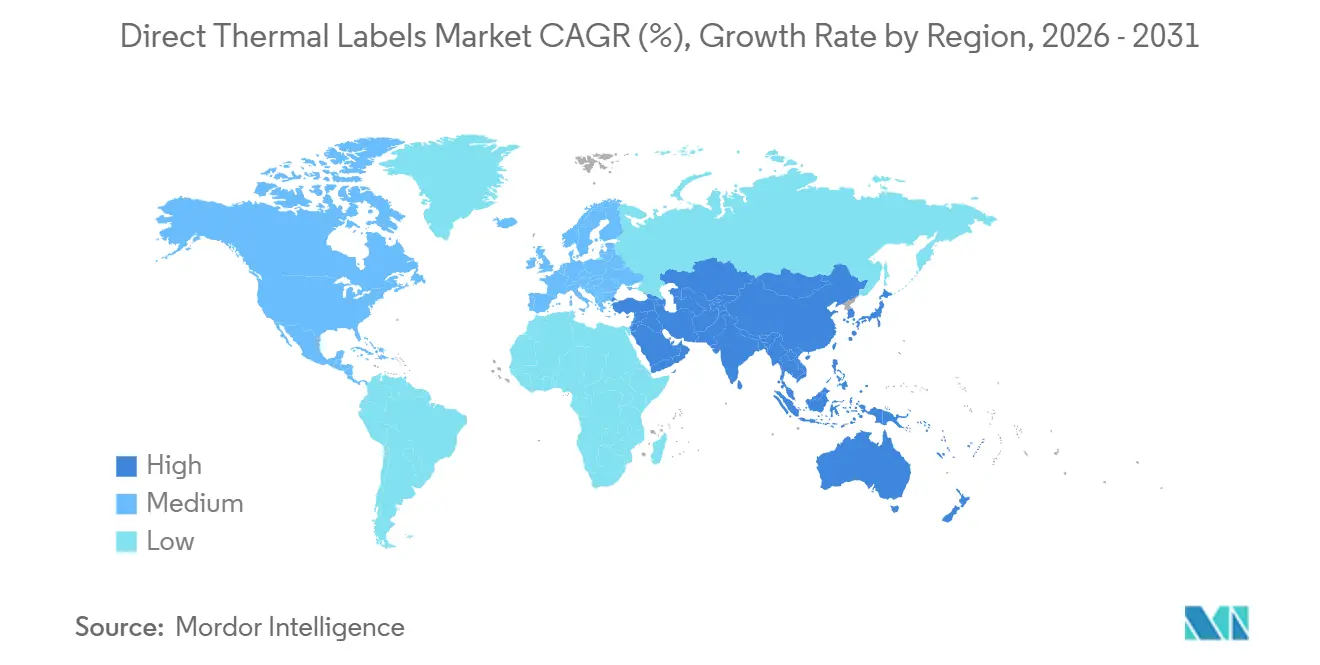
| Fastest Growing Market | Middle East |
| Largest Market | Asia-Pacific |
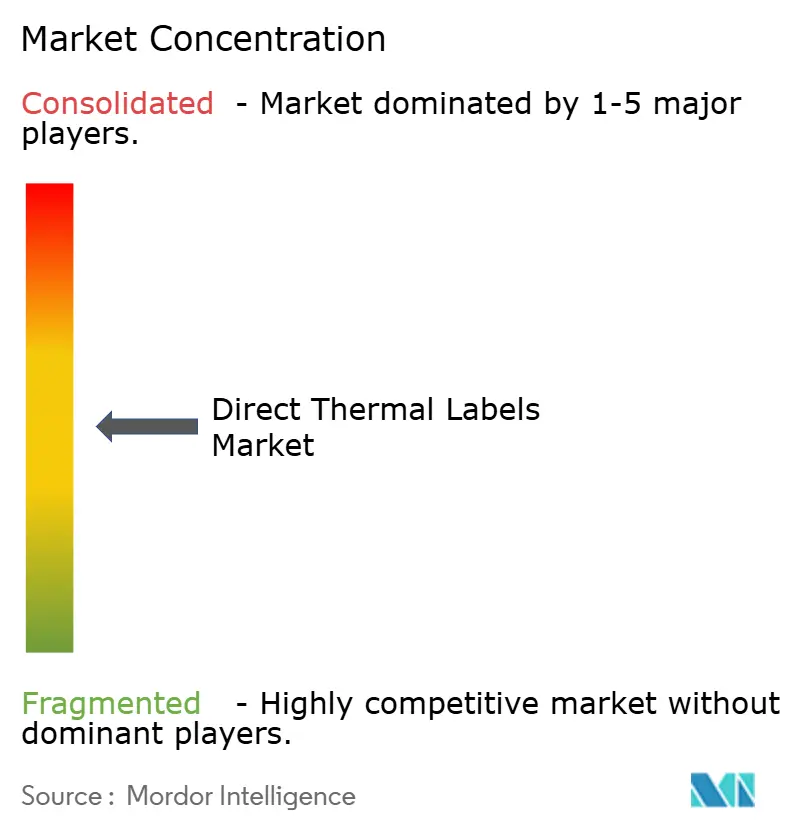
| Market Concentration | Medium |
Major Players *Disclaimer: Major Players sorted in no particular order Image © Mordor Intelligence. Reuse requires attribution under CC BY 4.0. | |
Direct Thermal Labels Market Analysis by Mordor Intelligence
The direct thermal labels market was valued at USD 588 million in 2025 and is estimated to grow from USD 614.87 million in 2026 to reach USD 768.81 million by 2031, growing at a CAGR of 4.57% during the forecast period (2026-2031). Pharmaceutical serialization deadlines that converge with e-commerce fulfillment automation are shortening replenishment cycles and pushing procurement toward just-in-time printing, a shift that favors the ribbon-free simplicity of direct thermal workflows.[1]European Parliament, “Regulation (EU) 2024/1852 on Packaging and Packaging Waste,” europarl.europa.eu Saudi Arabia’s GS1-compliant barcode mandate, the European Union Packaging and Packaging Waste Regulation, and retailer sustainability scorecards are accelerating capital expenditure on new printing assets before older fleets reach the end of life. Cold-chain expansion, linerless adoption, and QR-plus-RFID hybrid labeling are opening adjacent opportunities while raw-material price volatility and electronic shelf labels weigh on margins.
Key Report Takeaways
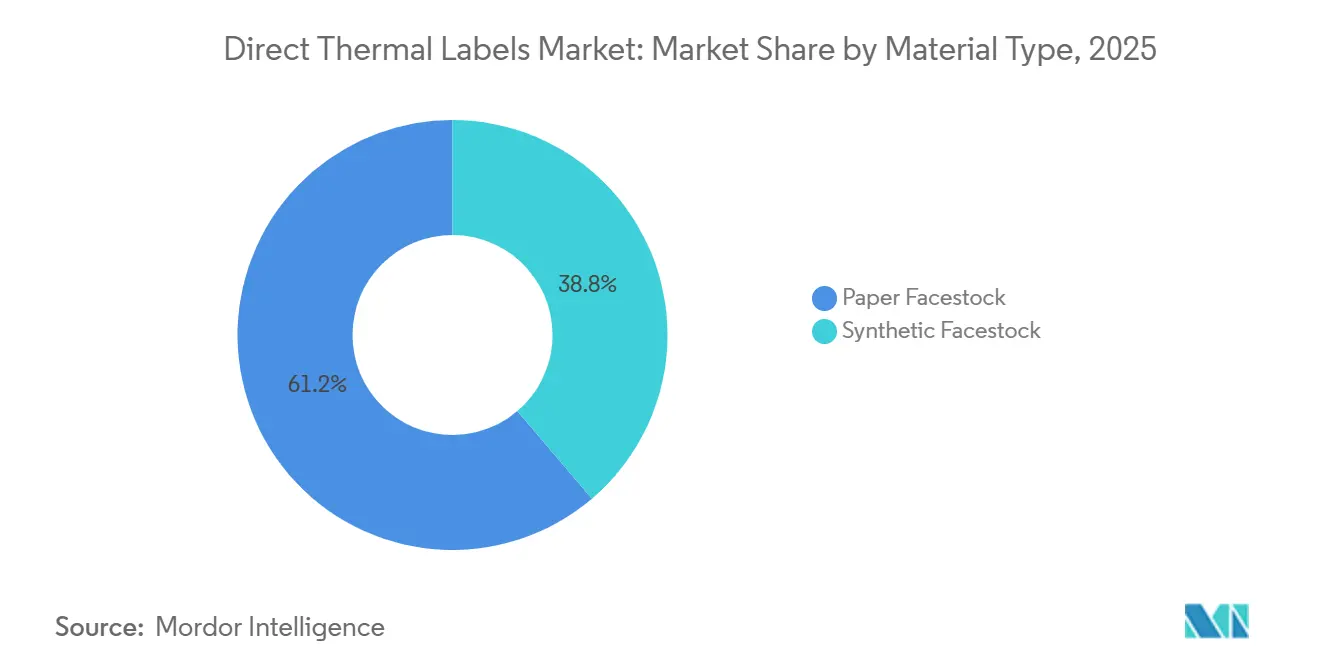
- By material type, paper facestock led with 61.23% share of the direct thermal labels market in 2025, while synthetic facestock is projected to expand at a 4.69% CAGR through 2031.
- By form factor, rolls held a 71.19% share of the market, and linerless formats are forecast to grow at a 5.01% CAGR through 2031.
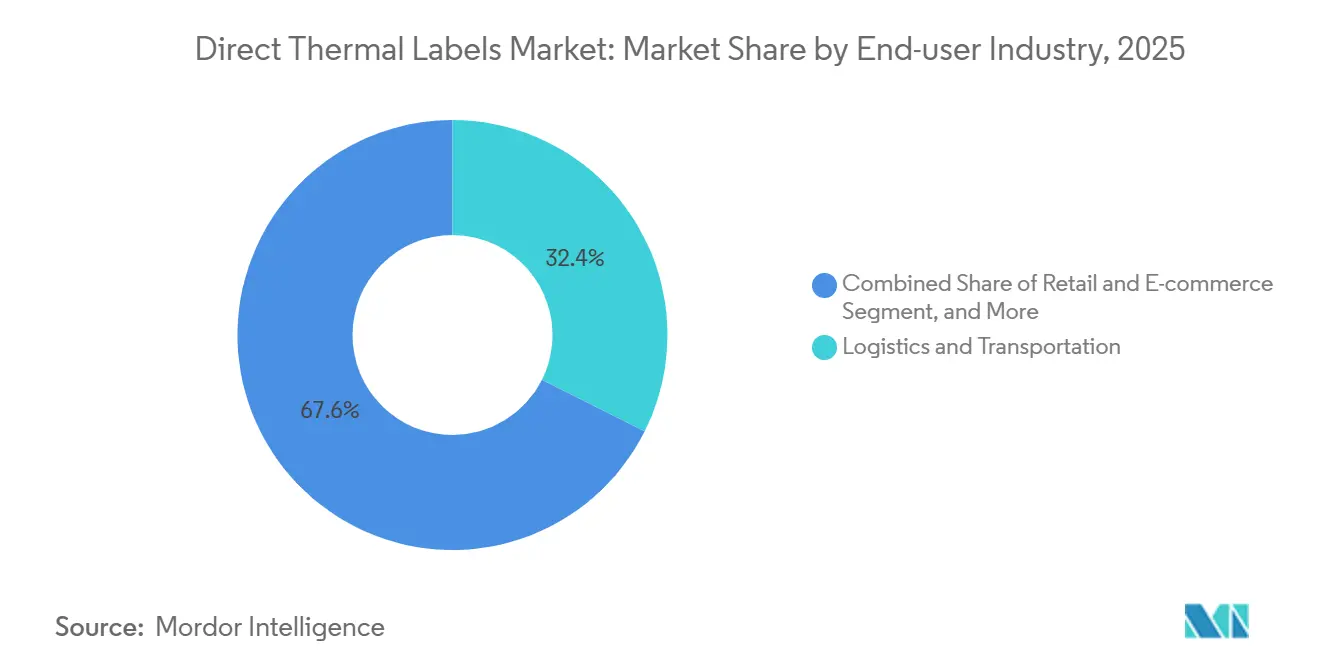
- By end-user industry, logistics and transportation accounted for 32.38% share of the market, whereas healthcare and pharmaceuticals are tracking the highest growth at 4.88% through 2031.
- By geography, Asia-Pacific captured 33.15% share of the direct thermal labels market, and the Middle East is the fastest-growing region with a 5.11% CAGR expected over 2026-2031.
Note: Market size and forecast figures in this report are generated using Mordor Intelligence’s proprietary estimation framework, updated with the latest available data and insights as of January 2026.
Global Direct Thermal Labels Market Trends and Insights
Drivers Impact Analysis*
| Driver | (~) % Impact on CAGR Forecast | Geographic Relevance | Impact Timeline |
|---|---|---|---|
| E-Commerce Fulfillment Growth Accelerates On-Demand Label Printing | +1.2% | Global, strongest in Asia-Pacific and North America | Short term (≤ 2 years) to Medium term (2-4 years) |
| Stringent Pharmaceutical Traceability Mandates | +0.9% | Global, early adoption in the Middle East, Asia-Pacific, and Europe | Medium term (2-4 years) to Long term (≥ 4 years) |
| Integration of QR and RFID for Smart Logistics | +0.7% | Global, led by North America and the Asia-Pacific | Short term (≤ 2 years) to Medium term (2-4 years) |
| Cost-Efficient No-Ribbon Printing Lowers Total Ownership | +0.6% | Global | Long term (≥ 4 years) |
| Rise of Linerless Sustainability Standards in Retail | +0.5% | Europe and North America, emerging in Asia-Pacific | Medium term (2-4 years) to Long term (≥ 4 years) |
| Expansion of Cold-Chain Food Delivery Services | +0.4% | Global, strong growth in Asia-Pacific and Europe | Medium term (2-4 years) |
| Source: Mordor Intelligence | |||
E-Commerce Fulfilment Growth Accelerates On-Demand Label Printing
Parcel volume in Asia-Pacific is projected to climb from USD 51.24 billion in 2026 to USD 196.09 billion by 2035, a 16.08% compound annual growth rate that forces fulfillment centers to switch from bulk batches to real-time printing. Direct thermal eliminates ribbon changes and reduces downtime, which is critical when same-day delivery commitments leave no tolerance for printer stoppages. Walmart’s use of hybrid direct thermal and RFID labels achieved 99% inventory accuracy in a pilot program, validating the productivity upside of integrated barcoding and tagging. Carrier-label APIs now embed barcode generation at checkout, letting merchants print the correct service label in milliseconds. These software-driven workflows are unlikely with thermal-transfer ribbons, so parcel growth is directly translating into new direct thermal printer installations, trimming replacement cycles from 18 months to under 12 months in the busiest nodes.
Stringent Pharmaceutical Traceability Mandates
The Saudi Food and Drug Authority template, issued in 2025, requires GS1 GTINs, bilingual Arabic-English text, and DataMatrix codes, pushing contract manufacturers to adopt variable-data printing at rates above 300 units per minute. The UAE Ministry of Health requires a minimum text height of 1.6 mm and 12 mandatory data elements, while Jordan enforces similar bilingual rules. Direct thermal printers start instantly without ribbon pre-feed, saving 15-20 seconds on every batch changeover. The United States FDA’s phased National Drug Code migration extends through 2033, so converters must handle both 10-digit and 12-digit codes during transition. Because ribbon handling limits throughput, pharmaceutical lines are retooling around direct thermal for unit-level serialization, a trend likely to support equipment sales and consumables volume through the end of the decade.
Integration of QR and RFID Features for Smart Logistics
Walmart expanded its RFID mandate to general merchandise in 2025, forcing suppliers to apply labels with a scannable barcode and an ultra-high-frequency inlay.[2]Walmart Corporate, “Electronic Shelf Label Expansion Announcement,” corporate.walmart.com GS1’s Sunrise 2027 program obliges retailers to accept two-dimensional barcodes at the point of sale, accelerating the migration from linear UPCs to DataMatrix and QR. Avery Dennison’s IdentiFresh inlays embed Impinj M800 chips into direct thermal stock for fresh-food monitoring, showing spoilage can be cut 15-20% through real-time sensing. Zebra’s ZT600 printers combine printing, encoding, and in-line verification, so shippers avoid mismatched data between the ink layer and the silicon chip. Because direct thermal prints at lower platen temperatures than thermal transfer, RFID chips suffer fewer delamination failures, improving first-pass yield in high-speed encoding.
Cost-Efficient No-Ribbon Printing Lowers Total Ownership
Removing ribbon lowers consumable cost 20-30% and halves maintenance labor. SATO’s PW4NX handheld unit, introduced in 2026, claims 32% faster print speed and saves fleets over USD 10,000 annually in printhead costs when 100 printers are deployed. Honeywell’s PM45 platform predicts printhead failure up to 72 hours in advance, scheduling replacements before downtime occurs. Direct thermal printheads operate at 60-80 °C, far below thermal transfer’s 120-150 °C, trimming electricity use by 15-25%. Distribution centers printing 50,000 labels per day can save 3-5 MWh per printer per year, a line-item that scales to six-figure energy savings across large networks. The total cost of ownership model now favors direct thermal for applications with label lifespans of 12 months or less, which span the vast majority of logistics and retail workflows.
Restraints Impact Analysis*
| Restraint | (~) % Impact on CAGR Forecast | Geographic Relevance | Impact Timeline |
|---|---|---|---|
| Volatility in Thermal-Paper Base Prices | −0.8% | Global, acute in Asia-Pacific and Europe | Short term (≤ 2 years) to Medium term (2-4 years) |
| Fading and Image-Stability Limitations in Harsh Environments | −0.5% | Global, especially outdoor logistics and industrial | Long term (≥ 4 years) |
| Growing Adoption of Digital Labeling and RFID Tags | −0.4% | North America and Europe are emerging in the Asia-Pacific retail | Medium term (2-4 years) to Long term (≥ 4 years) |
| Capital Expense for Linerless Conversion Equipment | −0.3% | Global, slower uptake in cost-sensitive emerging markets | Short term (≤ 2 years) to Medium term (2-4 years) |
| Source: Mordor Intelligence | |||
Volatility in Thermal-Paper Base Prices
Koehler, Domtar, and Hansol raised global thermal paper prices by 10% in March 2026, blaming shipping disruptions, petrochemical inflation, and a structural shortage of OBD-2 leuco-dye developer.[3]Koehler Paper Group, “Thermal-Paper Price Adjustment Notice,” koehlerpaper.com Global demand for OBD-2 stands near 6,000-7,000 tons while capacity remains below 3,000 tons, sending spot prices above RMB 1,000,000 (USD 0.14 million) per ton. Pulp costs climbed 18% in late 2025, and European mills faced 25-30% higher energy bills, squeezing converter margins. Some mid-tier suppliers exited the market after failing to renegotiate fixed-price contracts with retailers. New Asian coating lines will not arrive until late 2027, so converters must cope with unstable input costs for at least two more years.
Fading and Image-Stability Limitations in Harsh Environments
Direct thermal images can fade under ultraviolet light, humidity, or when in contact with plasticizers, making them unsuitable for outdoor logistics or for assets tracked for more than 12 months. Carton labels stored in unconditioned warehouses in South Asia can become unreadable after 90 days in summer heat. Condensation in refrigerated display cases accelerates degradation, forcing some European grocers back to pre-printed tags. Plasticizer migration from PVC packaging grays blank areas and obscures codes, a risk in pharmaceuticals and cosmetics. Synthetic facestocks improve durability but cost 30-40% more, limiting adoption to high-value shipments. Aerospace and defense contractors still specify thermal-transfer tags rated for 10-year life, indicating that direct thermal growth will stay capped in long-term or outdoor applications.
*Our forecasts treat driver/restraint impacts as directional, not additive. The impact forecasts reflect baseline growth, mix effects, and variable interactions.
Segment Analysis
By Material Type: Synthetic Gains Ground in Extreme Environments
Paper facestock accounted for 61.23% of the direct thermal label market share in 2025, driven by its low price and compatibility with legacy printers. Synthetic facestock, although more expensive, is forecast to grow at 4.69% through 2031 as cold-chain logistics and serialization raise durability requirements. Retailers continue to use paper for short-haul parcels, where labels last only 30 days, but frozen-food distributors in Europe reported a 40% reduction in replacement costs after shifting to synthetic labels. The direct thermal labels market size tied to synthetics is enlarging as polyolefin films narrow the price gap. However, synthetic’s higher modulus demands precise platen pressure, so printers unable to adjust tension still default to paper rolls.
Durability rather than price now dictates substrate choice in pharmaceuticals, biotech, and outdoor logistics. Synthetic stock resists -40 °C to +80 °C swings and defies moisture, solving the curl and peel seen with paper in cold rooms or humid depots. Avery Dennison’s RFID-enabled in-mold synthetic labels demonstrate that reusable totes can withstand multiple wash cycles without delamination. Even so, synthetic media remains niche until converters amortize the new slitting and inspection lines required to handle thicker calipers.[4]Avery Dennison, “IdentiFresh RFID Inlays for Fresh Food Traceability,” averydennison.com


By Form Factor: Linerless Rolls Capture Sustainability-Driven Demand
Rolls accounted for 71.19% of revenue in 2025 because they run on virtually every installed thermal printer and are compatible with high-speed applicators. Fan-fold stock persists in pharmaceutical serialization lines that rely on precise hole registration, but its bulky packaging and slower reloads limit uptake elsewhere. Linerless labels, expanding at 5.01% CAGR, answer sustainability mandates and reduce landfill waste. Beontag’s study, showing 35% lower carbon emissions and 33% less water use than lined formats, is resonating with retailers measuring Scope 3 emissions.
The EU Packaging and Packaging Waste Regulation compels brand owners to adopt harmonized identification labels by 2028, giving linerless a compliance edge. Although linerless printers cost USD 300-500 more, users recoup that outlay within 18 months by cutting liner disposal costs and doubling the number of labels per roll. Warehouse managers also free 30-40% of storage space previously devoted to liner cores, allowing more revenue-generating inventory on the floor. Fan-fold formats are losing ground in niche medical and industrial applications because their cartons occupy twice the shelf space of equivalent linerless reels.
By End-User Industry: Healthcare Leads Growth Amid Serialization Mandates
Logistics and transportation accounted for 32.38% of the direct thermal labels market in 2025, driven by e-commerce parcel flows, yet healthcare and pharmaceuticals will outpace all others with a 4.88% CAGR to 2031. Saudi Arabia, the UAE, and Jordan require GS1-compliant, bilingual, and serialized labels on every drug unit, prompting factories to install direct thermal printers that can switch SKUs on the fly. Contract manufacturers value the 15-20 seconds saved per batch changeover because ribbons no longer need to be indexed.
Retail and e-commerce remain volume leaders as merchants embed carrier-label APIs into checkout screens for real-time printing. Food and beverage demand is climbing in the Asia-Pacific region, where online grocery penetration is set to double by 2030, driving the adoption of synthetic facestock that tolerates freezer burn. Industrial and durable-goods users stay cautious because direct thermal images fade outdoors; aerospace asset tags, for instance, still rely on thermal transfer for 10-year legibility. Nevertheless, mobile workforces in hospitality and parcel delivery now carry handheld printers such as SATO’s PW4NX, boosting flexibility without the need for ribbon inventory.

Geography Analysis
Asia-Pacific accounted for 33.15% of 2025 global revenue, supported by e-commerce packaging, which is projected to jump from USD 51.24 billion in 2026 to USD 196.09 billion by 2035. China remains the largest buyer, India the fastest grower, and Southeast Asian grocery platforms are shifting to synthetic stock to withstand tropical heat. GS1 Sunrise 2027 and retailers’ RFID pilots are driving demand for direct thermal printing and encoding in fulfillment hubs that require simultaneous printing and encoding capability.[5]Zebra Technologies, “RFID Apparel Mandate,” zebra.com
The Middle East is forecast to be the fastest-growing sub-region, with a 5.11% CAGR over 2026-2031. Saudi Arabia’s bilingual GS1 barcode rule, the UAE’s 1.6 mm text requirement, and Jordan’s serialization program are expanding pharmaceutical label volume. Vision 2030 healthcare investment and new drug-manufacturing sites require serialization-ready printers at line speeds exceeding 300 units per minute. Shipping disruptions in the Red Sea, combined with raw-material inflation, explain why Koehler and peers raised paper prices in March 2026, but converters expect relief only after new Asian coating lines start in late 2027.
Europe and North America face mixed trends. Walmart will replace paper shelf tags with digital price labels across all US stores by end-2026, trimming in-store paper volume, yet the same retailer is expanding RFID mandates that rely on hybrid direct thermal labels at distribution centers. The EU regulation, effective in August 2026, favors the adoption of linerless, and UPM’s ProCycle wash-off adhesive, launched in May 2026, targets that requirement. South America and Africa trail in uptake because fragmented rules and price sensitivity keep thermal transfer attractive for longer-life shipments.

Competitive Landscape
The market is moderately fragmented, with the five largest suppliers holding a significant share, enabling local converters to compete on specialty runs and quick lead times. Avery Dennison, CCL Industries, and UPM Raflatac dominate the adhesive-material jumbo rolls market, but hundreds of slitters customize widths for regional accounts. Printer makers, Zebra, SATO, Honeywell, and Brother, leverage consumable-attachment contracts, discounting hardware in exchange for exclusive media supply, which reshapes buyer options and margins. Zebra’s Wi-Fi 6-enabled ZT600 integrates RFID encoding and in-line verification, discouraging third-party label use because mismatched media can void the warranty.
White-space growth centers on linerless, extreme-temperature synthetics and hybrid RFID labels. Avery Dennison’s phenol-free formulations suit EU REACH limits while allowing Forest Stewardship Council certification. Digital-print startups now offer sub-24-hour turnaround on small-lot labels, bypassing traditional converters for micro-brands. Brady’s pending acquisition of Honeywell Productivity should create an end-to-end industrial identification provider with design software, printers, and materials under one roof, intensifying competition for heavy-industry accounts.
Technology differentiation is moving toward cloud-connected diagnostics, predictive maintenance, and machine-vision defect detection. UPM Raflatac’s ProCycle wash-off adhesive aligns with recycling mandates, while innovative chemistry firms target bisphenol-A-free and phenol-free color developers that withstand sunlight better than legacy leuco dyes.[6]UPM Raflatac, “ProCycle Portfolio Launch,” upmraflatac.com Compliance with GS1, ISO 15394, and ISO 15415 has become table stakes, and retailers now charge for barcode errors, putting a premium on print verification modules embedded in the press.
Direct Thermal Labels Industry Leaders
Avery Dennison Corporation
Appvion Operations Inc.
Zebra Technologies Corporation
Oji Holdings Corporation
Ricoh Company Ltd.
- *Disclaimer: Major Players sorted in no particular order

Recent Industry Developments
- March 2026: Koehler, Domtar, and Hansol raised global thermal paper prices by 10%, citing shipping disruptions and OBD-2 developer shortages.
- January 2026: SATO launched the CL4-SXR and CL6-SXR printers aimed at high-volume logistics environments.
- January 2026: Royal Mail announced a new policy, stating it would start charging business customers for self-adhesive thermal label rolls. The company had offered these label rolls at no cost to customers holding valid posting accounts.
- March 2025: Zebra completed its acquisition of Photoneo to embed 3D machine vision into print-and-apply systems.


Global Direct Thermal Labels Market Report Scope
The Direct Thermal Labels Market encompasses the global production, distribution, and consumption of labels that use heat-sensitive coating technology to print images or text without ink, toner, or ribbons. These labels are widely used for short- to medium-term identification, tracking, pricing, shipping, barcode printing, and inventory management applications across multiple industries.
The Direct Thermal Labels Market Report is Segmented by Material Type (Paper Facestock, and Synthetic Facestock), Form Factor (Rolls, Fan-fold, and Linerless), End-user Industry (Logistics and Transportation, Retail and E-commerce, Food and Beverage, Healthcare and Pharmaceuticals, Manufacturing and Industrial, and Other End-user Industries), and Geography (North America, South America, Europe, Asia-Pacific, Middle East, and Africa). The Market Forecasts are Provided in Terms of Value (USD).
| Paper Facestock |
| Synthetic Facestock |
| Rolls |
| Fan-fold |
| Linerless |
| Logistics and Transportation |
| Retail and E-commerce |
| Food and Beverage |
| Healthcare and Pharmaceuticals |
| Manufacturing and Industrial |
| Other End-user Industries |
| North America | United States |
| Canada | |
| Mexico | |
| South America | Brazil |
| Argentina | |
| Rest of South America | |
| Europe | United Kingdom |
| Germany | |
| France | |
| Italy | |
| Rest of Europe | |
| Asia-Pacific | China |
| Japan | |
| India | |
| South Korea | |
| Rest of Asia-Pacific | |
| Middle East | United Arab Emirates |
| Saudi Arabia | |
| Turkey | |
| Israel | |
| Rest of Middle East | |
| Africa | South Africa |
| Egypt | |
| Rest of Africa |
| By Material Type | Paper Facestock | |
| Synthetic Facestock | ||
| By Form Factor | Rolls | |
| Fan-fold | ||
| Linerless | ||
| By End-user Industry | Logistics and Transportation | |
| Retail and E-commerce | ||
| Food and Beverage | ||
| Healthcare and Pharmaceuticals | ||
| Manufacturing and Industrial | ||
| Other End-user Industries | ||
| By Geography | North America | United States |
| Canada | ||
| Mexico | ||
| South America | Brazil | |
| Argentina | ||
| Rest of South America | ||
| Europe | United Kingdom | |
| Germany | ||
| France | ||
| Italy | ||
| Rest of Europe | ||
| Asia-Pacific | China | |
| Japan | ||
| India | ||
| South Korea | ||
| Rest of Asia-Pacific | ||
| Middle East | United Arab Emirates | |
| Saudi Arabia | ||
| Turkey | ||
| Israel | ||
| Rest of Middle East | ||
| Africa | South Africa | |
| Egypt | ||
| Rest of Africa | ||


Key Questions Answered in the Report
What is the current size of the direct thermal labels market?
The direct thermal labels market size stands at USD 614.87 million in 2026 and is projected to reach USD 768.81 million by 2031 at a 4.57% CAGR, according to Mordor Intelligence.
Which substrate leads demand for direct thermal labels?
Paper facestock commanded 61.23% of global revenue in 2025, retaining leadership because of its low price and compatibility with existing printers.
Why are linerless labels growing faster than other form factors?
Linerless formats expanding at 5.01% eliminate silicone-coated liners, cut carbon emissions 35% and water consumption 33%, and pack 60% more labels per roll, which shortens roll-change downtime and accelerates payback on new hardware.
Which region will expand the fastest through 2031?
The Middle East is expected to grow at a 5.11% CAGR as Saudi Arabia, the UAE and Jordan enforce pharmaceutical serialization that requires on-demand bilingual labeling.
How are RFID and direct thermal technologies converging?
Retailers such as Walmart now require labels that print a barcode and encode an RFID inlay in one pass; printers like Zebra's ZT600 handle both tasks, improving inventory accuracy to roughly 99%.
What key risk threatens short-term growth?
Volatile thermal-paper pricing, driven by OBD-2 developer shortages and shipping disruption, is squeezing converter margins and may slow investment until new coating capacity comes online in 2027.
Page last updated on:


