
Thermal Transfer Label Market Size and Share
Market Overview
| Study Period | 2020 - 2031 |
|---|---|
| Market Volume (2026) | 188.66 Million square meters |
| Market Volume (2031) | 221.68 Million square meters |
| Growth Rate (2026 - 2031) | 3.28 % |
| Fastest Growing Market | Asia-Pacific |
| Largest Market | North America |
| Market Concentration | Medium |
Major Players *Disclaimer: Major Players sorted in no particular order Image © Mordor Intelligence. Reuse requires attribution under CC BY 4.0. | |
Thermal Transfer Label Market Analysis by Mordor Intelligence
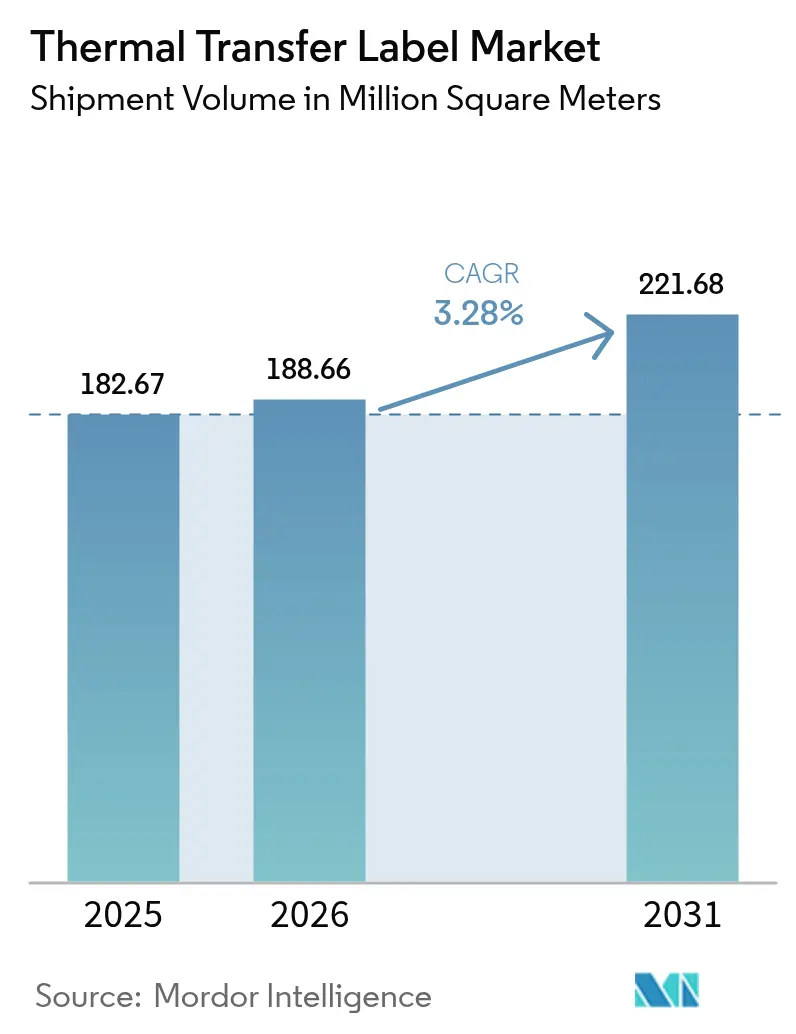
The thermal transfer label market size is expected to grow from 182.67 million m² in 2025 to 188.66 million m² in 2026 and is forecast to reach 221.68 million m² by 2031 at 3.28% CAGR over 2026-2031. The thermal transfer label market is moving from rapid expansion toward steadier growth as regulatory compliance requirements tighten across pharmaceuticals, food, and electronics. Adoption of polypropylene and polyester substrates is rising because these materials resist chemicals and elevated process temperatures, while liner-free formats and blockchain-enabled “smart” tags expand functional use cases. Investment in automation, especially within e-commerce fulfilment centers, reinforces demand for high-resolution barcodes and RFID-ready labels that survive mechanical handling. At the same time, resin price swings, eco-solvent inkjet substitution in short-run packaging, and recycling bottlenecks for silicone liners restrain the thermal transfer label market’s near-term upside.
Key Report Takeaways
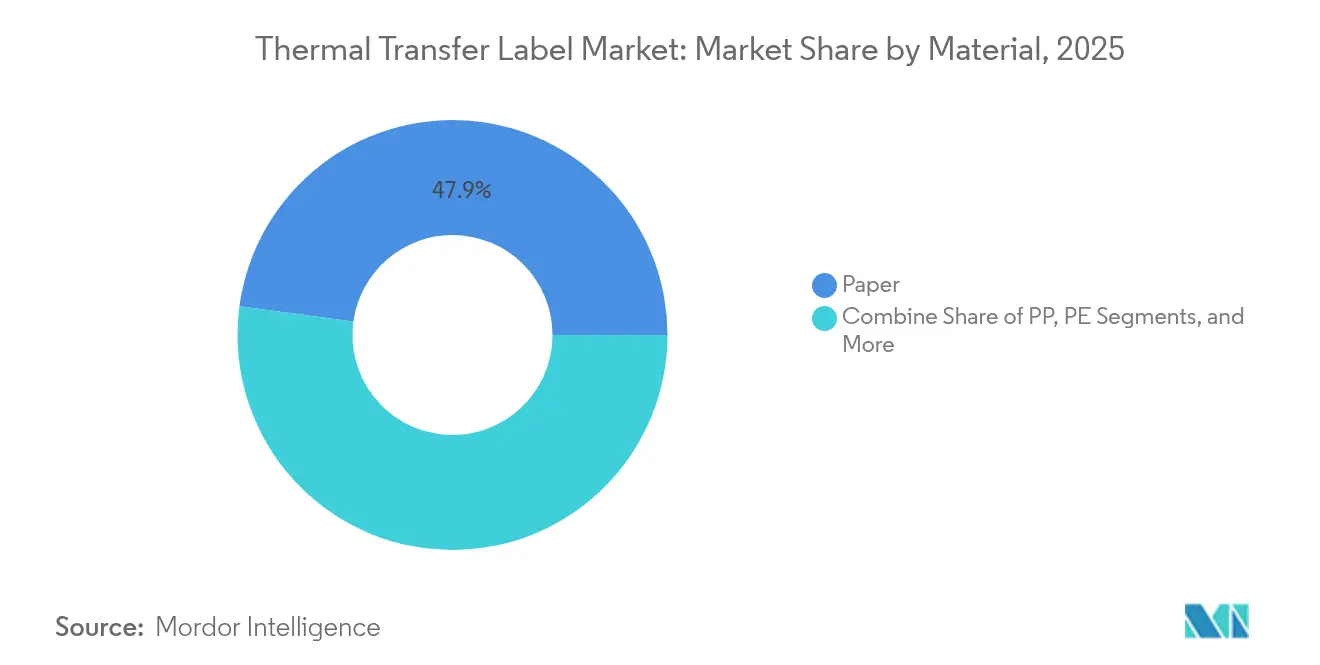
- By material, paper retained 47.86% of thermal transfer label market share in 2025; polypropylene is projected to rise at 7.15% CAGR through 2031.
- By ribbon type, full wax commanded 41.85% of the thermal transfer label market size in 2025, while full resin is expanding at 6.21% CAGR.
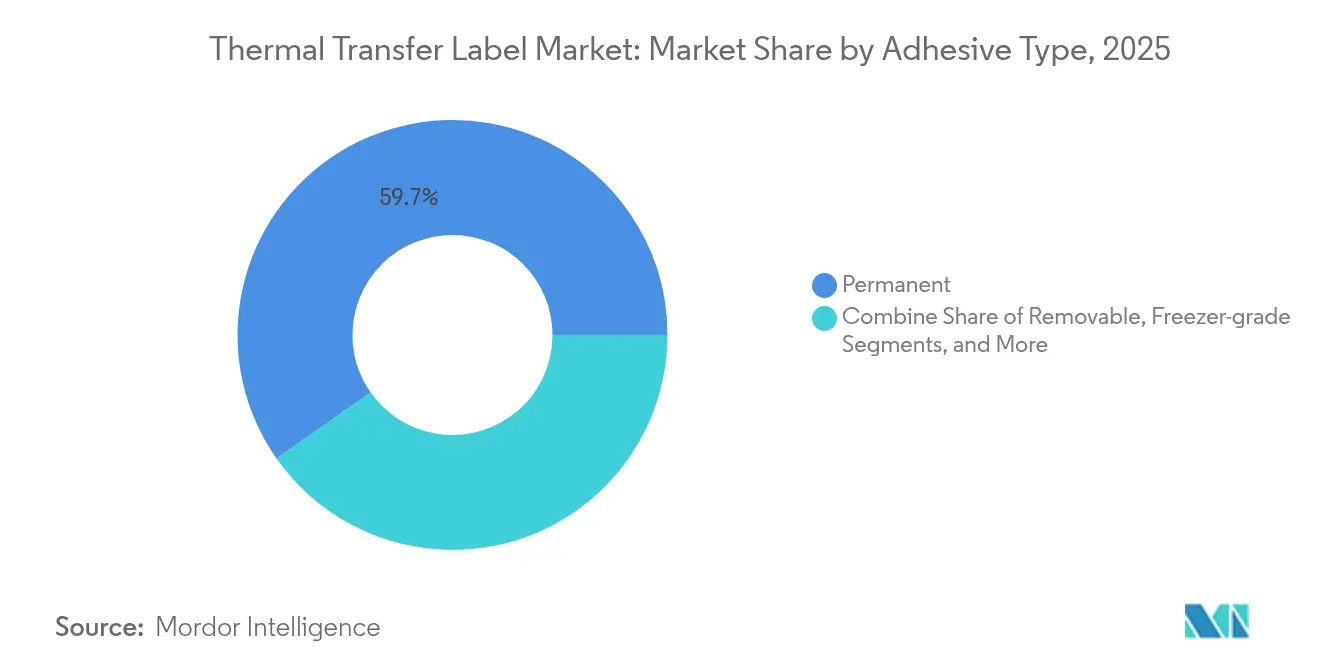
- By adhesive, permanent grades accounted for 59.74% of thermal transfer label market share in 2025; freezer-grade options advance at an 7.63% CAGR to 2031.
- By end-user industry, logistics and transportation led with a 30.05% revenue share in 2025; healthcare and pharmaceuticals shows the fastest 8.02% CAGR.
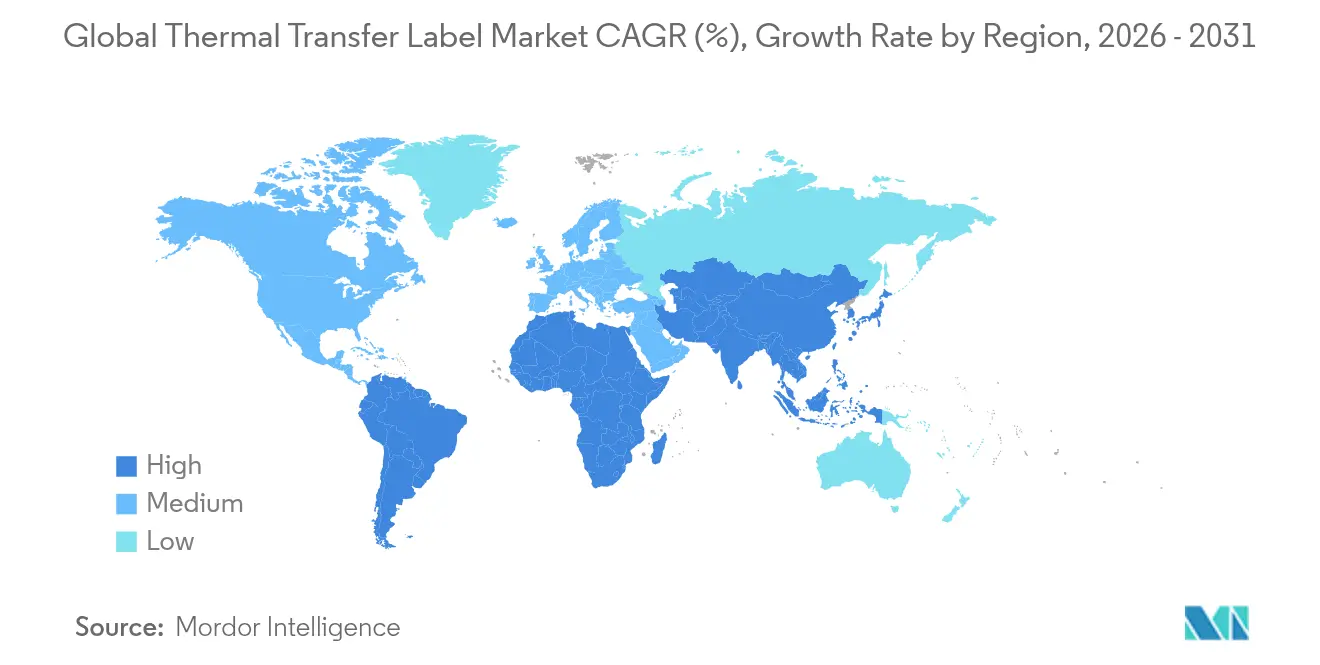
- By geography, North America held 35.10% of thermal transfer label market share in 2025, whereas Asia-Pacific is on course for a 6.92% CAGR to 2031.
Note: Market size and forecast figures in this report are generated using Mordor Intelligence’s proprietary estimation framework, updated with the latest available data and insights as of 2026.
Market Trends and Insights
Drivers Impact Analysis of Thermal Transfer Label Market*
| Driver | (~) % Impact on CAGR Forecast | Geographic Relevance | Impact Timeline |
|---|---|---|---|
| Healthcare unit-dose and specimen-tracking mandates | +0.8% | North America and EU, expanding to APAC | Medium term (2-4 years) |
| Polyester label uptake in high-temperature electronics lines | +0.6% | Global, concentrated in APAC manufacturing hubs | Long term (≥ 4 years) |
| E-commerce fulfilment automation (barcode and RFID upgrades) | +0.7% | Global, led by North America and Europe | Short term (≤ 2 years) |
| Adoption of liner-free TT media in quick-service restaurants | +0.4% | North America and Europe, emerging in APAC | Medium term (2-4 years) |
| Blockchain-ready smart labels for anti-counterfeit traceability | +0.3% | Global, early adoption in pharmaceuticals and luxury goods | Long term (≥ 4 years) |
| Source: Mordor Intelligence | |||
Healthcare Unit-Dose and Specimen-Tracking Mandates
Drug Supply Chain Security Act milestones that took effect in 2024 require every prescription package to carry a standardized numerical identifier that remains legible through distribution and storage. Pharmaceutical lines therefore specify high-durability thermal transfer ribbons whose printed codes withstand sterilization and cold-chain excursions. Contract packagers such as Cardinal Health integrate serialization modules into equipment that processes millions of unit doses each month. [1]Cardinal Health, “From Packaging to Patients: A Guide for Successful Serialization,” cardinalhealth.comLaboratory networks embrace the same standards for specimen identification, extending the thermal transfer label market into diagnostic vials and slide tracking. Emerging digital display labels offer status readouts, yet thermal transfer remains the mandated hard-copy backup inside regulated workflows. The shift locks in new baseline volumes and amplifies demand for resin-rich ribbons able to resist ethanol and autoclave cycles.
Polyester Label Uptake in High-Temperature Electronics Lines
Lead-free solder and finer pitch components expose printed circuit boards to reflow temperatures near 260 °C. Polyester labels rated to 150 °C protect traceability data during wave solder and cleaning, while premium polyimide formats survive 300 °C aerospace and automotive profiles. Asian fabs now combine these substrates with RFID inlays that endure the same heat, pushing ribbon chemistry toward silicone-modified and ceramic-filled resins. Brady Corporation’s harsh-environment polyester series further adds UV and solvent resistance, illustrating the blend of thermal, chemical, and outdoor safeguards now expected. Growth in high-temperature electronics therefore lifts the thermal transfer label market above the average CAGR.
E-Commerce Fulfilment Automation (Barcode and RFID Upgrades)
Robotic picking systems and RFID-enabled inventory checks dominate modern fulfilment centers. Walmart’s phased RFID mandate for general merchandise compels suppliers to apply tags robust enough for automated sorters. Direct thermal shipping labels often smear under friction, so operators switch to resin-enhanced thermal transfer formats that sustain 99.9% scan rates even after repeated conveyance. When the United States Postal Service refreshed 180,000 label printers, it adopted units capable of both modes but recommended thermal transfer for long-haul barcodes. Seasonal surges double parcel throughput and reward ribbons that cut mis-sorts, underscoring the thermal transfer label market’s link to e-commerce growth.
Adoption of Liner-Free TT Media in Quick-Service Restaurants
Quick-service kitchens issue thousands of time-sensitive order labels daily. Liner-free rolls remove the silicone carrier that forms nearly half of traditional label waste, slashing disposal costs and aligning with sustainability pledges. Repositionable adhesives allow crew members to move tickets from prep counters to delivery bags without residue. Iconex Sticky Media fits existing printers after a platen upgrade, enabling early movers such as global coffee chains to add 40% more labels per roll and cut roll swaps during peak hours. Although new dispensers carry upfront costs, waste-fee savings and smoother workflows underpin a steady liner-free sub-segment within the thermal transfer label market.
Restraints Impact Analysis of Thermal Transfer Label Market*
| Restraint | (~) % Impact on CAGR Forecast | Geographic Relevance | Impact Timeline |
|---|---|---|---|
| Volatility in specialty resin pricing | -0.5% | Global, acute in North America and Europe | Short term (≤ 2 years) |
| Shift to eco-solvent inkjet in short-run packaging | -0.3% | Europe and North America, emerging in APAC | Medium term (2-4 years) |
| Recycling bottlenecks for siliconised release liners | -0.2% | Global, regulatory pressure in EU | Long term (≥ 4 years) |
| Source: Mordor Intelligence | |||
Volatility in Specialty Resin Pricing
Polyethylene and polypropylene feedstocks account for most ribbon base film costs. When specialty resin surcharges spiked 40% during recent supply disruptions, converters with thin margins hesitated to hold inventory. Thermal transfer labels require uniform coating viscosity, so producers cannot simply downgrade to cheaper alternatives without requalifying end-user print profiles. North American suppliers enjoy shale-based gas price advantages, but European processors face higher energy bills and aggressive carbon taxes that further compress margins. Hedging and multi-sourcing strategies mitigate risk, yet frequent price renegotiations dampen customer willingness to lock in long-term contracts, tempering expansion of the thermal transfer label market.
Shift to Eco-Solvent Inkjet in Short-Run Packaging
Digital presses now output full-color labels at acceptable economies for batches under 5,000 units. Brands that refresh artwork every season increasingly favor eco-solvent inkjet lines because they avoid ribbon changeovers and allow photographic imagery. [2]Konica Minolta, “Label and Packaging Industry Predictions for 2025,” konicaminolta.eu Brother’s ZINK technology prints without consumables and resists water, posing a niche threat for promotional stickers. While thermal transfer excels at chemical durability and high-volume economics, loss of small seasonal jobs trims total throughput growth. Converters respond by offering hybrid services, yet the gradual drift toward color inkjet applies downward pressure on the thermal transfer label market’s share of short-run packaging expenditure.
*Our forecasts treat driver/restraint impacts as directional, not additive. The impact forecasts reflect baseline growth, mix effects, and variable interactions.
Thermal Transfer Label Market Segment Analysis
By Material:
Paper Strength Holds Amid Synthetic GainsPaper accounted for 47.86% of the thermal transfer label market share in 2025, thanks to its low cost and ready availability for shipping carton labels. The segment’s volume continues to expand alongside parcel growth, but price sensitivity limits revenue growth. Polypropylene is forecast at a 7.15% CAGR through 2031 as chemical drums, oil filters, and pharmaceutical vials migrate to moisture-resistant films. Polyethylene supports squeezable packaging, albeit at slower mid-single-digit rates. Polyester and polyimide, together, represent a smaller yet lucrative slice, as they anchor the high-temperature electronics sub-sector. Repulpable silicone release liner technology from Western Michigan University aims to boost paper’s recyclability credentials, potentially prolonging its dominance. Recycled-content trials advance across all substrates as converters align with corporate sustainability goals, indicating that environmental performance now rivals economics in material selection within the thermal transfer label market.
Paper’s primacy in cost-driven logistics will persist, but regulatory change reshapes the premium tiers. Pharmaceutical serialization rules necessitate substrates that handle autoclave and cryogenic conditions, tilting share toward coated synthetic films. Electronics assemblers insist on UL-recognized polyester able to survive flux solvents. DNP’s V300 resin ribbon, certified to print on 90% of these media, illustrates cross-compatibility gains that simplify converter inventories. Material suppliers must therefore balance paper capacity with investment in higher-margin synthetics to capture value in the thermal transfer label market.



By Ribbon Type:
Wax Foundations Enable Resin UpsellFull wax ribbons supplied 41.85% of the thermal transfer label market size in 2025, as they cater to the vast shipping and inventory tag base. Yet high-temperature and solvent-rich environments fuel a 6.21% CAGR for full resin grades. Wax-resin hybrids bridge the gap by offering scratch resistance at a moderate premium, making them popular in automotive parts distribution and for chemical warehouse labels. DNP ribbon architecture reveals five engineered layers backcoat, film, primer, ink, overcoat each tuned for heat dispersion and print head protection. Solvent-free coating processes from ARMOR-IIMAK reduce VOC emissions, aligning ribbon plants with ISO 14001 standards and bolstering the sustainability narrative that buyers increasingly demand.
Demand for resin escalates in parallel with the growth of electronics, aerospace, and medical instrument manufacturing. Wave soldering lines require print darkness retention after multiple 260 °C cycles, a capability that surpasses the capabilities of wax-based chemistry. Converters upsell by demonstrating lifetime barcode readability under isopropyl alcohol wipe tests. Meanwhile, price-conscious logistics operators continue to specify wax for cartons where exposure risks are minimal. This bifurcation keeps wax volumes high but shifts profit pools toward advanced resin within the thermal transfer label market.
By Adhesive Type:
Permanent Grades Anchor Cold-Chain ExpansionPermanent adhesives covered 59.74% of the thermal transfer label market share in 2025, forming the default choice across corrugated, PET, and HDPE packages. Freezer-grade products log the fastest 7.63% CAGR as biologics, frozen meals, and vaccine vials extend global cold-chain mileage. Acrylic formulations that tack below –20 °C and resist condensation prevent label drop-off that could compromise traceability. Removable adhesives serve rental totes and reusable containers, while high-tack versions adhere to textured castings and oily metal surfaces in heavy industry.
Adhesive vendors increasingly certify food-contact compliance and sterilization resistance. Medical device manufacturers require labels that withstand ethylene oxide and gamma cycles without leaving any residue. UV-stable chemistries support outdoor asset tags. Brady’s all-weather vinyl series combines aggressive adhesion with flexible facestock, ensuring secure attachment on rough or curved substrates. Such specialized solutions command higher margins and reinforce adhesive selection as a key differentiator inside the thermal transfer label market.
By End-User Industry:
Logistics Leadership Meets Healthcare MomentumLogistics and transportation represented 30.05% of revenue in 2025, propelled by parcel networks that ship billions of items yearly. Automation upgrades keep barcode throughput rising, sustaining core wax ribbon consumption. Healthcare and pharmaceuticals now lead growth at an 8.02% CAGR, reflecting DSCSA serialization and specimen tracking that elevate durability specifications. Food and beverage processors adopt freezer-grade labels to align with hazard analysis compliance, while industrial manufacturers use thermal transfer for asset ID, safety signage, and work-in-process tracking. Semiconductor fabs drive adoption of tiny polyester labels that carry unique device identifiers through wafer etch and probe stages.
Avery Dennison’s intelligent labels combine RFID with traditional print to serve omnichannel grocery, while TraceLink documents Siegfried’s serialization rollout across sterile lines. End-users now evaluate labeling not only on cost but also on data capture accuracy and environmental footprint. This shift rewards converters that deliver integrated media, ribbon, and software bundles, reinforcing solutions-based competition across the thermal transfer label market.
Geography Analysis
North America Thermal Transfer Label Market
North America commanded 35.10% of the thermal transfer label market share in 2025 on the back of strict FDA serialization and expansive e-commerce infrastructure. United States parcel carriers print hundreds of millions of labels daily, driving head-count reductions through reliable machine readability. Canada and Mexico add automotive VIN and cross-border compliance volumes, further stabilizing demand. Zebra Technologies reported 11.3% net sales growth to USD 1,308 million in Q1 2025, demonstrating how automation budgets translate into steady consumable demand. Moderate GDP growth limits unit expansion, yet regulatory rigidity preserves a high floor for the regional thermal transfer label market.
APAC Thermal Transfer Label Market
The Asia-Pacific region is projected to deliver the highest 6.92% CAGR to 2031, driven by electronics clusters in China, South Korea, and Taiwan that require heat-resistant substrates. India’s vaccine and generic drug export boom accelerates serialization installations, while ASEAN e-commerce giants invest in fully automated fulfillment hubs. DNP Imagingcomm Asia scales local ribbon coating lines to shorten lead times and hedge currency swings. The region prioritizes capacity and price, yet value migration to polyester and resin products elevates revenue faster than square-meter growth.
EMEA and South America Thermal Transfer Label Market
Europe balances stringent packaging waste rules with leadership in liner-free adoption. CELAB-Europe targets a 75% recycling rate for release liners by 2025, pushing converters to trial recyclable or linerless formats. Germany and Italy sustain automotive and food machinery exports that require durable identification, while France and the United Kingdom enforce counterfeit deterrence in cosmetics and spirits. Russia’s volumes contract due to sanctions, but Middle East demand rises as Gulf states build pharmaceutical hubs. Africa’s growth is nascent but promising where agriculture exports call for traceable cold-chain labeling. South America, led by Brazil, captures sugarcane ethanol drum labels and beef exports that rely on freezer-grade adhesives. Together these dynamics keep geography-specific innovation active across the thermal transfer label market.

Regulatory Landscape
Thermal transfer labels are increasingly influenced by traceability needs, barcode quality expectations, and packaging-waste rules across key regions. In the United States, FDA-driven compliance requirements used in regulated workflows (food labeling guidance and broader uniform compliance-date administration, with January 1, 2028 set as the uniform compliance date for food labeling regulations published between January 1, 2025 and December 31, 2026) are reinforcing demand for high-legibility, durable codes and controlled materials for packaging and labeling applications.
In Europe, Regulation (EU) 2025/40 on packaging and packaging waste (PPWR) applies from August 12, 2026 and introduces harmonized labeling for packaging material composition, alongside digital-marking requirements tied to Extended Producer Responsibility (EPR) compliance. This combination raises the bar for label content management and can require updates to variable-data printing infrastructure. Separately, ISO 22742:2026 (published May 13, 2026) sets minimum requirements for linear bar code and 2D symbol design on product packaging, which further focuses attention on print quality, verifier-ready symbols, and fit-for-purpose ribbon and facestock choices in logistics, healthcare, and electronics supply chains.
Competitive Landscape
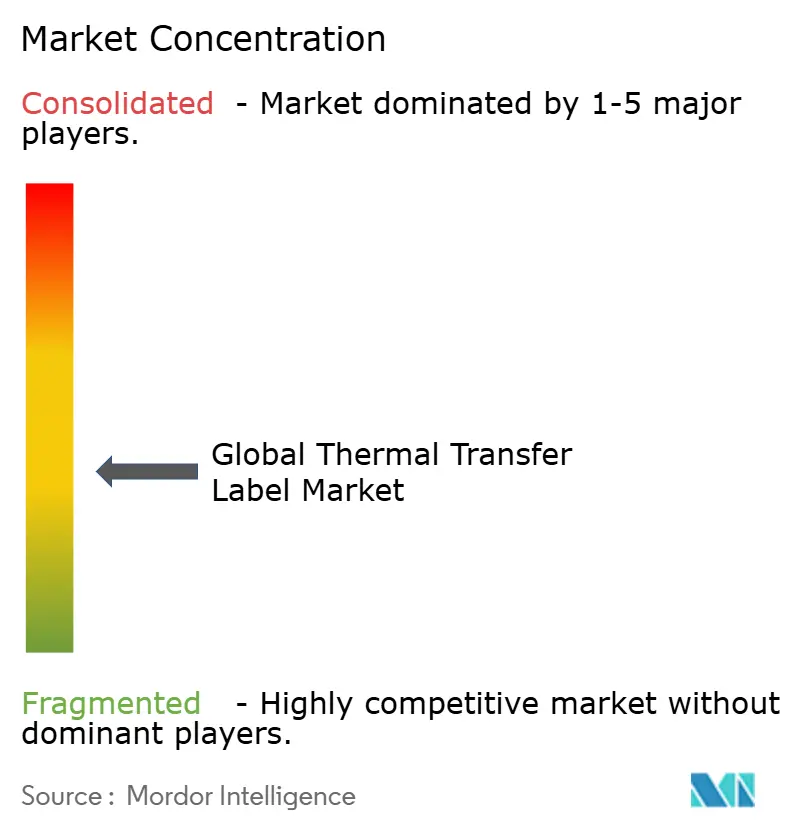
The thermal transfer label market exhibits a moderate Fragmentation. The top five suppliers account for approximately 55% of combined revenue, leveraging integrated coating, converting, and distribution footprints. CCL Industries reported USD 1,812.5 million in Q4 2024 sales, attributing the gains to cross-selling into the healthcare and high-temperature electronics sectors. Avery Dennison now derives almost half of its revenue from intelligent and high-value categories, underscoring the shift from commodity blanks to data-rich media. Brady, Mativ, and DNP round out the leading tier, each emphasizing sustainable coatings and credentials in harsh environments.
Strategic acquisitions target complementary technologies rather than raw capacity. OMNI Systems acquired Honeywell Media to secure a premium synthetic film supply and expand the reach of its private-label program. MCC’s purchase of Starport Technologies extends into smart label design for beverage and personal care brands. Patent filings for tamper-evident facestocks, liner-free slitters, and composite holographic barriers indicate continued research and development R&D intensity.
Thermal Transfer Label Industry Leaders
CCL Industries, LLC
3M Company
Constantia Flexibles
Honeywell International
Lintec Corporation
- *Disclaimer: Major Players sorted in no particular order
Thermal Transfer Label Market Companies Covered in this Report
- CCL Industries
- 3M
- Lintec
- Constantia Flexibles
- Honeywell International
- Ricoh
- Zebra Technologies
- SATO Holdings
- Avery Dennison
- Brady Corporation
- Brother Industries
- Seiko Epson
- TSC Auto ID
- BIXOLON
- ARMOR-IIMAK
- DNP Imagingcomm
- ITW Labels
- RRD
- Weber Packaging Solutions
- UPM Raflatac

Market Opportunities and Future Outlook
Two near-term whitespace themes are taking shape around connected printing systems and localized consumables capacity. On the technology side, suppliers are embedding software-connected functions into thermal transfer printing. SATO introduced the CL4-SXR and CL6-SXR industrial printer series in July 2026 with predictive maintenance via SATO Online Services, and Avery Dennison released the Pathfinder Edge handheld label printer in June 2026 for retail and logistics environments. These updates create room for converters and solution providers to bundle compliant media, ribbons, and device management workflows aimed at high-throughput barcode and RFID-ready labeling in fulfillment, store operations, and regulated identification.
On the supply side, volatility in ribbon substrates is creating both exposure and a qualification catalyst. ARMOR-IIMAK advanced a nearly USD 6 million expansion in Boone County, Kentucky to increase thermal transfer ribbon production capacity (announced via a state economic development release in May 2026), pointing to investment toward more resilient, closer-to-demand manufacturing footprints. At the same time, month-on-month ribbon price swings linked to PETG substrate constraints are pushing end users and converters to strengthen multi-sourcing, standardize media and ribbon interoperability, and accelerate linerless and lower-waste formats where printer fleets and application conditions allow.
Recent Industry Developments in Thermal Transfer Label Market
- July 2026: ARMOR-IIMAK completed the acquisition of Thermal Ribbons Australia, adding local slitting operations and strengthening its manufacturing footprint in Oceania. The move improves regional responsiveness for ribbon supply and supports faster service levels for converters and end users running high-throughput thermal transfer labeling programs.
- December 2025: Inovar Packaging Group acquired Enterprise Marking Products, expanding its capabilities in labels and thermal transfer-related products for industrial identification and marking applications. The acquisition broadens Inovar’s offering depth for customers that procure labels, ribbons, and integrated marking solutions through fewer suppliers.
- June 2024: Ennis acquired Printing Technologies, Inc. (PTI), adding thermal transfer and direct thermal media solutions to its portfolio. This consolidation strengthens Ennis’s position in specialty media and increases scale in segments where durability and barcode reliability drive repeat consumables demand.


Thermal Transfer Label Market Report Scope and Research Methodology
Market Definition and Coverage
For this methodology, the market covers thermal transfer labels that are printed using a ribbon and thermal transfer process, across common label materials and adhesives, and sold for product identification, tracking, and compliance use in end-user industries.
Scope exclusions: We exclude direct thermal labels and broader packaging materials that are not sold as thermal transfer labelstock or finished thermal transfer labels.
Segments Covered in This Report
- By Material
- Paper
- Polyester (PET)
- Polypropylene (PP)
- Polyethylene (PE)
- Other Materials
- By Ribbon Type
- Full Wax
- Wax-Resin
- Full Resin
- By Adhesive Type
- Permanent
- Removable
- Freezer-grade
- High-Tack / Specialty
- By End-user Industry
- Food and Beverages
- Healthcare and Pharmaceuticals
- Logistics and Transportation
- Industrial Goods
- Semiconductor and Electronics
- Other End-user Industry
- By Geography
- North America
- United States
- Canada
- Mexico
- Europe
- Germany
- United Kingdom
- France
- Italy
- Spain
- Russia
- Rest of Europe
- Asia-Pacific
- China
- India
- Japan
- South Korea
- Australia and New Zealand
- Rest of Asia-Pacific
- Middle East and Africa
- Middle East
- United Arab Emirates
- Saudi Arabia
- Turkey
- Rest of Middle East
- Africa
- South Africa
- Nigeria
- Egypt
- Rest of Africa
- Middle East
- South America
- Brazil
- Argentina
- Rest of South America
- North America
Data Sources, Market Sizing, and Validation
Desk Research
Desk research helped set realistic demand anchors, map the value chain, and form an initial view of where thermal transfer labeling demand is concentrated by industry and region. We typically start with public manufacturing and trade signals, such as U.S. Census Bureau manufacturing data, UN Comtrade customs statistics, and broad industrial indicators from the Federal Reserve.
To make the label demand story more complete, we also review packaging and labeling references from industry bodies and standards sources, including GS1 documentation for barcode and identification practices, plus open technical literature and journals that describe durability and print performance requirements by use case. Company filings, investor presentations, and reputable press were used to interpret capacity additions, material availability, and channel changes. This was supplemented with paid subscriptions for company financials and intelligence, news and financials, and selective patent databases when they added clarity. These examples are not exhaustive, and many other public sources were reviewed for data collection, validation, and research clarification.
Primary Interviews and Surveys
Primary interviews and surveys were used to confirm which end uses are buying more durable labels, how material mix shifts between paper and synthetics, and what drives label area consumption per shipped unit. We spoke with a mix of label converters, raw material participants, distributors, and large users across logistics, retail, healthcare, and industrial operations. The respondent input was used to close data gaps and to pressure-test assumptions across major regions.
Distribution of primary research fieldwork respondents
| Company type | Respondent position | Region |
|---|---|---|
| Top tier: 36% | CXOs: 13% | APAC: 39% |
| Mid tier: 42% | Functional/Unit leaders: 41% | EMEA: 35% |
| Smaller Players: 22% | Managers: 46% | Americas: 26% |
Market-Sizing & Forecasting
The sizing model is built mainly using a top-down approach where packaging output and shipment activity, along with labeling intensity by end use, is used to reconstruct the likely label area demand (square meters) that the market consumes each year. Once that demand pool is formed, we corroborate it with selective bottom-up approximations using a small set of supplier and converter roll ups, channel checks, and sampled average label area per application, to keep totals realistic.
A few practical inputs guide the math, including parcel and freight shipment growth, packaged food and beverage output trends, and pharmaceutical and healthcare labeling requirements tied to traceability. We also factor in the shift toward synthetic label materials in harsh environments. We track the impact of liner and face stock availability, typical label size mixes by application, and changes in automation adoption in warehouses, because these move area consumption faster than pricing alone. When the bottom-up check has missing coverage, we handle gaps using proxy assumptions from comparable end uses, then adjust them after expert feedback.
For forecasting, scenario analysis is used, since label demand can swing with macro shipping cycles and regulatory timing. The forward view is built from expected end-market production and logistics activity, then validated through expert consensus on material substitution, durability needs, and adoption timing across key industries.
Data Validation & Update Cycle
Validation is done through multiple passes where model outputs are cross-checked against independent signals, including packaging production trends, trade flows for relevant label materials, and observed changes in logistics volumes. When unusual jumps appear, we revisit assumptions, re-check unit conversions, and re-contact select interviewees so the variance is explained before the numbers are finalized.
A second analyst review is completed before sign-off, focusing on consistency across regions, end uses, and the implied label area per shipped unit. The report is refreshed annually, and interim updates are made when material events occur, such as major supply disruptions, regulatory shifts, or sudden demand changes in large end markets. Before delivery, we run a fresh update pass so clients receive the latest view aligned to newly available public data and recent interview feedback.
Mordor Intelligence's Thermal Transfer Label Market Estimate Compared With Other Published Estimates
Published market estimates for thermal transfer labels can look far apart because some studies measure value in USD while others track label area, and because the included product set is not always consistent across printing technologies and label formats. Differences also come from how firms treat the base year, currency timing, and how often assumptions are refreshed when logistics and packaging activity changes.
The biggest gaps usually come from mixing direct thermal labels into the same pool, counting printer hardware or ribbons as part of the label market, or using aggressive growth inputs that are not tied back to packaged goods output and shipment volumes. Some sources also rely on a single conversion factor for label usage across industries, which can overstate demand in sectors where label sizes are smaller or where automation adoption is slower.
Benchmark comparison
| Source | Market Size | Gaps in Research Methodology |
|---|---|---|
| Mordor Intelligence | USD 188.66 M (2026) | |
| Trade Journal B | USD 2.70 B (2024) | This figure appears to be a USD revenue view that can blend labels with adjacent thermal printing consumables, and it is not always clear whether direct thermal labels are excluded or how currency conversion timing was handled. |
| Regional Consultancy A | USD 4.79 B (2029) | The estimate likely applies a higher growth curve and a broader definition that may include printers or ribbons, and it gives limited visibility on linking demand to shipment and packaging output checks across regions. |
The table shows that the spread is driven less by math and more by what is counted and how it is measured. When a USD-based scope is compared to an area-based scope, totals separate naturally. Keeping the unit of measure tied to label area and filtering out adjacent categories like printers and ribbons explains much of the difference, which is why the core model stays in million square meters and is then presented as shown by Mordor Intelligence.


Key Questions Answered in the Report
What is the current size of the thermal transfer label market?
The thermal transfer label market size stood at 188.66 million m² in 2026 and is projected to reach 221.68 million m² by 2031 at a 3.28% CAGR.
Which segment is growing fastest within the thermal transfer label market?
Polypropylene materials are expanding the quickest, posting a 7.15% CAGR through 2031 due to chemical-resistant industrial applications.
Why are freezer-grade adhesives gaining traction?
Growth in cold-chain logistics for biologics and frozen foods pushes freezer-grade adhesives, which display an 7.63% CAGR because they maintain bond strength at sub-zero temperatures.
How do regulatory mandates influence market demand?
US DSCSA serialization and similar global tracking rules force pharmaceutical lines to adopt durable thermal transfer labels, adding +0.8% to forecast CAGR.
Is digital printing replacing thermal transfer technology?
Eco-solvent inkjet absorbs some short-run color work, yet thermal transfer remains preferred for high-volume, high-durability labeling, especially in logistics, healthcare, and electronics.
Page last updated on:


 Your data is secure and never sold or shared.


