
Clinical Diagnostics Market Size and Share
Market Overview
| Study Period | 2020 - 2031 |
|---|---|
| Market Size (2026) | USD 93.59 Billion |
| Market Size (2031) | USD 121.76 Billion |
| Growth Rate (2026 - 2031) | 5.41% CAGR |
| Fastest Growing Market | Asia-Pacific |
| Largest Market | North America |
| Market Concentration | Medium |
Major Players *Disclaimer: Major Players sorted in no particular order Image © Mordor Intelligence. Reuse requires attribution under CC BY 4.0. | |
Clinical Diagnostics Market Analysis by Mordor Intelligence
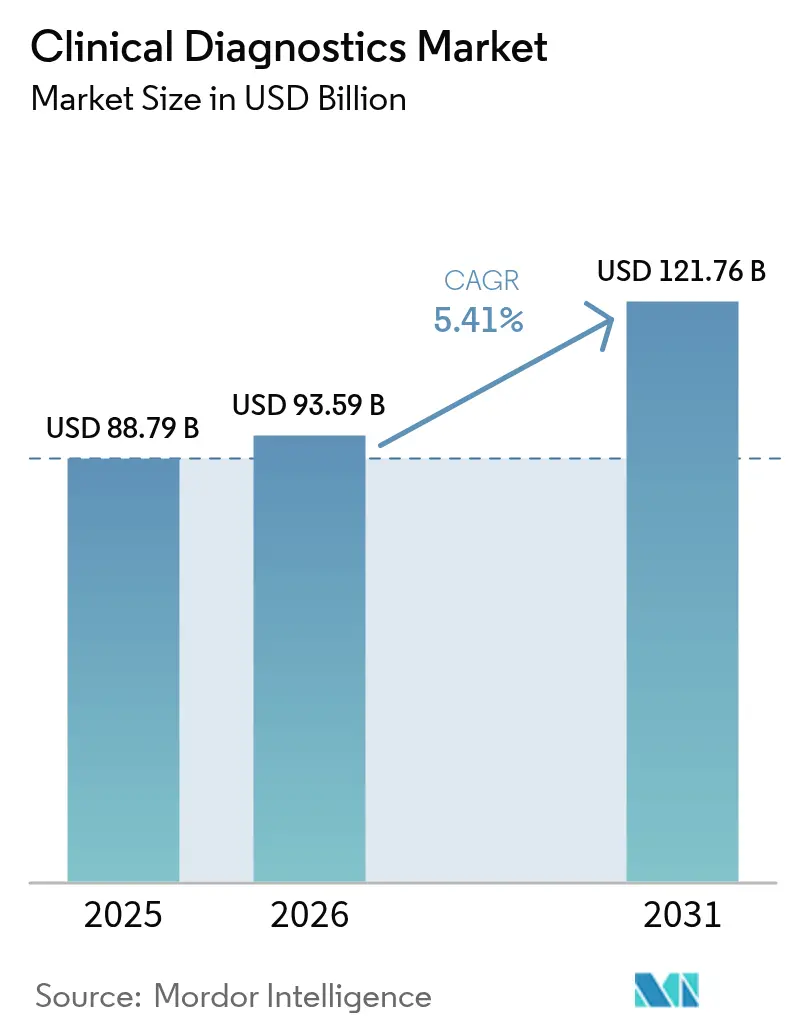
The clinical diagnostics market size is expected to grow from USD 88.79 billion in 2025 to USD 93.59 billion in 2026 and is forecast to reach USD 121.76 billion by 2031 at 5.41% CAGR over 2026-2031. This outlook signals a shift from pandemic-driven volatility to steady growth as laboratories converge automation, artificial intelligence, and precision-medicine capabilities. Heightened chronic-disease prevalence keeps routine Complete Blood Count (CBC) volumes high, yet oncology biomarker panels scale faster as health systems embrace personalized care models. Reagent pricing pressure intensifies as instrument automation trims per-test consumption, while data-management software moves from “nice-to-have” to “mission-critical” status for quality-assurance and interoperability. Emerging economies funnel infrastructure investments toward decentralized and home-based testing formats, expanding the clinical diagnostics market beyond its traditional institutional base.
Key Report Takeaways
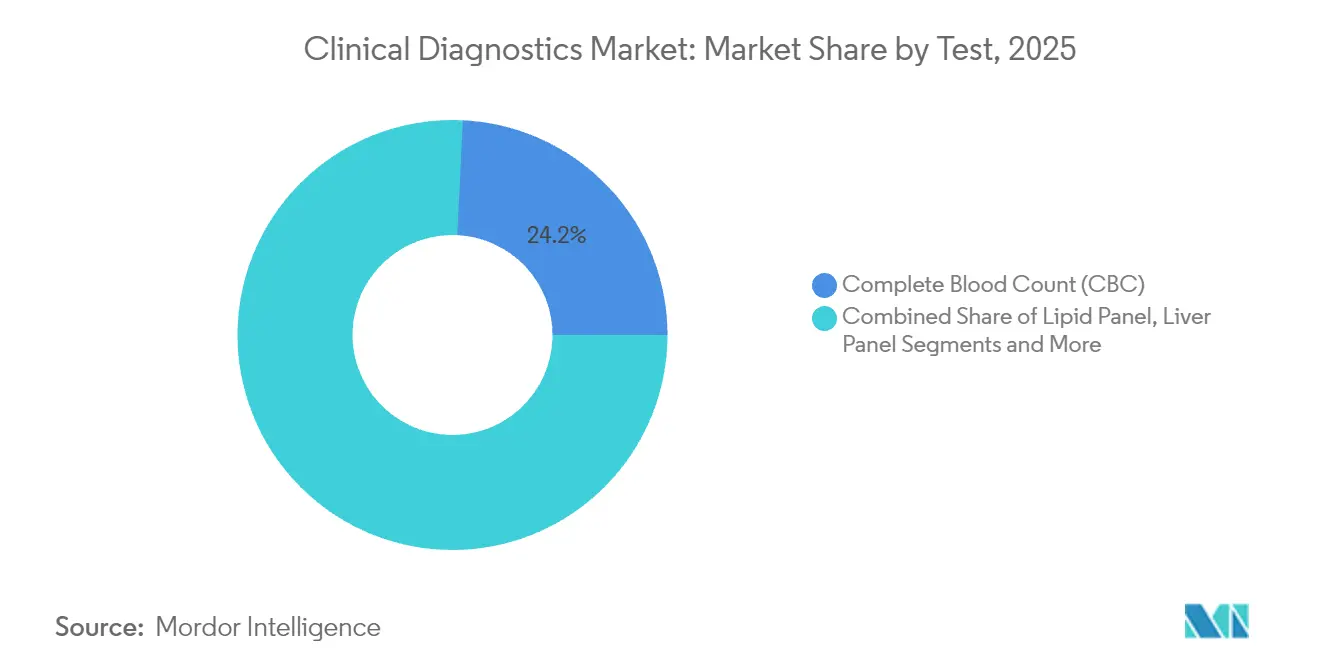
- By test, CBC held 24.24% of 2025 clinical diagnostics market share, whereas oncology & tumor marker testing is projected to grow at 10.39% CAGR through 2031.
- By product, reagents & kits led with 64.98% share in 2025; data-management software & services is set to post the highest 10.62% CAGR to 2031.
- By technology, immunoassay & immunochemistry captured 32.25% share in 2025, while molecular diagnostics will expand at a 12.05% CAGR.
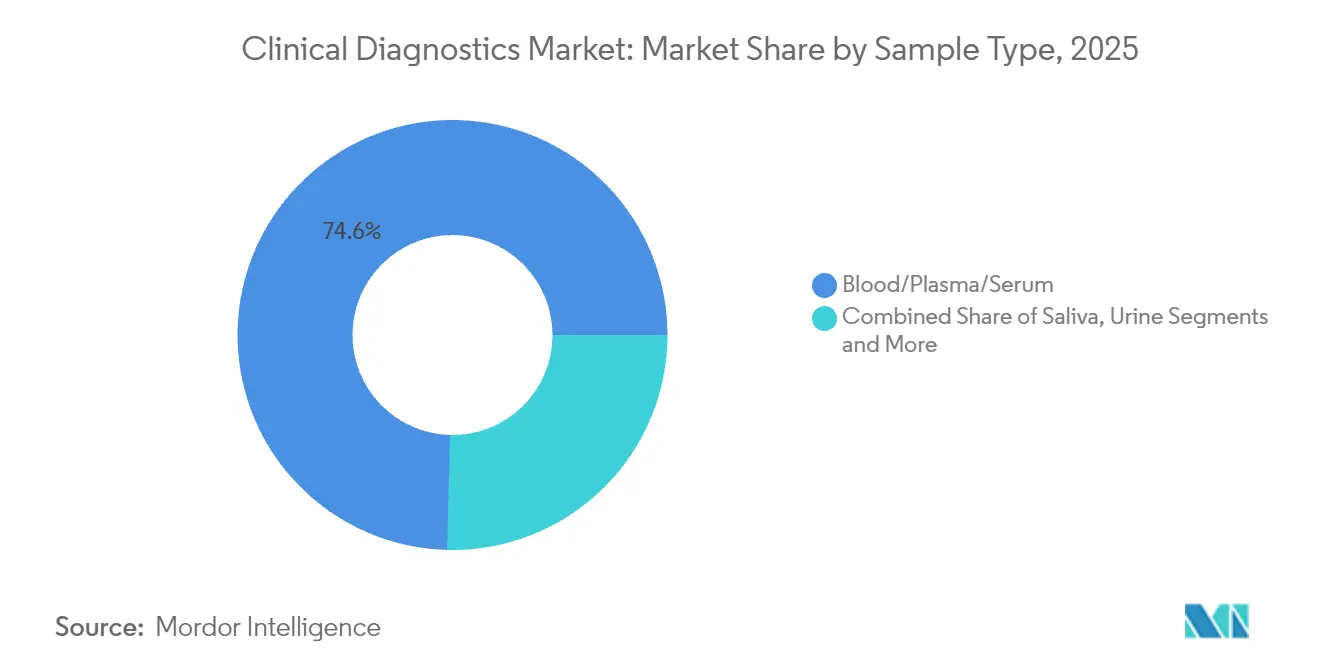
- By sample type, blood/plasma/serum accounted for 74.60% share of the 2025 clinical diagnostics market size; saliva testing is on track for a 10.32% CAGR.
- By setting, centralized clinical laboratories commanded 61.40% share in 2025, yet home-based testing is poised for the strongest 13.48% CAGR.
- By end user, hospital laboratories held 57.65% share in 2025, whereas point-of-care settings show an 11.55% CAGR outlook.
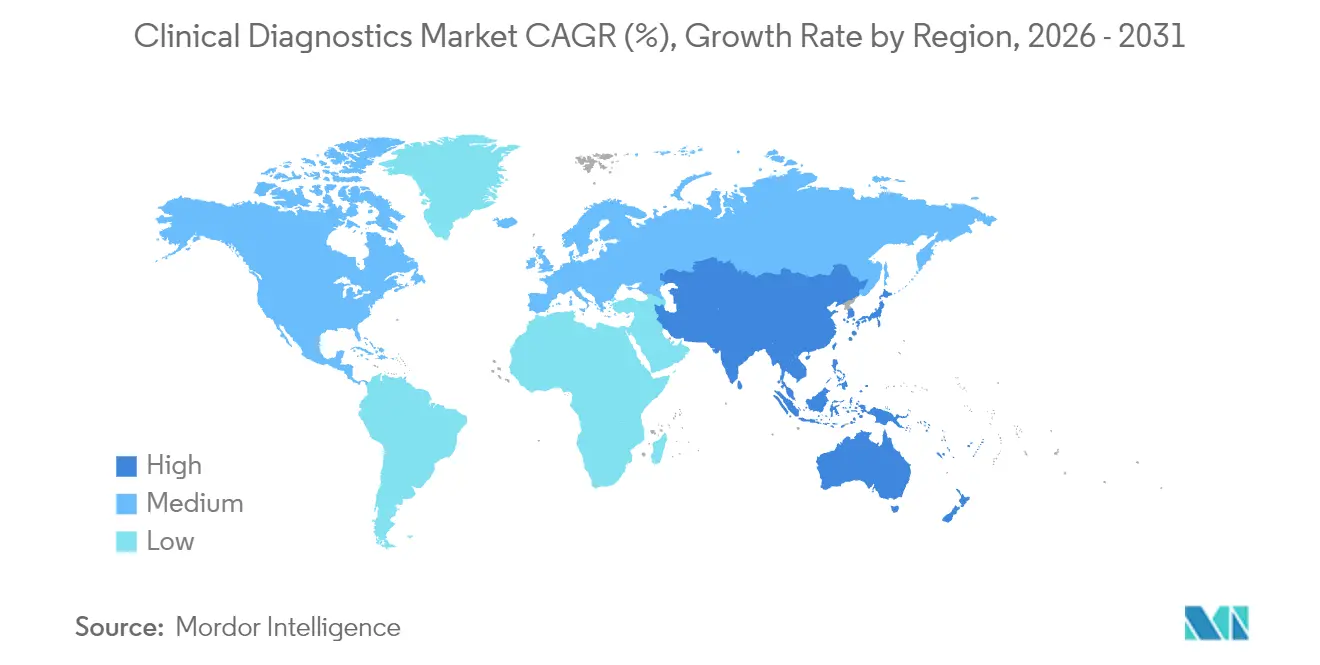
- By geography, North America dominated with 37.98% share in 2025; Asia-Pacific is projected to be the fastest-growing region at 10.14% CAGR.
Note: Market size and forecast figures in this report are generated using Mordor Intelligence’s proprietary estimation framework, updated with the latest available data and insights as of 2026.
Global Clinical Diagnostics Market Trends and Insights
Drivers Impact Analysis*
| Driver | (~) % Impact on CAGR Forecast | Geographic Relevance | Impact Timeline |
|---|---|---|---|
| Rising Prevalence Of Chronic & Infectious Diseases | +1.2% | Global, with highest impact in Asia-Pacific and Middle East | Long term (≥ 4 years) |
| Adoption Of High-Throughput Automated Analyzers | +0.8% | North America & Europe core, expanding to APAC | Medium term (2-4 years) |
| Expansion Of Decentralized Poc Testing In Emerging Markets | +1.1% | APAC, Latin America, and Sub-Saharan Africa | Medium term (2-4 years) |
| AI-Driven Clinical Decision Support Integration | +0.9% | Global, led by North America and Europe | Short term (≤ 2 years) |
| Multi-Omics & Precision Diagnostics Expand Test Menus | +1.0% | Global, concentrated in developed markets initially | Long term (≥ 4 years) |
| Hospital-At-Home Models Fuel Rapid Specimen-To-Answer Demand | +0.7% | North America and Europe, pilot programs in APAC | Short term (≤ 2 years) |
| Source: Mordor Intelligence | |||


AI-Driven Clinical Decision Support Integration
Artificial-intelligence modules now sift millions of anonymized laboratory records to surface subtle diagnostic patterns that human review often misses. Quest Diagnostics’ alliance with Google Cloud cut complex-case error rates by nearly 30% while trimming turnaround times for critical values, prompting providers to view AI capacity as standard infrastructure rather than an add-on[1]Quest Diagnostics, “Google Cloud Collaboration Accelerates AI-Powered Diagnostics,” questdiagnostics.com. Early adopters further gain referral share as physicians gravitate to faster and more confident result-delivery pathways.
Multi-Omics & Precision Diagnostics Expand Test Menus
Guardant Health’s tumor-profiling assay illustrates how layered genomic, proteomic, and metabolomic data sharpen therapy selection and reduce repeated biopsies. Laboratories justify higher up-front costs through consolidated sampling schedules and improved adherence, supporting the shift toward value-based reimbursement where diagnostic precision demonstrably lowers downstream treatment expense.
Hospital-At-Home Models Fuel Rapid Specimen-to-Answer Demand
Ontario Health reports that acute-care-at-home programs cut inpatient cost per episode by 30% yet hinge on assays that match central-lab accuracy within 30 minutes[2]Ontario Health, “Annual Business Plan 2024/25,” ontariohealth.ca. Device makers respond with microfluidic cartridges and Bluetooth-enabled readers capable of multi-analyte panels, allowing clinicians to escalate or de-escalate care without facility transfer delays.
Expansion of Decentralized Point-of-Care Testing in Emerging Markets
The World Health Organization underscores demand for rugged, battery-powered analyzers that tolerate high ambient temperatures and intermittent electricity. Suppliers pivot toward low-margin, high-volume strategies supported by public-private partnerships, integrating mobile-health portals for result transmission across bandwidth-constrained geographies.
Restraints Impact Analysis*
| Restraint | (~) % Impact on CAGR Forecast | Geographic Relevance | Impact Timeline |
|---|---|---|---|
| High Capital Cost Of Advanced Analyzers | -0.6% | Global, most pronounced in emerging markets | Long term (≥ 4 years) |
| Constrained Reimbursement & Cost-Containment Policies | -0.8% | North America and Europe primarily | Medium term (2-4 years) |
| Post-COVID Inventory Glut Slows Instrument Replacement | -0.9% | Global, concentrated in developed markets | Short term (≤ 2 years) |
| Supply-Chain Bottlenecks For Specialty Reagents | -0.5% | Global, with regional variations | Medium term (2-4 years) |
| Source: Mordor Intelligence | |||
Post-COVID Inventory Glut Slows Instrument Replacement
Hospitals bought redundant molecular analyzers to cope with pandemic surges; many now run at 40-60% capacity, delaying new capital allocation. Abbott Laboratories disclosed lower 2025 diagnostics revenue as customers exhaust existing stocks instead of upgrading platforms[3]Abbott Laboratories, “Q1 2025 Earnings Commentary,” abbott.com. Price competition grows, compressing margins and elongating replacement cycles by 18-24 months at larger systems.
Constrained Reimbursement & Cost-Containment Policies
UnitedHealthcare’s 2025 prior-authorization rules and the French government’s 10% routine-test reimbursement cut exemplify mounting payer scrutiny of test value. Laboratories prioritize assays with robust outcome evidence, and manufacturers channel R&D toward health-economic studies to defend premium tests amid tightening coverage criteria.
*Our forecasts treat driver/restraint impacts as directional, not additive. The impact forecasts reflect baseline growth, mix effects, and variable interactions.
Segment Analysis
By Test: Oncology Panels Outpace Routine Screens
Oncology & tumor marker assays are forecast to post a 10.39% CAGR, reflecting pharmaceutical alignment with companion-diagnostic mandates. CBC maintained a 24.24% 2025 clinical diagnostics market share, sustaining base-volume stability in acute and chronic-care pathways.
Expanding multi-parameter oncology panels improve workflow economics by consolidating biomarkers, while lipid profiles face substitution risk from handheld devices that satisfy primary-care turnaround criteria. Infectious-disease menus normalize after pandemic highs yet remain critical in antimicrobial-resistance surveillance programs.


By Product: Software Becomes the Value Needle-Mover
Reagents & kits delivered 64.98% of 2025 revenue, yet data-management software is on track for a 10.62% CAGR as laboratories digitize quality control and regulatory audit trails. Instruments now ship with open APIs that allow middleware to orchestrate sample routing, reagent allocation, and result release in real time, extending asset life amid capital-spending caution. Competitive bidding squeezes reagent margins, prompting vendors to bundle informatics subscriptions that lock in customer loyalty through workflow efficiencies rather than physical consumables.
By Technology: Molecular Platforms Lead the Innovation Curve
Immunoassay & immunochemistry held 32.25% share of the 2025 clinical diagnostics market size, but molecular diagnostics is forecast to climb at a 12.05% CAGR on AI-assisted pathogen detection and next-generation sequencing cost decline. Automation of hematology cell-imaging and digital coagulation endpoints reduces manual review, while mass-spectrometry niches such as toxicology command premium pricing in reference labs.
By Sample Type: Saliva and Other Non-Invasive Specimens Gain Traction
Blood-based testing still represents 74.60% of current volume, yet saliva assays exhibit a 10.32% CAGR as home-collection kits improve compliance and pediatric acceptance. Urine and tissue biopsies retain relevance for nephrology and oncology workflows, while micro-sweat and breath condensate sampling emerge in metabolic disorder screening pilots that could broaden the clinical diagnostics market in underserved cohorts.
By Setting: Home Testing Redraws the Logistics Map
Centralized labs leverage economies of scale for complex panels, but home-based kits are set to grow 13.48% annually as reimbursement frameworks evolve to support remote monitoring. Point-of-care carts inside emergency departments now integrate hematology, chemistry, and molecular modules, cutting admission decisions by up to 60 minutes and redirecting lower-acuity cases to outpatient channels.
By End User: Point-of-Care Gains at the Expense of Inpatient Labs
Hospital laboratories accounted for 57.65% of 2025 revenue but face share leakage to point-of-care sites, projected to expand 11.55% per year. Independent labs differentiate through specialty test portfolios, whereas physician-office units secure patient convenience advantages in chronic-disease follow-ups.
Geography Analysis
North America retained 37.98% 2025 share on high per-capita spending, but Asia-Pacific’s 10.14% CAGR underscores widening access and rising chronic-disease incidence. Asia-Pacific is projected to add more than USD 15.62 billion in incremental revenue between 2026 and 2031, buoyed by public-hospital expansion, universal-health-coverage rollouts, and local manufacturing incentives that reduce test cost per capita. Government subsidies encourage decentralized platforms that mitigate specialist shortages in rural districts, allowing the clinical diagnostics market to tap first-time users and drive double-digit unit growth. Multinationals partner with provincial authorities to establish reagent-filling facilities aimed at circumventing import tariffs and shortening lead times.
North America, while mature, remains a technology bellwether. AI-enabled molecular panels and home-specimen logistics have moved from pilot programs to system-wide protocols at integrated-delivery networks. Yet reimbursement constraints and prior-authorization mandates temper volume growth. Laboratories respond by pairing precision oncology tests with real-world-evidence dossiers that justify value under outcome-based contracts. Consolidation persists as regional health systems outsource routine work to large reference labs that optimize scale and invest in next-generation informatics.
Europe faces divergent trajectories: northern countries channel preventive-care budgets into cardiovascular and metabolic-disease screening, whereas southern nations grapple with fiscal austerity that limits adoption of high-priced molecular assays. The European Union’s In Vitro Diagnostic Regulation (IVDR) further elevates compliance requirements, prompting smaller manufacturers to exit sub-scale product lines. Still, aging demographics assure steady baseline volume, and cross-border collaborations on rare-disease diagnostics sustain specialized test demand.

Regulatory Landscape
Clinical diagnostics operates under converging device and laboratory frameworks, with a tightening spotlight on software and evidence. In the European Union, the In Vitro Diagnostic Regulation (IVDR) transition remains a central compliance driver: Regulation (EU) 2024/1860 (June 2024) extended transitional timelines for legacy devices (Class D to December 2027, Class C to December 2028, and Class B and Class A sterile to December 2029), while manufacturers still need to meet conditions tied to quality management systems and timely submissions to notified bodies to retain market access.
In the United States, the FDA has continued clarifying oversight boundaries for software functions used alongside diagnostics, including updated Clinical Decision Support Software guidance in January 2026 that further distinguishes which CDS capabilities fall under FDA oversight. In China, the National Medical Products Administration (NMPA) has strengthened manufacturing governance, with a revised Good Manufacturing Practice for Medical Devices (released December 2025) taking effect on November 1, 2026. The update reinforces lifecycle risk management and adds more technology-integrated controls that affect diagnostics manufacturing and supply readiness for regulated assays.
Competitive Landscape
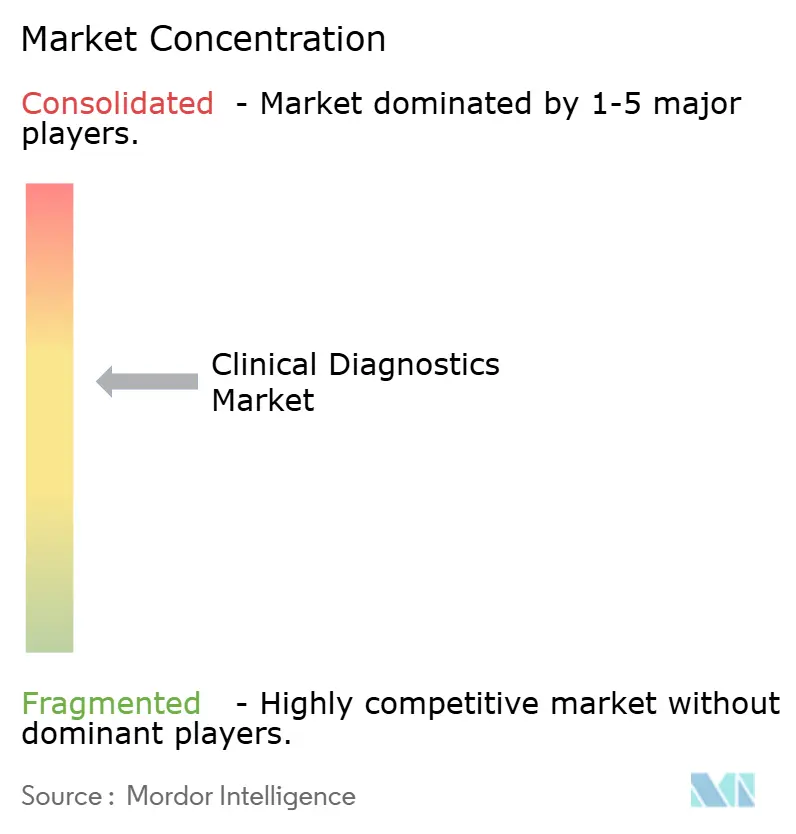
Global competition remains moderately concentrated as the top five vendors account for a significant share of 2024 revenue. Abbott, Roche, Danaher-owned Beckman Coulter, and others defend incumbency through continual menu expansion, automation upgrades, and software bundling. Danaher’s DXC500i analyzer, cleared by the FDA in March 2025, delivers faster throughput and lower sample-carryover, reinforcing its chemistry franchise. Roche extends its cobas line with an AI-assisted viral-load algorithm that reduces invalid-run rates.
Strategic partnerships proliferate. Quest Diagnostics aligns with Google Cloud to embed machine-learning pipelines within its national laboratory information network, targeting stroke risk-prediction algorithms that could be white-labeled for hospital clients. Labcorp teams with Ultima Genomics to accelerate low-cost whole-genome sequencing, while bioMérieux acquires SpinChip Diagnostics to strengthen rapid-test capabilities at the patient bedside.
New entrants concentrate on narrow but high-growth niches such as liquid biopsy, exosome sequencing, and multi-cancer early detection. Capital flows favor platforms that marry biomarker discovery with vertically integrated informatics, minimizing dependency on incumbent analyzers. However, scaling challenges remain: reimbursement hurdles, clinical-utility evidence, and distribution in established hospital formularies slow disruptive share capture. Incumbents increasingly adopt “buy-or-ally” tactics, acquiring promising startups to fill technology gaps while maintaining brand trust and global regulatory infrastructure.
Clinical Diagnostics Industry Leaders
Bio-Rad Laboratories Inc.
Danaher Corporation (Beckman Coulter, Cepheid)
F. Hoffmann-La Roche AG
Abbott Laboratories
bioMerieux SA
- *Disclaimer: Major Players sorted in no particular order

Market Opportunities and Future Outlook
Two near-term whitespace areas are becoming more actionable: (1) regulated, interoperable diagnostic software that fits within clearer policy boundaries, and (2) decentralized testing models that preserve central-lab quality while improving turnaround. In the US, renewed legislative activity around laboratory-developed tests, including introduction of the Enhancing Clinical Laboratory Innovation and Access (CLIA) Act of 2026 (H.R. 8890) in May 2026, points to demand for governance models that match how laboratories validate and deploy assays. For vendors, this supports bundling assay performance evidence, analytics, and audit-ready data-management tooling for CLIA environments.
In Europe, IVDR execution continues to shape where commercial effort concentrates, backed by standardization and notified-body infrastructure work, such as Implementing Regulation (EU) 2026/977 (May 2026) on uniform quality-management requirements for notified bodies and the June 2026 updates to harmonized standards (Implementing Decisions (EU) 2026/1231 and 2026/1313). Provider throughput expansion without footprint expansion also points to demand for modular automation and integrated platforms, evidenced by Vanderbilt Health's June 2026 installation of Roche cobas pro integrated solutions, which doubled testing capacity in the same space. Reimbursement-linked adoption is also visible in emerging biomarker categories, with Anthem Blue Cross and Blue Shield initiating coverage (effective July 1, 2026) for Quanterix's LucentAD Complete Alzheimers blood test, indicating a clearer route for high-sensitivity assays that can show clinical utility and align with payer policy.
Recent Industry Developments
- July 2026: Beckman Coulter Diagnostics received CE Mark under IVDR for its Access p-Tau217 blood test for amyloid pathology evaluation and also introduced an Access BD-pTau217 research-use-only assay. The approvals broaden menu depth for neurodegenerative testing and reinforce the companys ability to maintain European access under IVDR for advanced biomarker assays.
- May 2026: Roche entered into a definitive merger agreement to acquire PathAI, aiming to integrate digital pathology and AI-powered diagnostic capabilities into its Diagnostics business. The transaction strengthens the link between anatomic pathology workflows and clinical diagnostics informatics, supporting higher-throughput interpretation and standardized reporting as labs scale precision-medicine testing.
- March 2025: Danaher received FDA clearance for the Beckman Coulter DXC500i chemistry analyzer, expanding its mid-volume chemistry offering with higher throughput and workflow improvements. The clearance supports competitive replacement and consolidation cycles in core clinical chemistry as laboratories balance automation upgrades against capital-spending scrutiny.


Research Methodology Framework and Report Scope
Market Definition and Coverage
For this study, the clinical diagnostic market is defined as revenues generated from routine and specialized clinical testing used to detect, monitor, and manage diseases. This includes instruments and test reagents used across laboratory and near-patient settings.
Scope exclusions: We exclude purely research-use-only testing materials and non-clinical screening services that are not part of standard patient care pathways.
Segmentation Overview
- By Test
- Lipid Panel
- Liver Panel
- Renal Panel
- Complete Blood Count (CBC)
- Electrolyte Testing
- Infectious Disease Testing
- Oncology & Tumor Marker Testing
- Companion Diagnostics
- Other Tests
- By Product
- Instruments/Analyzers
- Reagents & Kits
- Data-Management Software & Services
- By Technology
- Clinical Chemistry
- Immunoassay & Immunochemistry
- Molecular Diagnostics
- Hematology
- Coagulation & Hemostasis
- Microbiology
- Urinalysis
- Others (Mass-Spec, Flow Cytometry)
- By Sample Type
- Blood/Plasma/Serum
- Urine
- Saliva
- Tissue/Biopsy
- Other Specimens
- By Setting
- Centralized Clinical Laboratories
- Point-of-Care Testing Sites
- Home-based Testing
- By End User
- Hospital Laboratories
- Independent Diagnostic Laboratories
- Point-of-Care Settings
- Physician Office Laboratories
- Other End Users
- Geography
- North America
- United States
- Canada
- Mexico
- Europe
- Germany
- United Kingdom
- France
- Italy
- Spain
- Rest of Europe
- Asia-Pacific
- China
- Japan
- India
- South Korea
- Australia
- Rest of Asia-Pacific
- Middle East and Africa
- GCC
- South Africa
- Rest of Middle East and Africa
- South America
- Brazil
- Argentina
- Rest of South America
- North America
Data Sources, Market Sizing, and Validation
Desk Research
Desk research starts with mapping what is being tested and where testing happens, then aligning that to measurable demand signals. We use public sources such as the World Health Organization, the US CDC, and the World Bank to understand disease burden, testing guidance, and healthcare access trends that move test volumes.
To ground the supply side, we review sources such as the US FDA device databases, OECD health statistics, and publications in peer-reviewed clinical laboratory journals for technology shifts, approval patterns, and workflow changes between central labs and point-of-care. We also use company annual reports, earnings decks, and reputable press to understand pricing direction, mix shifts across assays, and capacity additions, which are then cross-checked using paid subscriptions for company financials and patent databases where needed. These examples are illustrative only, and many additional sources were used for data collection, validation, and clarification.
Primary Interviews and Surveys
Primary work focuses on validating test mix, price movement, and where demand is getting created across hospital labs, independent labs, and decentralized settings. We speak with assay, instrument, and distribution stakeholders across APAC, EMEA, and the Americas, so assumptions from desk research can be corrected and uncertain inputs can be triangulated before finalizing the model.
Distribution of primary research fieldwork respondents
| Company type | Respondent position | Region |
|---|---|---|
| Top tier: 39% | CXOs: 17% | APAC: 48% |
| Mid tier: 42% | Functional/Unit leaders: 37% | EMEA: 30% |
| Smaller Players: 19% | Managers: 46% | Americas: 22% |
Market-Sizing & Forecasting
Sizing is built using top-down and bottom-up logic together. The top-down view is anchored on a demand pool reconstructed from healthcare activity and testing intensity, then translated into diagnostic spend by linking chronic disease prevalence, aging population share, and healthcare utilization to routine panel volumes and specialized infectious disease testing.
After that ceiling is built, totals are corroborated with selective bottom-up approximations such as sampled price times volume checks for high-frequency panels, instrument install-base direction, and reagent pull-through patterns reported by stakeholders. Key inputs that typically move the model include the share of centralized versus point-of-care testing, reimbursement and out-of-pocket mix by region, average selling price changes for reagents, automation penetration in labs, and adoption speed for higher-sensitivity assays. Where bottom-up inputs are patchy for smaller markets, gaps are handled by using peer-market proxies, then stress-testing the implied per-test spend against interview feedback.
Forecasting uses scenario analysis supported by trend lines in the above variables, followed by an exponential smoothing pass to avoid overreacting to one-time spikes in testing. Assumptions are tuned so short-term swings in infectious testing do not distort the longer-run trajectory of routine diagnostics demand.
Data Validation & Update Cycle
Validation is done through stepwise triangulation. Model outputs are compared against independent signals such as public healthcare spend direction, regulatory activity, and observed pricing pressure in reagents. When an outlier shows up, it is traced back to a specific driver, and the assumption is rechecked through a follow-up with experts or by revisiting the underlying public series.
Before sign-off, the model and narrative go through multi-step internal reviews so logic, math, and scope alignment remain consistent across regions and test types. Reports are refreshed annually, and interim updates are made when material events occur, such as major regulatory changes, reimbursement shifts, or step changes in lab utilization. Right before delivery, a final pass is completed so clients receive the latest updated view.
Mordor Intelligence's Clinical Diagnostic Market Size Compared With Other Published Estimates
Published market sizes for clinical diagnostics can look far apart even when the topic sounds identical. Each publisher draws the market boundary differently and uses a different mix of test volumes, pricing logic, and year definitions. Differences also show up depending on whether a model emphasizes centralized lab workflows or blends in a wider set of clinical services.
By tracking test-setting splits and updating reagent price erosion assumptions, Mordor Intelligence sits closer to the defined instruments plus reagents demand pool, which reduces inflation from adjacent imaging services or broad healthcare spending proxies.
Benchmark comparison
| Source | Market Size | Gaps in Research Methodology |
|---|---|---|
| Mordor Intelligence | USD 93.59 B (2026) | |
| Global Consultancy A | USD 115.51 B (2024) | Uses an earlier base year and a broader clinical diagnostics definition that can implicitly absorb wider lab service revenues and different currency timing, which lifts the headline value versus a tighter product revenue scope. |
| Industry Consultancy B | USD 105.92 B (2024) | Organizes sizing around testing workflows and technology domains, which can count a wider mix of decentralized and peripheral testing categories, and it may apply different assumptions for average selling price progression through 2030. |
The spread is mainly explained by boundary choices and base-year alignment, followed by how pricing is moved forward for reagents and how much decentralized testing is treated as incremental versus substituted from central labs. When the scope is kept consistent and each driver is tied back to a measurable signal, the final value becomes easier to replicate and update without rewriting the full model each year.


Key Questions Answered in the Report
How large is the clinical diagnostics market in 2026?
The clinical diagnostics market size is USD 93.59 billion in 2026, with a projected value of USD 121.76 billion by 2031.
Which testing segment is growing the fastest?
Oncology and tumor marker assays are forecast to expand at a 10.39% CAGR through 2031.
What product category shows the highest growth rate?
Data-management software and services lead with a 10.62% CAGR as laboratories digitize workflows.
Why is Asia-Pacific viewed as the key growth region?
Government healthcare investments, rising chronic-disease incidence, and expanding middle-class access drive a 10.14% CAGR in the region.
How is AI influencing diagnostic laboratories?
AI reduces complex-case error rates, accelerates turnaround times, and now forms part of core laboratory infrastructure rather than optional add-ons.
What is the outlook for home-based diagnostic testing?
Home-based testing is expected to grow 13.48% per year as reimbursement models and remote-care programs gain traction.
Page last updated on:




