Market Overview
| Study Period | 2020 - 2031 |
|---|---|
| Forecast Data Period | 2026 - 2031 |
| Historical Data Period | 2020 - 2024 |
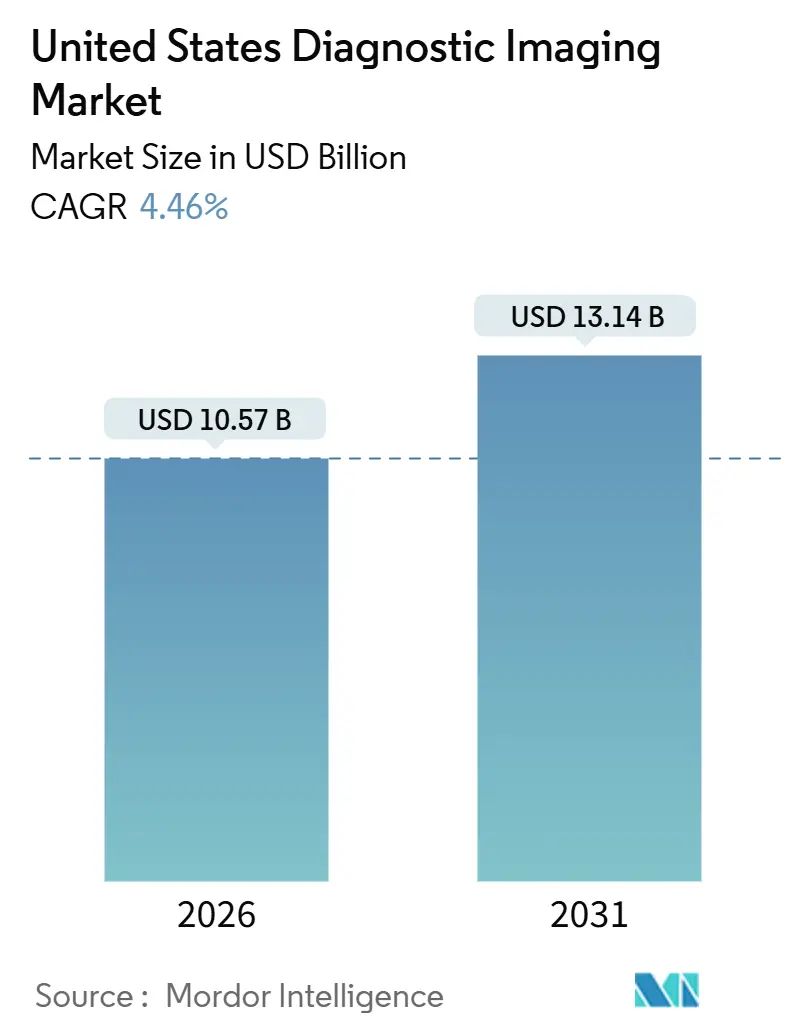
| Market Size (2026) | USD 10.57 Billion |
| Market Size (2031) | USD 13.14 Billion |
| Growth Rate (2026 - 2031) | 4.46% CAGR |
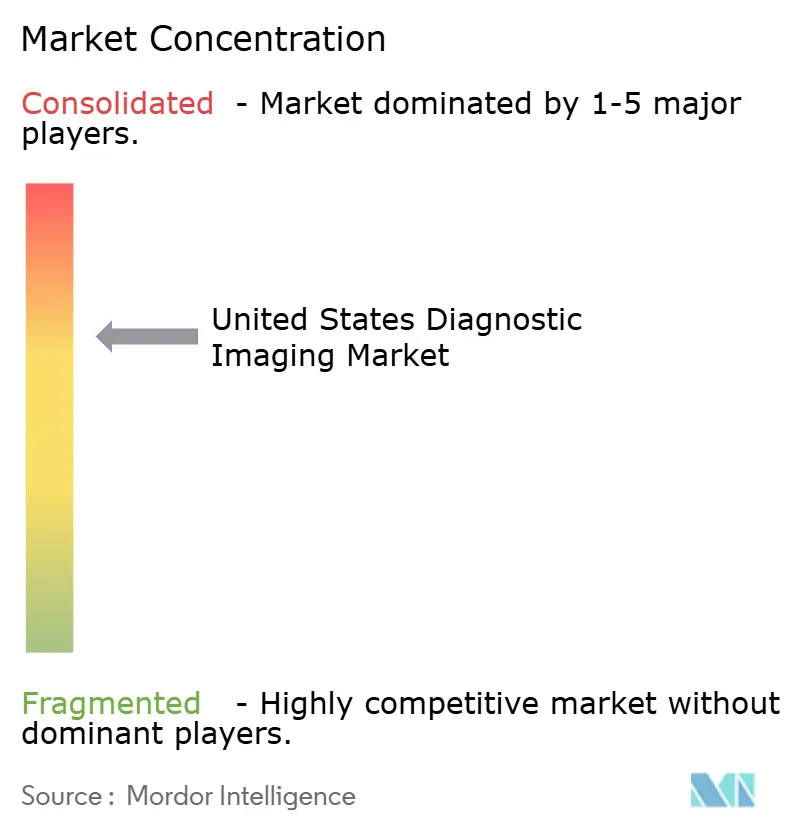
| Market Concentration | Medium |
Major Players *Disclaimer: Major Players sorted in no particular order Image © Mordor Intelligence. Reuse requires attribution under CC BY 4.0. | |
United States Diagnostic Imaging Market Analysis by Mordor Intelligence
The United States Diagnostic Imaging Market size is estimated at USD 10.57 billion in 2026, and is expected to reach USD 13.14 billion by 2031, at a CAGR of 4.46% during the forecast period (2026-2031).
Sustained demand comes from an aging population, payer-led shifts toward outpatient settings, and rapid AI uptake that already supports interpretation of one-quarter of advanced scans. Federal programs such as Cancer Moonshot 2.0 and ARPA-H collectively inject USD 35 million into precision-imaging pilots, while reimbursement incentives reward low-dose and value-based protocols. Hospitals extend equipment life cycles from seven to ten years to protect margins after site-neutral payment cuts, yet they continue licensing cloud PACS and triage algorithms to overcome a looming 35,600-radiologist shortfall [ACR.ORG]. Consolidation characterizes hardware, but software remains fragmented as point-solution vendors secure niche contracts inside existing PACS.
Key Report Takeaways
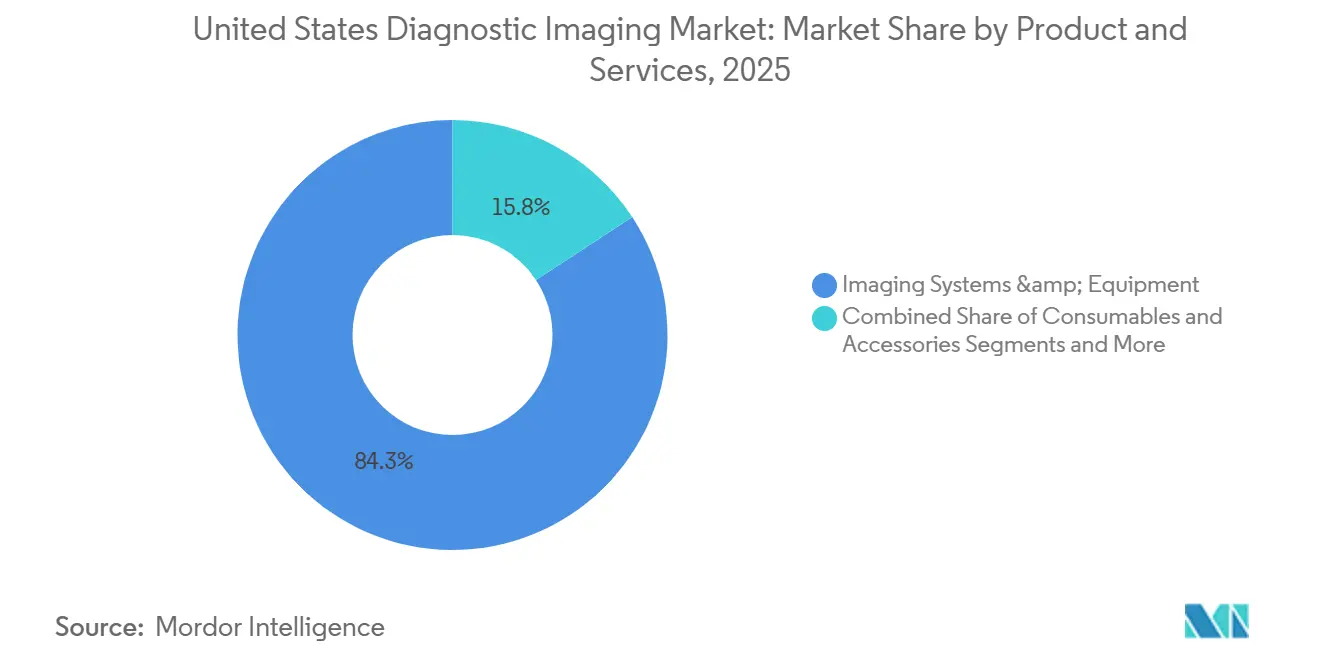
- By product and services, Imaging Systems and Equipment controlled 84.25% revenue in 2025, whereas Software and Services is advancing at a 16.73% CAGR through 2031, the fastest pace in the United States diagnostic imaging market.
- By application, Cardiology led with 33.63% procedure share in 2025; Neurology and Neurodegenerative Disorders is forecast to expand at a 15.18% CAGR through 2031.
- By end user, Hospitals accounted for 68.26% spending in 2025, while Ambulatory Surgical Centers show the highest growth at 13.32% CAGR through 2031.
- By technology, Conventional platforms held 84.13% of the United States diagnostic imaging market share in 2025, whereas AI-enabled systems are rising at a 13.58% CAGR to 2031.
Note: Market size and forecast figures in this report are generated using Mordor Intelligence’s proprietary estimation framework, updated with the latest available data and insights as of January 2026.
United States Diagnostic Imaging Market Trends and Insights
Drivers Impact Analysis*
| Driver | (~) % Impact on CAGR Forecast | Geographic Relevance | Impact Timeline |
|---|---|---|---|
| AI-driven workflow and image interpretation adoption | +0.8% | National, focused in academic medical centers and large IDNs | Medium term (2-4 years) |
| Shift of imaging volumes to outpatient and ambulatory settings | +0.9% | National, fastest in Texas, Arizona, Florida | Short term (≤ 2 years) |
| Rapid penetration of portable and handheld ultrasound/X-ray systems | +0.5% | Rural and underserved counties nationwide | Medium term (2-4 years) |
| CMS site-neutral payment expansion favoring lower-cost imaging sites | +0.7% | Medicare and Medicare Advantage populations | Short term (≤ 2 years) |
| Reimbursement incentives for low-dose and value-based imaging | +0.4% | National | Long term (≥ 4 years) |
| Federal investments in cancer and neurodegenerative diagnostics | +0.3% | NIH-designated centers and ARPA-H hubs | Long term (≥ 4 years) |
| Source: Mordor Intelligence | |||
AI-Driven Workflow and Image Interpretation Adoption
FDA clearances for radiology algorithms climbed to 87 in 2024, a 40% jump over 2023. Health systems deploy these tools to reallocate radiologist time toward higher-revenue interventional cases. Aidoc’s triage platform cuts door-to-diagnosis time in stroke protocols by 30%.[1]Aidoc, “Ochsner Stroke Data One-Pager,” Aidoc, aidoc.com Integration remains a hurdle because legacy PACS need custom APIs, and community hospitals lack informatics teams to validate outputs locally. The FDA now requires demographic-stratified performance metrics, a change that lengthens submissions but favors vendors embedding AI inside scanners. Consequently, platform manufacturers bundle algorithms with hardware, locking in service contracts and extending the reach of the United States diagnostic imaging market.[2]GE HealthCare, “CareIntellect,” GE HealthCare, gehealthcare.com
Shift of Imaging Volumes to Outpatient and Ambulatory Settings
Ambulatory surgical centers deliver imaging at 30-40% lower cost per scan than hospital outpatient departments, attracting Medicare Advantage steerage that drives 13.32% CAGR through 2031. Site-neutral payment expansion in 2025 collapsed a USD 300 margin gap per lumbar spine MRI to roughly USD 50, pressuring hospital economics. Freestanding centers now perform 22% of non-hospital imaging, up from 18% in 2020, with growth strongest in states that repealed Certificate-of-Need laws. Hospitals respond by converting owned clinics into off-campus departments, but CMS tightened distance definitions, rendering 8% of legacy sites ineligible for hospital rates, a shift reshaping the United States diagnostic imaging market.
Rapid Penetration of Portable and Handheld Ultrasound/X-ray Systems
Handheld ultrasound shipments reached 180,000 units in 2025, a 60% rise since 2023, led by Butterfly iQ3 and GE HealthCare’s Vscan Air. Cloud-linked probes guide placement and flag anomalies, letting primary-care teams triage before ordering formal studies. Rural hospitals adopt portable X-ray to avoid patient transfers, reducing movement by 15%. CMS parity reimbursement for portable ultrasound removed a payment barrier. Accuracy gaps persist: a 2024 JACR study showed handhelds missed 12% of small pleural effusions versus 3% with cart systems.[3] Peter E. Morris, Anne K. Kelly, and Michael F. Morris, “Handheld Versus Cart-Based Ultrasound for Small Pleural Effusion Detection,” Journal of the American College of Radiology, jacr.org New FDA guidance mandates transparency on algorithm training data, elevating standards for the United States diagnostic imaging market.
CMS Site-Neutral Payment Expansion Favoring Lower-Cost Imaging Sites
Equalized reimbursement for 11 new imaging codes in 2025 accelerated divestiture of hospital-owned centers, with systems selling 14% of off-campus sites to operators like RadNet and Akumin. Medicare Advantage prior-authorization funnels patients to preferred networks, raising independent center volumes. Hospitals attempt to preserve facility fees by rebranding clinics, but revised 250-yard rules curtail eligibility. These shifts redistribute capital and volume across the United States diagnostic imaging market.
Restraints Impact Analysis*
| Restraint | (~) % Impact on CAGR Forecast | Geographic Relevance | Impact Timeline |
|---|---|---|---|
| Shortage of radiologists and technologists | -0.6% | National, acute in rural zones | Medium term (2-4 years) |
| Prolonged FDA clearance cycle for AI algorithms and novel modalities | -0.3% | National | Medium term (2-4 years) |
| Capital-intensive nature of high-end MRI/CT systems | -0.4% | Independent centers and rural hospitals | Long term (≥ 4 years) |
| Price transparency and No-Surprises Act squeezing provider margins | -0.5% | Hospital outpatient departments and ED imaging | Short term (≤ 2 years) |
| Source: Mordor Intelligence | |||
Shortage of Radiologists and Technologists
A projected 35,600-radiologist gap by 2034 coincides with 12,000 unfilled technologist roles in 2025, raising reliance on USD 75-150 per-study teleradiology. Burnout affects 42% of radiologists, primarily from case overload and administrative tasks. AI triage saves 10-15% reading time but still demands human oversight. CMS caps on residency funding persist, and scope-of-practice expansions face state opposition, prolonging workforce scarcity that restrains the United States diagnostic imaging market.
Prolonged FDA Clearance Cycle for AI Algorithms and Novel Modalities
Average 510(k) review spans six months, while De Novo routes last 12 months, delaying commercialization. Draft 2025 guidance adds demographic-specific validation requirements, extending timelines further. Small firms lack regulatory infrastructure, tilting advantage toward incumbents. Breakthrough designation aided only 12 radiology devices in 2024, indicating limited relief. This bottleneck reduces the pace of innovation reaching the United States diagnostic imaging market.
*Our forecasts treat driver/restraint impacts as directional, not additive. The impact forecasts reflect baseline growth, mix effects, and variable interactions.
Segment Analysis
By Product and Services: Software Gains as Labor Costs Climb
Software and Services is projected to grow at a 16.73% CAGR, the quickest stride within the United States diagnostic imaging market. Cloud PACS, AI triage, and predictive-maintenance subscriptions appeal to hospitals facing workforce shortages. Imaging Systems and Equipment still accounts for 84.25% of 2025 revenue, anchored by MRI and CT units that cost USD 500,000-3 million. Deferred replacement cycles temper hardware growth but augment service contracts.
Predictive maintenance via GE HealthCare’s CareIntellect curbs downtime by 30%, trimming USD 50,000 annually per scanner. Siemens’ AI-Rad Companion cuts reading time to four minutes, supporting under-resourced radiology groups. Portable X-ray and handheld ultrasound commoditize entry-level imaging, while Cancer Moonshot-backed PET expansion maintains niche high-end demand, shaping revenue streams within the United States diagnostic imaging market.


By Application: Neurology Surges on Alzheimer’s Diagnostics
Cardiology captured 33.63% of 2025 procedures, reflecting prevalent coronary disease and heart failure management. Neurology, driven by blood-based Alzheimer’s markers funneling patients to amyloid-PET, is forecast to grow at a 15.18% CAGR through 2031, the fastest pace in the United States diagnostic imaging market. Oncology benefits from broadened lung-screening criteria that doubled the eligible cohort to 14.5 million adults.
Musculoskeletal MRI faces Medicare fee cuts, pushing centers toward higher-margin joints. Women's health imaging gains from earlier mammography age recommendations, raising tomosynthesis adoption to 75% of sites. Long-COVID keeps high-resolution CT in pulmonology workflows. AI lung-nodule tools trim false negatives by 20% yet require PACS integration funding, illustrating divergent adoption speeds inside the United States diagnostic imaging market.
By End User: Ambulatory Centers Capture Elective Volume
Hospitals retained 68.26% spending in 2025, but payer steerage lifts ambulatory centers at 13.32% CAGR, almost triple overall growth. Independent diagnostic testing facilities now perform 22% of scans and capitalize on lower cost structures under the Physician Fee Schedule.
Physician offices invest in in-house imaging for ancillary revenue, yet Stark Law dictates ownership constraints. VA facilities depend on teleradiology to serve rural clinics but lag in equipment refresh. RadNet’s acquisition of 18 centers in 2024-25 consolidates coastal markets, while Akumin expands across Sun Belt states, evidencing competitive dynamism in the United States diagnostic imaging market.

By Technology: AI Adoption Accelerates Despite Integration Friction
Conventional systems still dominate with 84.13% 2025 share, but AI-enabled platforms are advancing at 13.58% CAGR. Deep-learning MRI reconstruction halves scan time, boosting throughput amid staffing constraints. Philips overlays real-time ultrasound guidance, cutting biopsy errors by 25%.
Aidoc and RapidAI reached 1,000 and 1,600 U.S. hospitals, respectively, yet lack direct reimbursement, relying on subscriptions that health systems scrutinize. FDA clearance cycles provide incumbents an edge, but software-native entrants iterate faster, sustaining competition across the United States diagnostic imaging market.
Geography Analysis
Outpatient migration occurs nationwide but is most pronounced in Texas, Arizona, and Florida, where Certificate-of-Need repeals enabled a 25% surge in freestanding MRI and CT suites between 2023 and 2025. These Sun Belt states now host the densest cluster of new ambulatory imaging centers, attracting capital from private-equity groups that seek scale advantages in the United States diagnostic imaging market.
Midwestern rural counties struggle with radiologist shortages and depend on portable ultrasound and teleradiology services. The VA prioritizes tele-interpretation contracts in Montana and the Dakotas, adding redundancy for critical findings communication. ARPA-H’s POSEIDON program sites early portable PET trials in Kansas and Iowa oncology clinics, although cyclotron access remains limited.
Northeastern academic hubs - Massachusetts, New York, Pennsylvania - draw the bulk of federal research grants, concentrating photon-counting CT trials and Alzheimer’s neuroimaging studies. However, price transparency rules spur employers in these states to steer non-urgent scans to lower-cost New Hampshire and Delaware facilities, redistributing regional volume inside the United States diagnostic imaging market.
Regulatory Landscape
In the United States, diagnostic imaging systems and related software are regulated as medical devices by the FDA under the Center for Devices and Radiological Health (CDRH), with market entry commonly routed through 510(k) clearance and, for novel products, De Novo pathways. In June 2026, the FDA finalized a classification in 21 CFR 892.2055 for radiological machine learning-based quantitative imaging software that includes a predetermined change control plan, placing it in Class II with special controls and outlining a clearer regulatory pathway for certain AI-enabled imaging software updates.
Coverage and payment decisions also drive adoption, led by the Centers for Medicare and Medicaid Services (CMS) through the Physician Fee Schedule and the Hospital Outpatient Prospective Payment System (HOPPS). In April 2026, CMS and the FDA announced the RAPID coverage pathway to better align FDA market authorization with Medicare coverage for eligible Breakthrough Devices, while CMS reimbursement policy continues to evolve, including the 2027 HOPPS proposed rule released in July 2026, which proposes changes affecting nuclear medicine APC organization and diagnostic radiopharmaceutical payment thresholds.
Value Chain Analysis
The value chain runs from modality and component suppliers (detectors, coils, tubes, generators) to OEM design and manufacturing (CT, MRI, X-ray, ultrasound, nuclear medicine, mammography), software providers (PACS, VNA, RIS, AI triage and reconstruction), distributors and service organizations, and end users such as hospitals, IDTFs, ambulatory surgical centers, and physician offices. Post-sale revenue is reinforced through multi-year service contracts, uptime guarantees, and software subscriptions, and cloud enterprise imaging plus AI are increasingly positioned as operational infrastructure for managing throughput under staffing constraints.
Key pressure points include capital intensity for high-end modalities and supply-chain exposure from globally sourced components. Providers also face a growing need for interoperability and integration resources on-site. Policy-driven shifts in where imaging is performed, including site-neutral reimbursement reforms, influence procurement toward lower-cost settings, supporting standardized, scalable deployments and vendor bundles that reduce integration burden. Recent FDA clearances for advanced CT technologies, such as GE HealthCare's March 2026 510(k) clearance for Photonova Spectra photon-counting CT, show how innovation often flows from component advances to OEM platforms and then into provider purchasing cycles via upgrades, service, and software enablement.
Competitive Landscape
Siemens Healthineers, GE HealthCare, and Philips together command roughly half of installed hardware revenue, reflecting moderate concentration. Their strategy bundles AI modules with scanners, creating switching costs that deter defection. Point-solution software vendors such as Aidoc, RapidAI, and Qure.ai penetrate through PACS integrations without hardware swap-outs, fragmenting the algorithm tier.
Butterfly Network undercuts ultrasound pricing at USD 1,999, broadening clinician access. Ezra markets direct-to-consumer whole-body MRI at USD 1,800, bypassing traditional referral chains. RadNet and Akumin pursue acquisition-fueled scale, pooling purchasing, billing, and teleradiology. Regulatory complexity favors incumbents: dedicated FDA teams trim clearance timelines 40% against startups. Patent filings in dose-reduction AI surged, with Siemens lodging 24 applications in 2024, signaling continued R&D lead.
White-space persists in interventional suites lacking AI catheter guidance and in rural 3D mammography adoption, where Federally Qualified Health Centers lag. Portable PET remains a niche given USD 1 million device costs and radiochemistry hurdles. Overall, competitive maneuvering shapes both hardware and software poles of the United States diagnostic imaging market.
United States Diagnostic Imaging Industry Leaders
FUJIFILM Holdings Corporation
GE Healthcare
Koninklijke Philips NV
Siemens Healthineers
Canon Medical Systems
- *Disclaimer: Major Players sorted in no particular order

Market Opportunities and Future Outlook
A near-term whitespace is forming at the intersection of AI-enabled imaging software and enterprise workflow, where clearer regulatory pathways and interoperability efforts can reduce deployment friction at scale. The FDA's June 2026 final classification for certain radiological machine learning-based quantitative imaging software under Class II special controls (21 CFR 892.2055) creates a more standardized compliance route for vendors using predetermined change control plans, supporting faster iteration cycles for imaging analytics that must work across heterogeneous PACS and scanner fleets.
Capacity expansion and service-line differentiation remain active opportunity areas as providers add advanced CT and MRI capability beyond major academic hubs. In June 2026, Roper St. Francis Healthcare completed a multi-year expansion at Berkeley Hospital in South Carolina that doubled imaging capacity by adding a second CT and a new MRI unit, while expanding interventional radiology services. In July 2026, UPMC Jameson expanded local access by adding cardiac CT and a wide-bore MRI system in Pennsylvania. Together, these investments highlight demand for turnkey deployments that combine equipment with staffing efficiency tools (cloud PACS, protocol automation, AI triage) and service support to keep new capacity productive amid radiologist and technologist shortages.
Recent Industry Developments
- July 2026: Canon Medical Systems USA introduced CLEAR Motion across the Aquilion ONE CT portfolio and expanded use of its Precise IQ Engine (PIQE) 1024 Matrix deep learning reconstruction. The rollout targets motion-robust image quality and workflow efficiency, supporting differentiation for high-throughput CT sites facing outpatient volume migration.
- April 2026: RadNet formed a joint venture with Saint Alphonsus Health System to operate five outpatient imaging centers in Boise, Idaho. The partnership strengthens RadNet's outpatient footprint and can improve payor-network positioning and scale benefits in scheduling, billing, and utilization management.
- August 2025: DeepHealth, a RadNet subsidiary, secured FDA clearance for TechLive to enable centralized remote scanning supervision across MR, CT, PET/CT, and ultrasound. The capability supports standardized scanning operations across multi-site networks and helps mitigate technologist staffing gaps by extending expert oversight beyond a single facility.


Research Methodology Framework and Report Scope
Market Definition and Coverage
For this study, the market covers revenue earned from diagnostic imaging systems and equipment, along with related consumables, accessories, and software and services, used to capture internal body images for clinical diagnosis in the United States.
Scope exclusions: We exclude non-imaging diagnostics and general hospital equipment that do not directly support image acquisition, processing, storage, or viewing.
Segmentation Overview
- By Product and Services
- Imaging Systems and Equipments
- X-ray
- Ultrasound
- Magnetic Resonance Imaging (MRI)
- Computed Tomography (CT)
- Nuclear Medicine
- Mammography
- Fluoroscopy & C-arms
- Consumables and Accessories
- Software and Services
- Imaging Systems and Equipments
- By Application
- Cardiology
- Oncology
- Neurology & Neurodegenerative Disorders
- Orthopedics & Musculoskeletal
- Gastroenterology & Hepatology
- Women’s Health & Obstetrics/Gynecology
- Pulmonology & Thoracic Imaging
- By End User
- Hospitals
- Independent Diagnostic Imaging Centers (IDTFs)
- Ambulatory Surgical Centers
- Physician Offices & Clinics
- Veterans Affairs & Federal Facilities
- Research Institutes & CROs
- By Technology
- AI-Enabled
- Conventional Systems
Data Sources, Market Sizing, and Validation
Desk Research
Desk research was used to set the market boundaries and to get consistent time series signals that can be checked year after year. We mainly relied on public sources such as CDC utilization statistics, CMS payment and physician fee schedule references, FDA device and safety communications, and NIH and peer reviewed clinical literature to understand modality adoption and clinical demand.
On the supply and pricing side, we reviewed items such as company annual reports, investor presentations, press releases, and association publications that discuss installed base, product mix, and technology shifts like AI-enabled imaging. In addition, we used paid subscriptions focused on company financials and intelligence, news and financials, and patent databases to standardize company mapping and to confirm major launches and replacement cycle signals. These sources are indicative and not exhaustive, and many other public references were also used for data collection, cross-checks, and clarification.
Primary Interviews and Surveys
Primary discussions were conducted with participants across imaging equipment and software supply, hospital and outpatient buying teams, and service and maintenance stakeholders so assumptions on volumes and price realization could be confirmed. Since this is a United States-only market, the fieldwork emphasized payer and provider dynamics, replacement timing, and modality mix differences across major care settings to close gaps left by public data.
Distribution of primary research fieldwork respondents
| Company type | Respondent position | Region |
|---|---|---|
| Top tier: 28% | CXOs: 12% | |
| Mid tier: 56% | Functional/Unit leaders: 35% | |
| Smaller Players: 16% | Managers: 53% |
Market-Sizing & Forecasting
The core build uses a top-down demand pool reconstruction, where procedure volumes and care setting mix are translated into modality demand and then mapped to revenue across equipment, consumables, and software and services. To keep totals realistic, selective bottom-up checks were then used, such as supplier revenue direction checks, sampled average selling price (ASP) times unit movement logic for key modalities, and channel feedback on service attach rates.
Key inputs that shape the model include imaging procedure growth by modality, equipment installed base and replacement cycles, average system ASP progression (including discounting patterns in large accounts), software and service attach and renewal rates, and the shift toward outpatient settings like IDTFs and ASCs. When data is thin for smaller categories, gaps are handled using proxy ratios anchored to observed mix in similar modalities, followed by expert confirmation so the model does not over-state niche demand.
For forecasting, scenario analysis is used to blend macro signals with market-specific levers, and then to stress test results under different replacement timing and utilization outcomes. Assumptions are aligned to what interviewees expect for reimbursement stability, patient throughput, and technology refresh, and results are only carried forward when they remain consistent with the visible utilization and procurement signals.
Data Validation & Update Cycle
Outputs are validated through multiple checks, where totals are compared against independent indicators like utilization direction, procurement patterns, and reported financial performance from relevant participant groups. When large variances show up, the assumptions behind volumes, ASPs, or attach rates are revisited, and follow-up outreach is triggered to confirm what changed and why.
Each report goes through multi-step analyst reviews before sign-off, including variance checks across years and consistency checks between segments. Reports are refreshed annually, with interim updates when major policy shifts, pricing changes, or technology launches materially move demand. Before delivery, a final pass is completed to reflect the latest available inputs so clients receive an up-to-date view.
Mordor Intelligence's United States Diagnostic Imaging Market Size Compared With Other Published Estimates
Published market values for US diagnostic imaging often do not match because firms use different timing for prices and currency treatment, and they also vary on what they count as imaging revenue. Another common reason is that some estimates lean heavily on one data stream, which can miss real-world discounting and replacement delays.
A refresh-led difference shows up when ASP logic is updated with the latest contracting patterns and when year boundaries are kept consistent across equipment, consumables, and software and services, which is why the 2026 value used here can sit apart from older base-year figures reported elsewhere, a check applied by Mordor Intelligence.
Benchmark comparison
| Source | Market Size | Gaps in Research Methodology |
|---|---|---|
| Mordor Intelligence | USD 10.57 B (2026) | |
| Trade Publisher A | USD 8.20 B (2024) | Uses an earlier base year and can mix older ASP points with current volumes, and the scope presentation emphasizes modality equipment which can undercount ongoing software and service revenues tied to the installed base. |
| Industry Analysis Firm B | USD 9.86 B (2024) | Reported in USD millions for 2024 and may treat product mix and renewals differently, which can shift totals when service attach, upgrades, and replacement cycle timing are not refreshed in the same year as utilization signals. |
The spread across the three figures mostly comes from base-year selection and how frequently pricing and attach assumptions are refreshed, rather than from a single demand driver. By keeping inputs traceable to procedure signals, replacement timing, and updated ASP expectations, the estimate here stays easier to replicate and to reconcile during planning discussions.


Key Questions Answered in the Report
What is the current value of the United States diagnostic imaging market?
The United States diagnostic imaging market size is USD 10.57 billion in 2026 and is projected to reach USD 13.14 billion by 2031.
Which application segment is expanding fastest?
Neurology and Neurodegenerative Disorders imaging shows the highest CAGR at 15.18% through 2031, propelled by Alzheimer’s diagnostics.
How are site-neutral payment rules affecting providers?
CMS equalized reimbursement for additional imaging codes in 2025, compressing hospital margins and accelerating volume shifts to freestanding centers.
What role does AI play in imaging growth?
FDA-cleared algorithms already assist one-quarter of advanced scans and drive a 13.58% CAGR for AI-enabled systems, notably in triage and image reconstruction.
Why are handheld ultrasound devices gaining traction?
Units priced below USD 10,000 enable point-of-care imaging in primary-care and rural settings, cutting patient transfers and broadening access.
Page last updated on:


