Medical Device Technologies Market Size and Share
Market Overview
| Study Period | 2020 - 2031 |
|---|---|
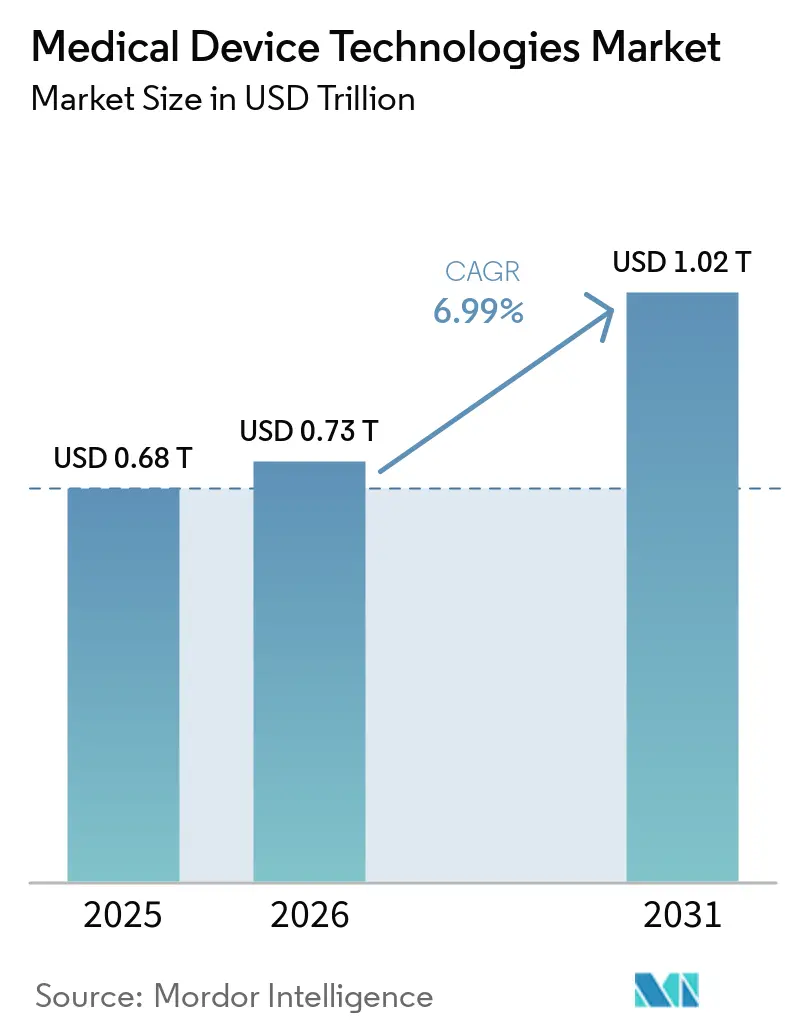
| Market Size (2026) | USD 0.73 Trillion |
| Market Size (2031) | USD 1.02 Trillion |
| Growth Rate (2026 - 2031) | 6.99% CAGR |
| Fastest Growing Market | Asia Pacific |
| Largest Market | North America |
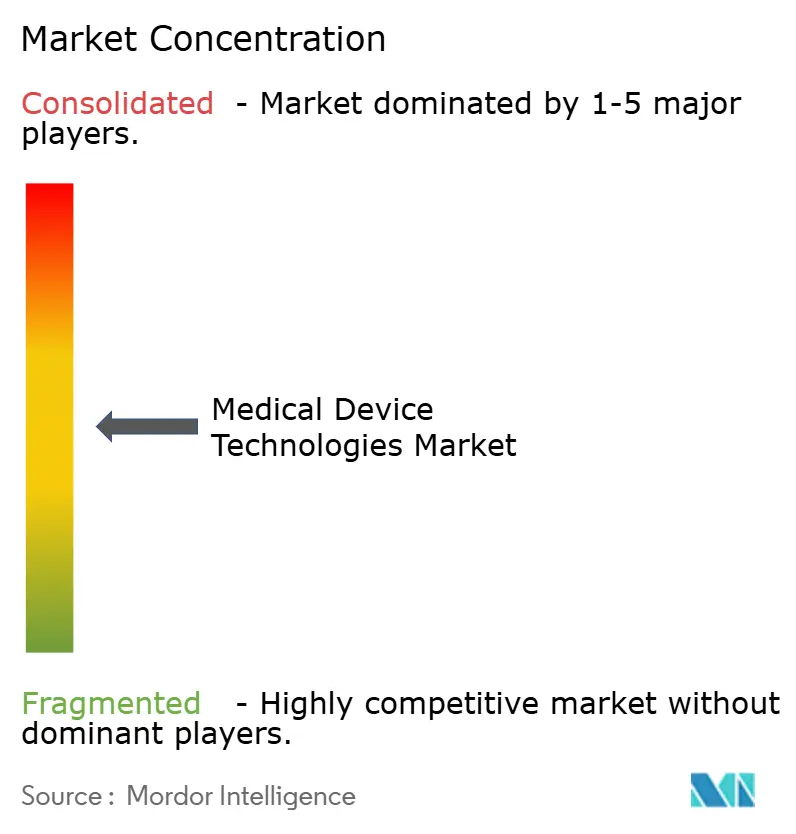
| Market Concentration | Medium |
Major Players *Disclaimer: Major Players sorted in no particular order Image © Mordor Intelligence. Reuse requires attribution under CC BY 4.0. | |
Medical Device Technologies Market Analysis by Mordor Intelligence
The medical device technologies market size is projected to expand from USD 0.68 trillion in 2025 and USD 0.73 trillion in 2026 to USD 1.02 trillion by 2031, registering a CAGR of 6.99% between 2026 to 2031. Demand is being reshaped by artificial-intelligence validation entering routine regulatory pathways, reimbursement that rewards real-world evidence, and supply-chain relocation away from rare-earth vulnerabilities. U.S. regulators cleared 168 machine-learning devices in 2024, with 94.6% passing through the 510(k) pathway, a signal that AI-enabled tools have moved from proof-of-concept to commercial norm [1]U.S. Food and Drug Administration, “Artificial Intelligence and Machine Learning-Enabled Medical Devices,” fda.gov. Medicare’s expansion of remote-monitoring codes accelerated the adoption of connected sensors, while hospital-at-home programs unlocked new endpoints of care. Manufacturers are also redesigning platforms around nanocoatings and smart materials that curb device-associated infections, a clinical problem still costing the U.S. system USD 9.8 billion each year.
Key Report Takeaways
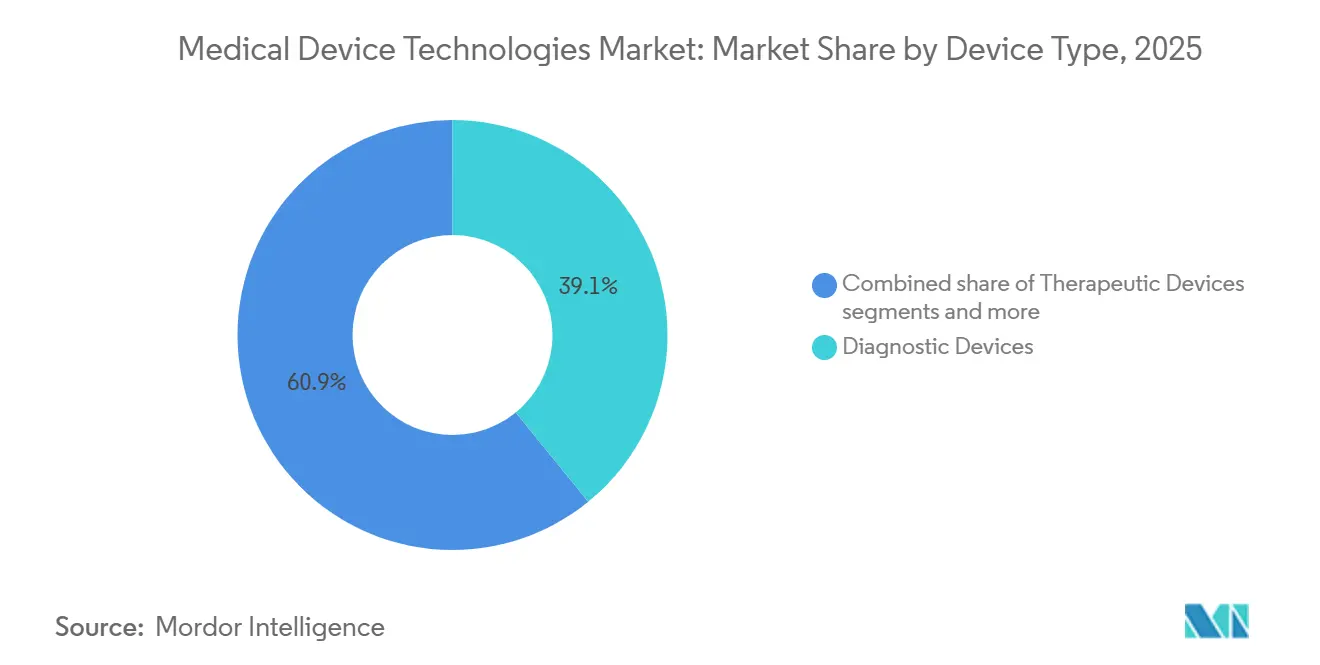
- By device type, Diagnostic Devices led with 39.12% of revenue in 2025, while Monitoring Devices are on track to expand at a 7.23% CAGR through 2031.
- By technology platform, Conventional Electro-mechanical & Disposable systems held 55.9% of the medical device technologies market share in 2025; Nanotechnology & Smart Materials are advancing at an 8.11% CAGR to 2031.
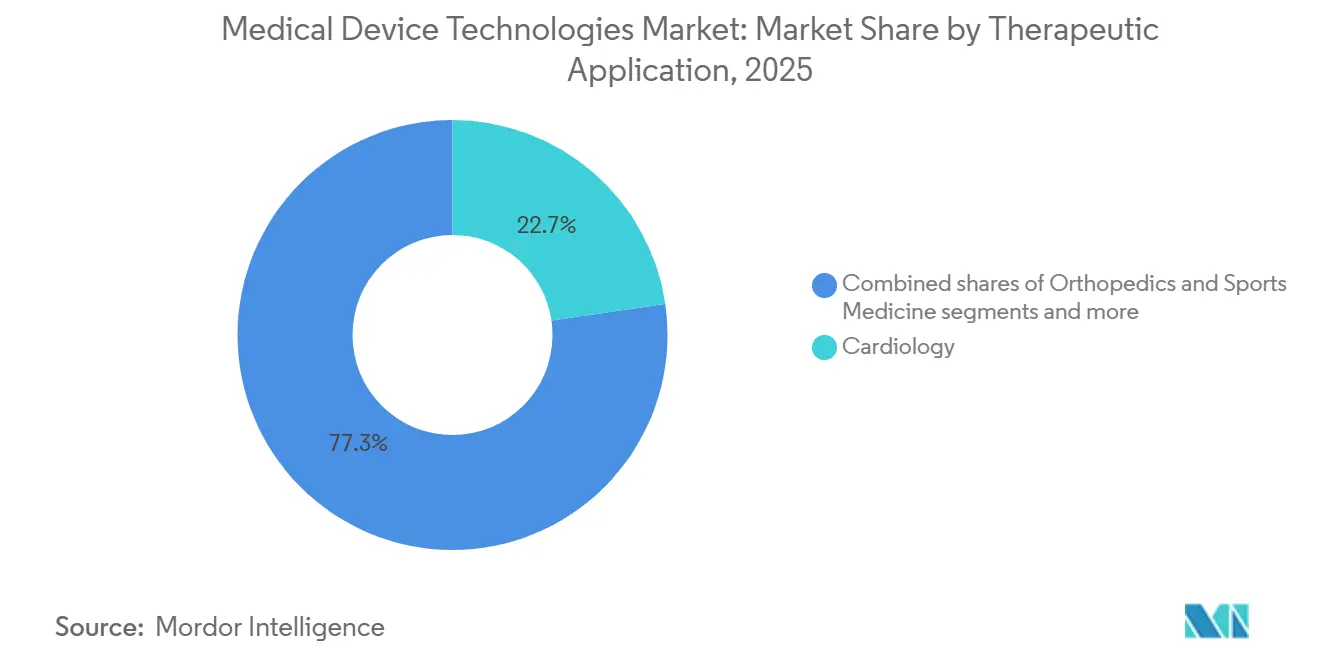
- By therapeutic area, Cardiology retained a 22.7% share of the medical device technologies market size in 2025, and Neurology is growing fastest at 7.63% to 2031.
- By end user, Hospitals controlled 66.1% of demand in 2025, whereas Ambulatory Surgical Centers are projected to grow at 7.99% through 2031.
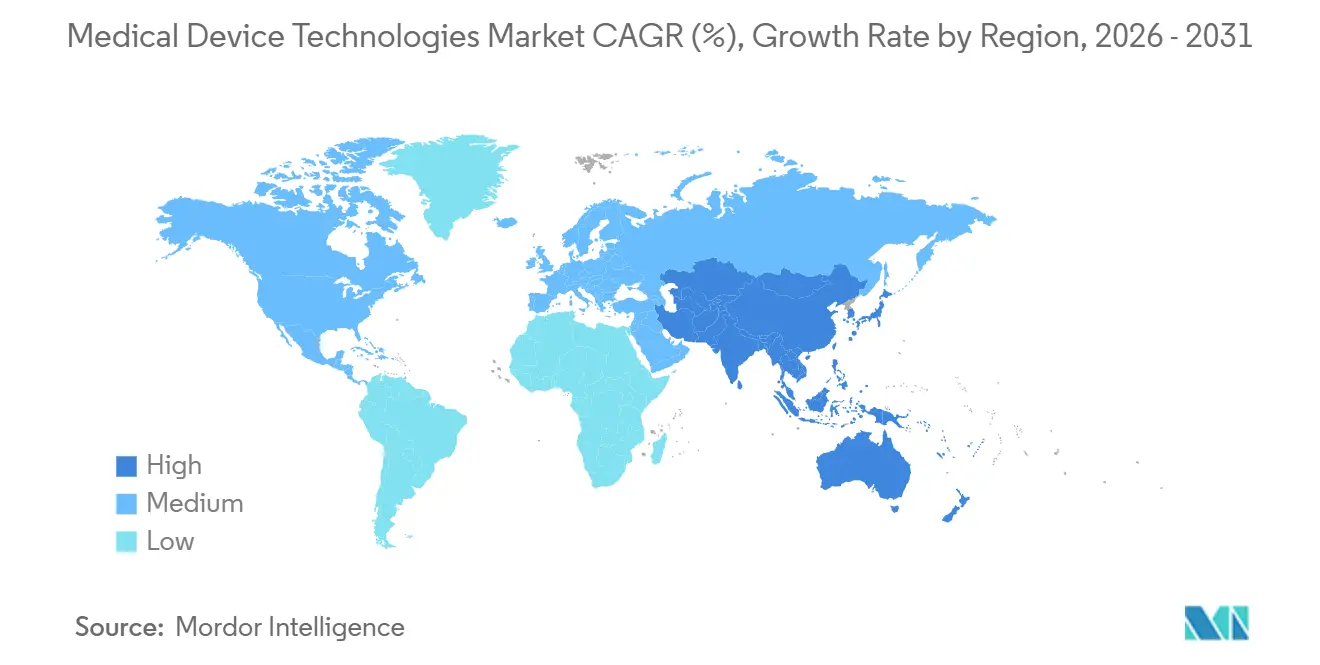
- By region, North America captured 45.3% of revenue in 2025, yet Asia-Pacific carries the highest forecast CAGR at 7.56% to 2031.
Note: Market size and forecast figures in this report are generated using Mordor Intelligence’s proprietary estimation framework, updated with the latest available data and insights as of January 2026.
Global Medical Device Technologies Market Trends and Insights
Driver Impact Analysis*
| Driver | (~) % Impact on CAGR Forecast | Geographic Relevance | Impact Timeline |
|---|---|---|---|
| Aging population & rise in chronic diseases | +1.2% | Global, highest in North America, Europe, East Asia | Long term (≥ 4 years) |
| Technological convergence in minimally invasive & AI-enabled devices | +1.5% | North America, EU; APAC scaling post-2027 | Medium term (2-4 years) |
| Healthcare infrastructure expansion in emerging markets | +1.0% | Core APAC, spill-over to MEA, South America | Long term (≥ 4 years) |
| Rapid uptake of wearable & remote-monitoring devices | +0.9% | North America dominates; EU, APAC urban centers scaling | Short term (≤ 2 years) |
| Digital twins & in-silico trials shortening R&D cycles | +0.6% | North America, EU; pilots in Japan | Medium term (2-4 years) |
| Point-of-care 3-D printing enabling just-in-time implants | +0.4% | North America, EU; emerging GCC, Australia | Medium term (2-4 years) |
| Source: Mordor Intelligence | |||
Aging Population & Rise in Chronic Diseases
By 2030, 1.4 billion people worldwide will be aged 60 or older, up 40% versus 2020 [2]World Health Organization, “Ageing and Health,” who.int. Chronic illnesses already drive 74% of all deaths, ensuring sustained need for cardiac monitors, continuous-glucose devices, and infusion technologies. Extended life expectancy no longer translates into shorter illness phases; instead, patients live longer with multiple comorbidities, multiplying device use per capita. A typical 75-year-old with heart failure, diabetes, and osteoarthritis may concurrently rely on a cardiac monitor, CGM, and orthopedic brace, tripling hardware requirements per person. Payers shifting toward capitated payments now reward manufacturers that bundle hardware with predictive-analytics software able to minimize readmissions.
Technological Convergence in Minimally-Invasive & AI-Enabled Devices
The FDA’s 2025 draft guidance on Predetermined Change Control Plans lets firms update algorithms inside preset safety envelopes without refiling a 510(k), reducing update cycles by six to nine months [3]U.S. Food and Drug Administration, “Predetermined Change Control Plans,” fda.gov. Robotic surgery consoles now layer real-time tissue classification on force-feedback instruments, ultrasound probes auto-generate cardiac views, and navigation systems overlay CT reconstructions with sub-millimeter accuracy. Intuitive Surgical’s da Vinci 5 pulls procedure data from an installed base of 8,600 systems to refine motion algorithms, giving incumbents with large datasets a defensible moat versus later entrants.
Healthcare Infrastructure Expansion in Emerging Markets
Asia’s healthcare outlays could rise from USD 3.2 trillion in 2020 to USD 5.7 trillion by 2030; medical devices alone may double to USD 213-225 billion over the decade. India’s Production-Linked Incentive has earmarked INR 30 billion (USD 360 million) for domestic production, and China fast-tracked 47 innovative devices in 2024, cutting local approval time to nine months. Multinationals are co-developing hepatitis diagnostics and altitude-specific monitors, while regional firms reverse-engineer premium features into mid-tier price points, winning tenders in tier-2 cities. Solar-powered ultrasound and battery-backed ventilators are narrowing access gaps where one billion people still rely on clinics without reliable electricity.
Rapid Uptake of Wearable & Remote-Monitoring Devices
Remote-monitoring reimbursement drove 71 million Americans, 26% of eligible beneficiaries, to adopt RPM platforms by late 2025. Hospital-at-home programs, active in 419 U.S. facilities, now deliver acute care with continuous vital-sign sensors and portable imaging, trimming episode costs 20-30%. Next-generation CGMs broadcast readings every minute, cutting severe hypoglycemia by 40% in trials and expanding coverage to insulin-dependent type-2 diabetes. Yet fewer than one-third of RPM devices integrate seamlessly with electronic health records, an interoperability gap that still forces clinicians to juggle proprietary dashboards.
Restraints Impact Analysis*
| Restraint | (~) % Impact on CAGR Forecast | Geographic Relevance | Impact Timeline |
|---|---|---|---|
| Stringent & fragmented regulatory pathways | -0.8% | Global; EU MDR, China NMPA highest friction | Medium term (2-4 years) |
| Reimbursement cuts & pricing pressure | -0.7% | North America, Europe | Short term (≤ 2 years) |
| Cyber-security liability shifts | -0.5% | North America & EU | Short term (≤ 2 years) |
| Rare-earth material supply constraints | -0.3% | Global MRI, CT vendors | Medium term (2-4 years) |
| Source: Mordor Intelligence | |||
Stringent & Fragmented Regulatory Pathways
EU MDR pushed legacy-device transition to 2028, yet only 34 notified bodies remain, down from 58, stretching recertification to 18-24 months. Small firms face EUR 50,000-200,000 per-device costs that often exceed remaining product revenue, prompting 30-40% of Class IIa/IIb SKUs toward withdrawal. China’s priority track drops approval to nine months but forces parallel dossiers distinct from FDA or EU templates, increasing overhead 25-35%. Japan’s PMDA now supports digital-health pathways, although local patient data are still required, delaying launches 12-18 months.
Reimbursement Cuts & Pricing Pressure
CMS proposes a 2.5% cut to 2025 outpatient payments and reinstated a 2.3% excise tax in 2024, stripping 4-5% off margins. Bundled payments push hospitals to negotiate deeper discounts and swap premium implants for mid-tier alternatives. International reference pricing in Europe clipped device prices 8-12% between 2020-2024. Private U.S. insurers demand cost-effectiveness data, slowing access by up to a year after FDA clearance. Premium suppliers now bundle analytics and remote monitoring to defend price points, while value brands shift manufacturing to Southeast Asia.
*Our forecasts treat driver/restraint impacts as directional, not additive. The impact forecasts reflect baseline growth, mix effects, and variable interactions.
Segment Analysis
By Device Type: Diagnostics Anchor Revenue, Monitoring Drives Growth
Diagnostic Devices accounted for 39.12% of the medical device technologies market share in 2025, supported by large installed bases of MRI, CT, and ultrasound, plus high-margin consumables. Monitoring Devices are forecast to grow at 7.23% annually, eclipsing overall market growth as hospital-at-home and remote-patient-monitoring programs proliferate. Therapeutic Devices ride aging demographics and minimally invasive trends; transcatheter valve procedures expanded 22% year-over-year in 2024. Surgical ecosystems revolve around Intuitive’s da Vinci, Medtronic’s Hugo, and J&J’s forthcoming Ottava, each selling proprietary tooling that yields 40-50% margins.
Photon-counting CT reduces radiation significantly while capturing 0.2 mm resolution, letting radiologists replace multi-phase protocols with a single scan. AI-powered handheld ultrasound priced below USD 3,000 broadens use beyond imaging departments. In-vitro panels now detect up to 30 pathogens from a single sample, enabling same-visit treatment. Assistive devices remain regionally fragmented, though myoelectric prosthetics gain traction as reimbursement frameworks mature in Germany, Japan, and select U.S. states.


By Technology Platform: Conventional Dominates, Nanotechnology Accelerates
Conventional Electro-mechanical & Disposable systems held 55.9% of 2025 revenue, reflecting the entrenchment of pumps, ventilators, and single-use instruments purchased under five-year group-purchasing contracts. Nanotechnology & Smart Materials are climbing at an 8.11% CAGR, led by antimicrobial coatings that cut central-line infections significantly in trials and biosensors tracking glucose, lactate, and pH in vivo. Wearable ECG monitors cleared by the FDA reached 47 models in 2024, and consumer devices such as the Apple Watch achieved 98% specificity for atrial-fibrillation screening.
Robotic platforms bifurcate into multiport cancer systems and single-port urology rigs; Intuitive’s SP gained approval for transoral oncology in 2024, unlocking a USD 2 billion sub-segment. 3-D printing has shifted from prototyping to serial production of porous titanium cages with 95% osseointegration at one year. AR/VR overlays now guide spine surgeons, trimming screw-placement errors by 40%. AI-as-a-Medical-Device surpassed 1,300 U.S. authorizations by end-2025, 74% in radiology, each carrying its own CPT code and recurring software revenue stream.
By Therapeutic Application: Cardiology Leads, Neurology Surges
Cardiology retained 22.7% of 2025 revenue as transcatheter valves, leadless pacemakers, and left-atrial-appendage closures scaled to 1.2 million U.S. procedures. Neurology is advancing at 7.63% CAGR, fueled by responsive neurostimulation that cut seizure frequency 75% over nine years and early brain-computer-interface trials showing 95% decoding accuracy. Ophthalmology benefits from trifocal intraocular lenses delivering spectacle independence two years post-implant. Oncology devices span robotic resections, stereotactic radiosurgery, and drug-infusion pumps, with 12 FDA approvals in 2024 targeting solid tumors.
By End User: Hospitals Dominate, ASCs Gain Share
Hospitals commanded 66.1% of revenue in 2025 owing to capital-equipment cycles and service contracts. Ambulatory Surgical Centers are expected to grow at 7.99% through 2031 as CMS approves high-acuity procedures like total hip replacement and cardiac catheterization for same-day reimbursement. Clinics adopt point-of-care diagnostics that cut referral leakage, while home-healthcare settings are equipping for ventilated heart-failure and pneumonia care under hospital-at-home waivers reimbursed at inpatient parity. Laboratory chains leverage high-throughput analyzers and automation to deliver significantly lower per-test costs than hospital labs.
Geography Analysis
North America held 45.3% of 2025 revenue, supported by USD 4.5 trillion in U.S. health spend and an FDA framework that allows iterative AI updates without new 510(k) filings, slicing half a year off time-to-market. Medicare’s RPM codes drove 71 million users, and private payers broadened CGM coverage to 8 million insulin-dependent type-2 diabetics. Canada’s single-payer bargaining suppresses prices 10-15% but offers predictable access, while Mexico’s nearshoring and new public-hospital spending push 8-10% annual growth despite 12–18-month approvals at COFEPRIS.
Asia-Pacific is forecast to grow at 7.56% CAGR, paced by China’s nine-month priority pathway and India’s INR 30 billion manufacturing incentive. Japan faces 29% of its population over 65, fueling demand for robotic exoskeletons and home ventilators; the PMDA’s 2024 digital pathway clipped software approval to 12 months. South Korea invested KRW 500 billion in AI diagnostics and robotics; Australia harmonized pathways with the FDA and the EU, slashing duplicate costs by 30-40%. Southeast Asian nations attract contract manufacturing as Chinese wages rise, with Medtronic and Abbott opening a Vietnam assembly in 2024.
Europe generated significant share of global revenue in 2025, but MDR bottlenecks have created 18–24-month queues that threaten the legacy Class II devices. Germany’s NUB pathway gives temporary reimbursement pending health-technology assessment, often ahead of France or the U.K. post-Brexit UKCA adds complexity despite an MHRA fast track shaving 3-6 months from approvals. The GCC funds medical-tourism hubs, with Saudi Arabia alone allocating SAR 100 billion to build 20 new hospitals. South Africa’s private networks buy premium equipment, though public budgets lag. Brazil grows notablly annually via expedited reviews for maternal-health and tropical-disease tools.

Competitive Landscape
The medical device technologies market is moderately concentrated: the top 10 multinationals held the majority of global revenue, leaving ample room for regional challengers. Incumbents are buying AI startups—Medtronic paid USD 738 million for Affera—to infuse algorithms into mature hardware. Pure-play medtechs are moving upstream into software subscriptions, as Abbott’s FreeStyle Libre ecosystem now generates USD 5 billion in sensor and analytics revenue annually. Southeast Asian contract manufacturers sporting ISO 13485 certifications now bid for OEM work once dominated by Western suppliers, trimming gross margins by up to eight percentage points.
Disruptors such as Butterfly Network bypass hospital capital budgets with USD 2,000 handheld ultrasound units, selling 100,000 devices by 2024. Intuitive Surgical’s 2 million annual robotic procedures feed machine-learning loops that competitors may need half a decade to match. Patent activity in AI-enabled diagnostics jumped significantly year-over-year in 2024, with Siemens Healthineers, GE HealthCare, and Philips controlling a significant share of granted deep-learning image-reconstruction patents. Interoperability standards exist, ISO/IEEE 11073 for RPM and IEC 81001-5-1 for cybersecurity, yet under 30% of wearable sensors connect seamlessly to electronic records, bottlenecking clinical workflow gains.
Medical Device Technologies Industry Leaders
Koninklinje Philips NV
Medtronic PLC
Johnson & Johnson Services Inc.
Abbott
GE HealthCare
- *Disclaimer: Major Players sorted in no particular order

Recent Industry Developments
- January 2026: Boston Scientific obtained FDA clearance for the Farapoint pulsed-field-ablation catheter, a device intended for use with the previously approved Farapulse platform to expand treatment options for paroxysmal and persistent atrial fibrillation
- January 2026: Johnson & Johnson submitted the OTTAVA Robotic Surgical System for De Novo classification, seeking U.S. marketing authorization for multiple general-surgery procedures in the upper abdomen after completing its IDE study.
- December 2025: Abbott received FDA approval for the Volt pulsed-field-ablation system for atrial fibrillation and announced plans to begin commercial cases in the United States while expanding EU deployments following CE-Mark clearance earlier in 2025.


Global Medical Device Technologies Market Report Scope
As per the scope of the report, a medical device is any instrument, apparatus, appliance, machine, implant, or any other related/similar article used for diagnosing, treating, monitoring, preventing, or alleviating diseases.
The medical device technologies market is segmented by device type, technology platform, therapeutic application, end users, and geography. By device type, the market is segmented into diagnostic devices, which include diagnostic imaging devices (MRI systems, CT scanners, and ultrasounds) and in-vitro diagnostics; therapeutic devices, such as implants and drug-delivery pumps; surgical devices, including robotics, navigation, and energy-based devices; monitoring devices, such as multiparameter monitors and remote patient monitors; and other categories. By technology platform, the market is segmented into conventional electro-mechanical & disposable, wearable & remote monitoring, telehealth & mHealth, robotic surgery, 3-D printing, augmented / virtual reality, nanotechnology & smart materials, and AI-as-a-Medical-Device (SaMD). By therapeutic application, the market is segmented into cardiology, orthopedics & sports medicine, neurology, ophthalmology, general & laparoscopic surgery, oncology, and others. By end users, the market is segmented into hospitals, clinics, ambulatory surgical centers, home healthcare settings, and diagnostic laboratories.
Geographically, the market is segmented across North America, Europe, the Asia-Pacific region, the Middle East & Africa, and South America. The market report also covers the estimated market sizes and trends for 17 countries across major regions globally. For each segment, the market size and forecast are provided in terms of value (USD).
| Diagnostic Devices | Diagnostic Imaging Devices | MRI Systems |
| CT Scanners | ||
| Ultrasound | ||
| In-Vitro Diagnostics | ||
| Therapeutic Devices | Implants | |
| Drug-Delivery Pumps | ||
| Surgical Devices | Robotics & Navigation | |
| Energy-based Devices | ||
| Monitoring Devices | Multiparameter Monitors | |
| Remote Patient Monitors | ||
| Others |
| Conventional Electro-mechanical & Disposable |
| Wearable & Remote Monitoring |
| Telehealth & mHealth |
| Robotic Surgery |
| 3-D Printing |
| Augmented / Virtual Reality |
| Nanotechnology & Smart Materials |
| AI-as-a-Medical-Device (SaMD) |
| Cardiology |
| Orthopedics & Sports Medicine |
| Neurology |
| Ophthalmology |
| General & Laparoscopic Surgery |
| Oncology |
| Others |
| Hospitals |
| Clinics |
| Ambulatory Surgical Centers |
| Home Healthcare Settings |
| Diagnostic Laboratories |
| North America | United States |
| Canada | |
| Mexico | |
| Europe | Germany |
| United Kingdom | |
| France | |
| Italy | |
| Spain | |
| Rest of Europe | |
| Asia-Pacific | China |
| India | |
| Japan | |
| South Korea | |
| Australia | |
| Rest of Asia-Pacific | |
| Middle East and Africa | GCC |
| South Africa | |
| Rest of Middle East and Africa | |
| South America | Brazil |
| Argentina | |
| Rest of South America |
| By Device Type | Diagnostic Devices | Diagnostic Imaging Devices | MRI Systems |
| CT Scanners | |||
| Ultrasound | |||
| In-Vitro Diagnostics | |||
| Therapeutic Devices | Implants | ||
| Drug-Delivery Pumps | |||
| Surgical Devices | Robotics & Navigation | ||
| Energy-based Devices | |||
| Monitoring Devices | Multiparameter Monitors | ||
| Remote Patient Monitors | |||
| Others | |||
| By Technology Platform | Conventional Electro-mechanical & Disposable | ||
| Wearable & Remote Monitoring | |||
| Telehealth & mHealth | |||
| Robotic Surgery | |||
| 3-D Printing | |||
| Augmented / Virtual Reality | |||
| Nanotechnology & Smart Materials | |||
| AI-as-a-Medical-Device (SaMD) | |||
| By Therapeutic Application | Cardiology | ||
| Orthopedics & Sports Medicine | |||
| Neurology | |||
| Ophthalmology | |||
| General & Laparoscopic Surgery | |||
| Oncology | |||
| Others | |||
| By End User | Hospitals | ||
| Clinics | |||
| Ambulatory Surgical Centers | |||
| Home Healthcare Settings | |||
| Diagnostic Laboratories | |||
| By Geography | North America | United States | |
| Canada | |||
| Mexico | |||
| Europe | Germany | ||
| United Kingdom | |||
| France | |||
| Italy | |||
| Spain | |||
| Rest of Europe | |||
| Asia-Pacific | China | ||
| India | |||
| Japan | |||
| South Korea | |||
| Australia | |||
| Rest of Asia-Pacific | |||
| Middle East and Africa | GCC | ||
| South Africa | |||
| Rest of Middle East and Africa | |||
| South America | Brazil | ||
| Argentina | |||
| Rest of South America | |||


Key Questions Answered in the Report
What is the current size and growth forecast of the medical device technologies market?
The medical device technologies market size is projected to expand from USD 0.68 trillion in 2025 and USD 0.73 trillion in 2026 to USD 1.02 trillion by 2031, registering a CAGR of 6.99% between 2026 to 2031
Which device segment leads the market and which one is growing fastest?
Diagnostic devices held the top spot in 2025 with 39.12% share, thanks to large MRI, CT, and ultrasound fleets and high-margin consumables. Monitoring devices, however, are the sprint leaders, projected to expand at a 7.23% CAGR as remote-care codes and hospital-at-home programs push patient monitoring into homes
What are the fastest-growing technology platforms?
Nanotechnology and smart-material devices show the quickest climb at an 8.11% CAGR through 2031, driven by infection-fighting nanocoating and real-time implantable biosensors. AI-enabled software has cleared more than 1,300 FDA authorizations, and robotic surgery systems continue to widen their installed bases.
Which geographic region is expected to grow fastest and why?
Asia-Pacific is set to post a 7.56% CAGR to 2031. Faster approvals in China, India’s manufacturing incentives worth INR 30 billion (USD 360 million), and aging-population demand in Japan and South Korea fuel the momentum
Page last updated on:


