Market Overview
| Study Period | 2020 - 2031 |
|---|---|
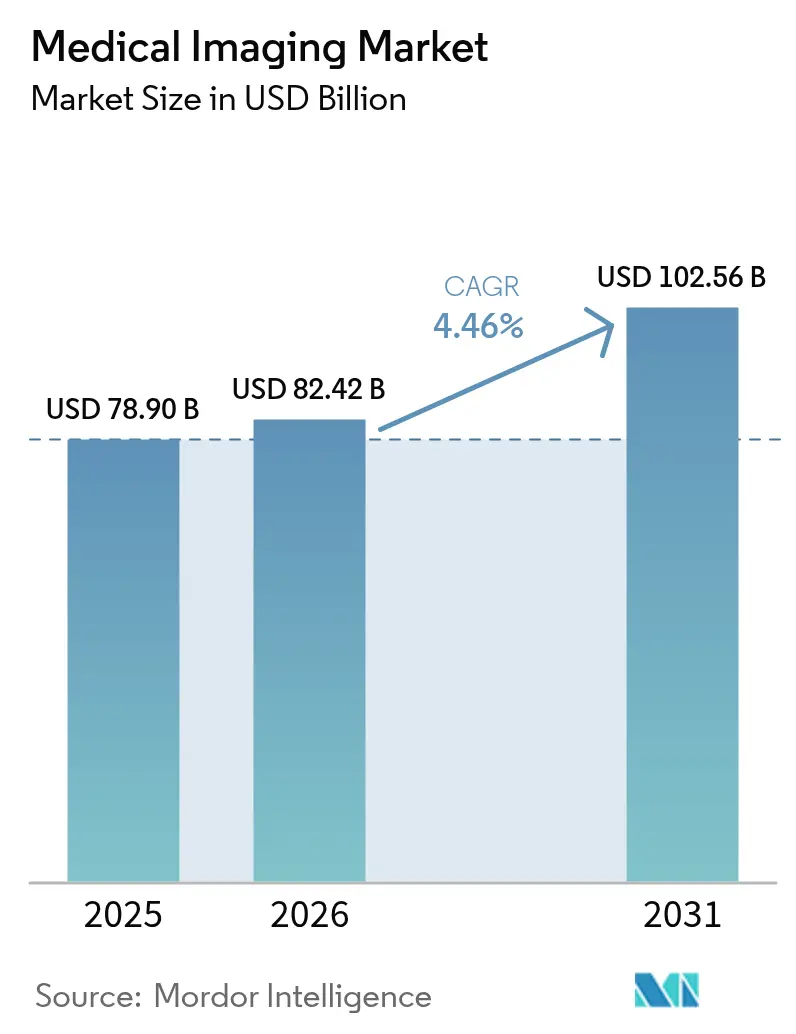
| Market Size (2026) | USD 82.42 Billion |
| Market Size (2031) | USD 102.56 Billion |
| Growth Rate (2026 - 2031) | 4.46% CAGR |
| Fastest Growing Market | Asia Pacific |
| Largest Market | North America |
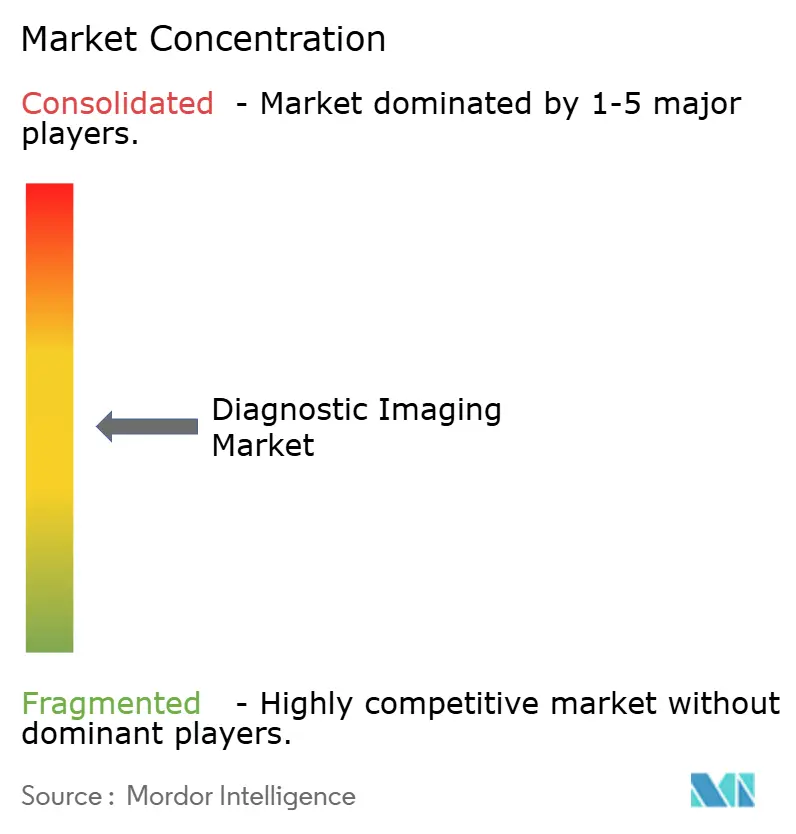
| Market Concentration | Medium |
Major Players *Disclaimer: Major Players sorted in no particular order Image © Mordor Intelligence. Reuse requires attribution under CC BY 4.0. | |
Medical Imaging Market Analysis by Mordor Intelligence
Medical imaging market size in 2026 is estimated at USD 82.42 billion, growing from 2025 value of USD 78.90 billion with 2031 projections showing USD 102.56 billion, growing at 4.46% CAGR over 2026-2031. North America remains the largest revenue pool due to a dense installed base and capital budgets, while Asia-Pacific shows the strongest momentum as governments fund hospital capacity and domestic manufacturers scale price-competitive systems that expand access. X-ray continues to anchor high-volume use cases in emergency and orthopedic care, although computed tomography is gaining as faster scanners pair with AI-assisted detection and triage. Hospitals still lead because they can finance premium systems and link imaging to procedural services, yet outpatient imaging centers are taking share as payers steer site-of-service to lower-cost settings. Competitive dynamics reflect an oligopoly of multinational leaders that face price pressure from Chinese entrants and new demand pockets in mobile, handheld, and software-enabled workflows that change unit economics across the medical imaging market.
Key Report Takeaways
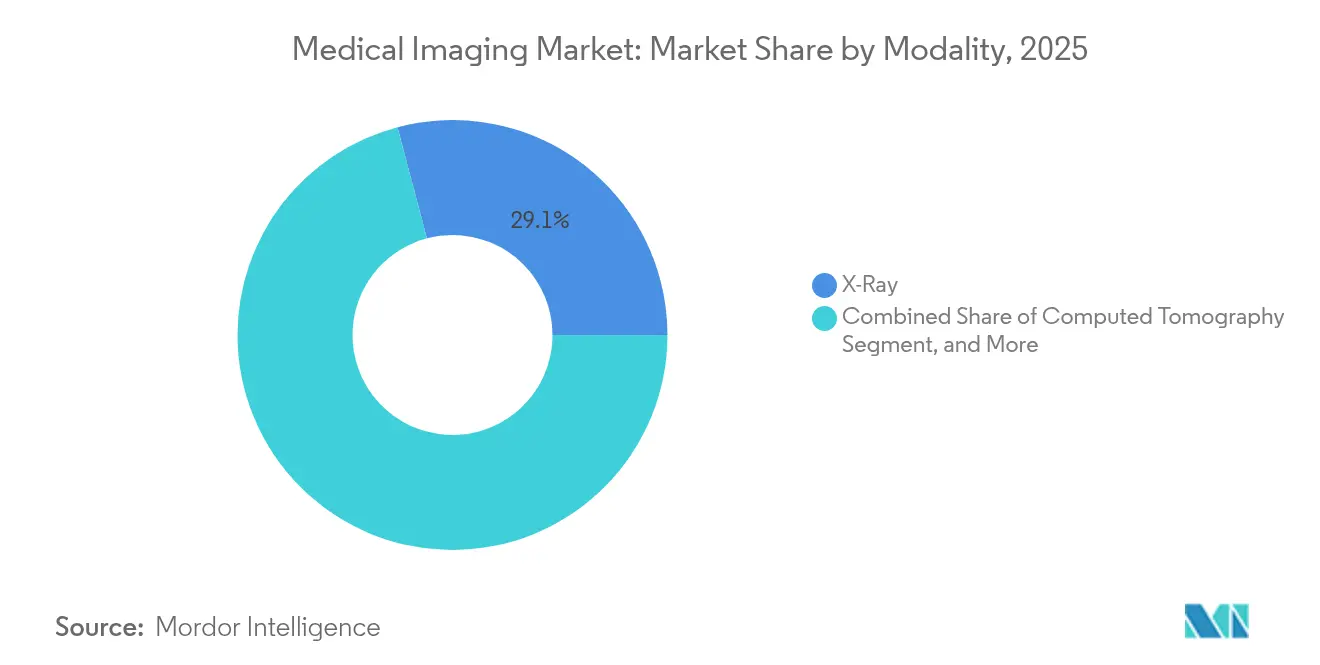
- By modality, X-ray led with 29.12% revenue share in 2025, while CT is forecast to expand at a 6.39% CAGR to 2031.
- By application, diagnostic imaging accounted for a 58.07% share of the medical imaging market size in 2025, while therapeutic and interventional imaging is projected to grow at a 6.63% CAGR through 2031.
- By end user, hospitals held 61.48% share in 2025, and diagnostic imaging centers are set to post the highest CAGR at 7.11% through 2031.
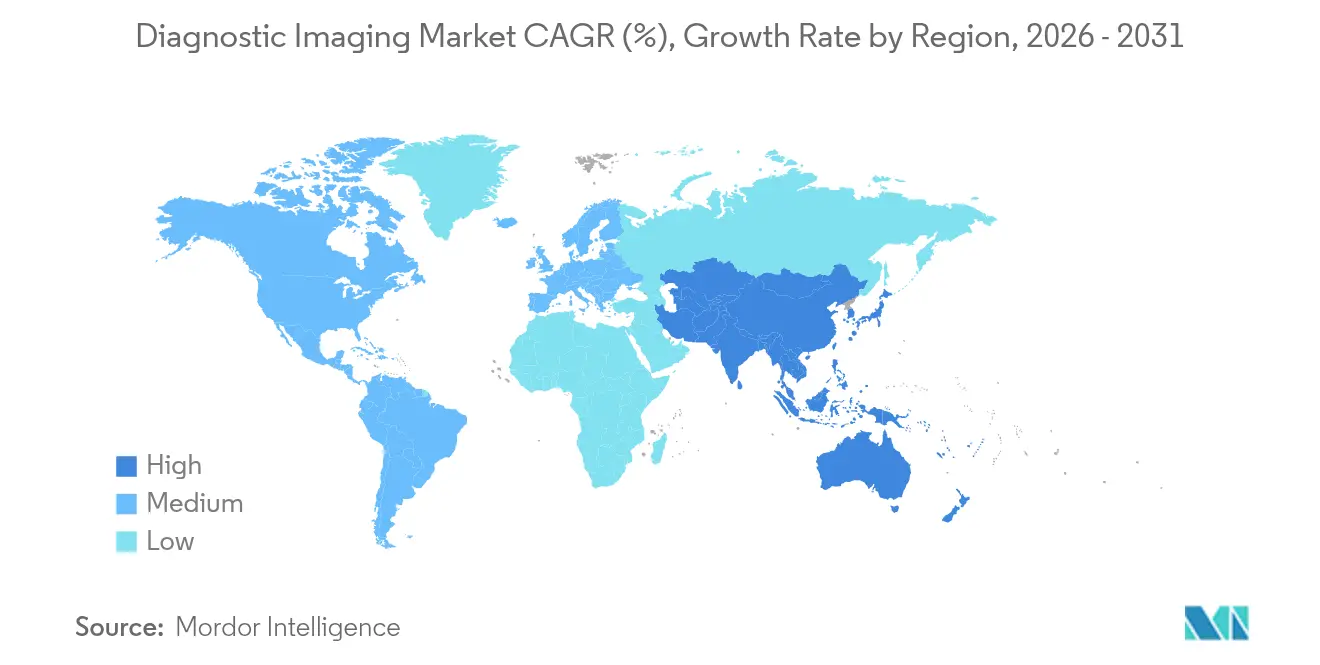
- By geography, North America commanded 41.95% share in 2025, while Asia-Pacific is the fastest-growing region at a 5.54% CAGR to 2031.
Note: Market size and forecast figures in this report are generated using Mordor Intelligence’s proprietary estimation framework, updated with the latest available data and insights as of 2026.
Global Medical Imaging Market Trends and Insights
Drivers Impact Analysis*
| Driver | (~) % Impact on CAGR Forecast | Geographic Relevance | Impact Timeline |
|---|---|---|---|
| Rising prevalence of chronic diseases | +1.2% | Global, with concentration in aging OECD nations | Long term (≥ 4 years) |
| Growing demand for early and accurate diagnosis | +0.9% | North America, Europe, urban Asia-Pacific | Medium term (2-4 years) |
| Advancements in imaging technologies (AI, 3D, hybrid systems) | +1.1% | North America, Europe, select Asia-Pacific markets | Medium term (2-4 years) |
| Increasing aging population worldwide | +0.7% | Global, acute in Japan, Western Europe, emerging in China | Long term (≥ 4 years) |
| Expansion of healthcare infrastructure in emerging economies | +1.3% | Asia-Pacific, Middle East, Latin America, Sub-Saharan Africa | Medium term (2-4 years) |
| Increasing use of minimally invasive and image-guided procedures | +0.8% | North America, Europe, premium hospital segments in emerging markets | Short term (≤ 2 years) |
| Source: Mordor Intelligence | |||
Rise in Chronic Disease Prevalence Drives Imaging Demand
Chronic disease burden anchors sustained demand in the medical imaging market as cardiovascular disease, cancer, and diabetes require imaging for diagnosis, staging, and longitudinal monitoring across the care continuum. Cancer incidence is rising in many middle-income countries due to aging and lifestyle change, a trend that feeds CT and PET volumes within standardized oncology pathways. Cardiac CT and stress MRI have rolled into guideline-aligned care for coronary artery disease risk stratification, especially among adults with type 2 diabetes where surveillance protocols now emphasize noninvasive imaging in lieu of invasive diagnostics[1]American College of Cardiology, “ACC/AHA Clinical Guidelines,” American College of Cardiology, acc.org. Chronic kidney disease prevalence among older adults widens the role for non-contrast MRI and advanced sequences that avoid gadolinium exposure, which has accelerated software adoption for diffusion-weighted and arterial spin labeling protocols in the medical imaging market. Reimbursement policy is an important lever, since Medicare’s Appropriate Use Criteria for advanced diagnostic imaging obliges decision-support integration that aligns clinical indications with modality selection and creates a defensible utilization record.
Growing Demand for Early and Accurate Diagnosis
The shift toward value-based contracts motivates health systems to detect disease earlier to avoid downstream costs, which expands the role of high-yield imaging in screening and diagnostic workups. Low-dose CT for lung cancer screening has a Grade B recommendation from the U.S. Preventive Services Task Force, and coverage decisions increased scan volumes as programs matured in community settings[2]U.S. Preventive Services Task Force, “Lung Cancer Screening Recommendation,” U.S. Preventive Services Task Force, uspreventiveservicestaskforce.org. State-level dense-breast legislation and the federal density reporting rule have broadened pathways for supplemental ultrasound or MRI in women with heterogeneously dense tissue, which drives demand for automated breast ultrasound and higher-throughput MRI suites in the medical imaging market. AI-enhanced triage that flags suspected intracranial hemorrhage or pulmonary embolism within minutes improves emergency department prioritization and supports more timely interventions, particularly in stroke pathways where every delay impacts outcomes. Compliance considerations include the need for robust validation of Software as a Medical Device across diverse datasets for FDA clearance, which affects release cadence and field performance in the medical imaging market.
Advancements in Imaging Technologies (AI, 3D, Hybrid Systems)
Photon-counting detector CT separates photons by energy to deliver spectral detail and lower dose, and commercial platforms are now positioned for broader clinical adoption over the next planning cycle in the medical imaging market. Hybrid PET-MRI offers metabolic and anatomical information in a single session with reduced radiation exposure compared with sequential PET-CT plus MRI in sensitive populations such as pediatrics and neurodegeneration. AI-based image reconstruction shortens CT and MRI acquisition time while improving noise and edge fidelity, which raises throughput without compromising diagnostic confidence. Three-dimensional printing workflows that convert DICOM data into patient-specific models now support surgical planning in orthopedics and craniofacial reconstruction, a change that increases demand for isotropic, submillimeter protocols and image-quality consistency across the medical imaging market[3]U.S. Food and Drug Administration, “FDA Issues Final Rule to Inform Patients About Breast Density,” U.S. Food and Drug Administration, fda.gov. European regulatory changes under MDR Article 120 have introduced re-certification obligations when software features materially affect clinical performance, which slows delivery of AI updates relative to U.S. counterparts and shapes release strategies for global OEMs.
Expansion of Healthcare Infrastructure in Emerging Economies
China’s Healthy China 2030 program steers investment toward county-level capacity, reinforcing procurement of CT and digital radiography at price points that allow rapid expansion beyond urban cores in the medical imaging market. India’s Ayushman Bharat program extends coverage to 500 million citizens, catalyzing private-hospital growth in Tier 2 locations where imaging suites are foundational to qualify for claims and to expand procedural lines. Middle Eastern strategies under Saudi Vision 2030 and similar national plans in the Gulf fund tertiary-care hubs and integrated medical cities, where subspecialty imaging capacity anchors oncology and cardiovascular service lines. Sub-Saharan Africa’s gap between disease burden and installed imaging base creates procurement opportunities for mobile and refurbished systems, although power stability, service coverage, and currency risk complicate financing and rollout timelines. Donor and multilateral procurement frameworks often reference WHO prequalification for diagnostic equipment, which elevates performance benchmarks and nudges buyers toward certified suppliers in the medical imaging market.
Restraints Impact Analysis*
| Restraint | (~) % Impact on CAGR Forecast | Geographic Relevance | Impact Timeline |
|---|---|---|---|
| High cost of advanced imaging equipment | -0.9% | Emerging economies, rural regions globally | Medium term (2-4 years) |
| Shortage of skilled radiologists and technicians | -0.6% | Global, severe in Sub-Saharan Africa, Southeast Asia | Long term (≥ 4 years) |
| Stringent regulatory approvals and compliance requirements | -0.4% | North America, Europe, regulated Asia-Pacific markets | Short term (≤ 2 years) |
| Risk of radiation exposure in certain modalities | -0.3% | Global, heightened scrutiny in pediatric and screening contexts | Long term (≥ 4 years) |
| Source: Mordor Intelligence | |||
High Cost of Advanced Imaging Equipment
Premium MRI and hybrid PET-MRI projects can require capital budgets above USD 3 million per unit, which restricts adoption outside tertiary centers. MRI rooms need RF shielding, structural reinforcement, and cryogen safety systems, which add siting expense beyond the scanner price. CT systems incorporate dose modulation and monitoring to align with ALARA expectations, increasing hardware and software costs for compliant deployments. Declining or flat per-scan reimbursement in hospital outpatient settings lengthens payback periods for new installations.
Shortage of Skilled Radiologists And Technicians
Global radiologist undersupply is estimated at 15–20% in OECD systems and above 40% in Sub-Saharan Africa, which exacerbates reporting delays. OECD datasets and national audits highlight persistent specialty bottlenecks relative to rising imaging volumes in aging populations. The UK clinical radiology workforce census published in 2024 reported a persistent shortfall, underscoring recruiting and retention challenges.
*Our forecasts treat driver/restraint impacts as directional, not additive. The impact forecasts reflect baseline growth, mix effects, and variable interactions.
Segment Analysis
By Modality: CT Surges as AI and Speed Reshape Clinical Protocols
X-ray systems commanded 29.12% modality share in 2025, reflecting entrenched use in emergency and orthopedic workflows where low-cost digital radiography delivers fast answers with broad staff familiarity in the medical imaging market. Computed tomography is the fastest-moving modality at a 6.39% CAGR to 2031 based on multi-detector arrays, sub-second temporal resolution, and AI-aided workflow tools that cut review time and enhance detection sensitivity in high-volume settings. MRI retains a premium role in neuro and musculoskeletal imaging, though system pricing in the USD 2–3 million range and helium supply volatility push some procurement teams toward refurbished 1.5T systems in the medical imaging market. Ultrasound penetration expands with handheld devices that weigh under 500 grams and sell below USD 5,000, which puts point-of-care imaging in the hands of primary care and emergency teams that lacked immediate access to cart-based systems. Nuclear imaging remains tied to the radiopharmaceutical pipeline, with approvals like PSMA PET tracers widening indications in prostate oncology and influencing PET-CT utilization patterns in tertiary centers.
Fluoroscopy and mammography are mature replacement markets where digital upgrades are driven by quality and safety standards rather than rapid unit growth, guided by the Mammography Quality Standards Act framework and evolving density reporting rules. Hybrid platforms such as PET-CT and PET-MRI blend complementary strengths in oncology and neurology, though payer scrutiny of incremental value can temper adoption outside academic hubs in the medical imaging market. Vendors are shifting toward software-defined capabilities that unlock performance via subscriptions, including AI recon, spectral modes, and workflow orchestration that decouples feature adoption from full-hardware replacement. Photon-counting CT exemplifies this shift, as OEMs package spectral tools and dose advantages with service and software bundles for clearer ROI narratives. This mix supports stable value realization for providers and a durable installed base strategy for suppliers competing in the medical imaging market.


By Application: Interventional Imaging Captures Procedural Growth Wave
Diagnostic imaging held 58.07% of the medical imaging market share in 2025, supported by detection, differential diagnosis, and monitoring use cases that anchor daily throughput in radiology departments. Therapeutic and interventional imaging grows at 6.63% as minimally invasive procedures expand in oncology, cardiology, and pain management, which elevates the role of real-time guidance and hybrid operating suites. Cone-beam CT and advanced fluoroscopy provide sub-millimeter navigation for catheters and needles, which reduces complications and length of stay in programs that increasingly operate in outpatient settings in the medical imaging market. Imaging for clinical trials remains a high-complexity niche that relies on standardized protocols and quantitative biomarkers to support regulatory endpoints, creating stickier software and services revenue around the core hardware footprint. AI-guided planning and overlay roadmapping improve procedural precision and resource utilization, which further links imaging to value-based payment structures for complex care pathways.
Interventional radiology is formalizing as a distinct service line with board certification and fellowship training that align capital planning with procedural needs rather than diagnostic throughput in the medical imaging market. Hybrid rooms integrate angiography with rotational 3D reconstruction and radiation dose monitoring for safer, more efficient workflows that satisfy payer and accreditation standards. Portable ultrasound supports bedside procedures like central line placement and paracentesis, which reduces complications and creates measurable value even in resource-constrained environments. Quality registries capture outcomes and complications to demonstrate value in reimbursement negotiations, which helps remove barriers to adoption for novel guidance tools in the medical imaging market. FDA’s Breakthrough Devices Program accelerates reviews for image-guidance innovations that meet high unmet need, which can reduce time to clinical availability in focused indication.

By End User: Imaging Centers Exploit Cost and Convenience Arbitrage
Hospitals retained 61.48% of the medical imaging market share in 2025 due to emergency, inpatient, and procedural demand that supports premium systems and integrated service contracts. Diagnostic imaging centers are the fastest-growing setting at a 7.11% CAGR as site-of-service reimbursement differentials and benefit design steer patients to lower-cost outpatient scans in the medical imaging market. Private-equity rollups of radiology groups build purchasing leverage and deploy teleradiology for extended hours with balanced labor costs, while center networks invest in standardized protocols and AI-assisted workflow to raise throughput. Academic and research institutes maintain advanced modality portfolios to support grants and early clinical research, though replacement cycles can extend due to budget constraints in the medical imaging market. Ambulatory surgical centers expand office-based procedures that require on-site fluoroscopy and ultrasound, which accelerates procurement among orthopedic and ophthalmic programs.
Physician offices adopt point-of-care ultrasound for musculoskeletal and soft-tissue triage, which tightens referral pathways and reduces unnecessary imaging appointments in the medical imaging market. Mobile imaging providers address rural and budget-limited clients with asset-light fleets that deliver scanning on a scheduled basis, though vehicle maintenance and reimbursement dynamics can pressure margins. Integrated delivery networks blend hospital and outpatient imaging capacity under one budget and governance model, which informs long-horizon vendor partnerships that emphasize uptime, service availability, and software roadmaps. These models help the medical imaging market support access expansion without proportionate increases in capital outlay, which appeals to payers and health systems managing utilization. The net effect is more flexible deployment of imaging closer to the point of care across community and specialty settings in the medical imaging market.
Geography Analysis
North America held 41.95% share of the medical imaging market size in 2025 and remains the center of gravity for high-spec systems, enterprise imaging platforms, and AI-enabled workflows that align with established reimbursement structures. The United States accounts for the largest portion of global revenue due to capital budgets at scale and a large outpatient ecosystem that integrates imaging into routine care and complex procedures in the medical imaging market. Canada experiences wait-time constraints in some provinces that slow replacement cadences and stimulate public-private partnerships, factors that shape procurement timing and service models. FDA device oversight and CMS coverage decisions influence feature adoption timelines and clinical indications, which reinforces early uptake of software tools that pair with established hardware lines in the medical imaging market.
Europe shows mature demand with centralized tenders that compress margins yet offer multi-year volume visibility for modality refresh cycles in the medical imaging market. Germany and France maintain higher per-capita utilization than the United Kingdom, where budget constraints limit capital replacement and contribute to lower scanner density relative to continental peers. MDR implementation increased compliance workload and certification time for AI-rich software, which favors incumbents with deep regulatory teams and structured post-market surveillance programs in the medical imaging market. Private providers in Central and Eastern Europe invest to serve medical tourists from Western Europe, where pricing and wait-time differentials pull procedures to regional hubs with modern imaging suites.
Asia-Pacific is the fastest-growing region at a 5.54% CAGR as China, India, and Southeast Asia expand access through public investment and private-chain growth, with domestic manufacturers adding capacity and competitive price points in the medical imaging market. Japan behaves like a replacement market, while Australia and South Korea combine high technology adoption with smaller absolute volumes due to population size. Regulatory fragmentation across ASEAN requires market-by-market registration and reimbursement planning, which influences launch sequencing and partner selection for manufacturers in the medical imaging market. In the Middle East, sovereign investment in tertiary-care hubs drives premium imaging procurement as part of economic diversification agendas, while Sub-Saharan Africa remains underserved and relies on portable and refurbished solutions tailored to infrastructure realities. South America concentrates growth in Brazil, Mexico, and Colombia as urban private hospitals build imaging-led service lines, while public systems and rural areas extend access through mobile fleets and tele-reporting in the medical imaging market.

Regulatory Landscape
Regulation in medical imaging continues to tighten around safety, software change control, and data interoperability. In the United States, the FDA has expanded Class II (Special Controls) coverage for imaging-adjacent software and guidance tools, including a June 2026 final order classifying radiological machine learning-based quantitative imaging software with a predetermined change control plan under 21 CFR 892.2055 (effective June 17, 2026) and a June 2025 final order for radiological acquisition and/or optimization guidance systems. Alongside device clearance pathways such as 510(k), the U.S. Department of Health and Human Services launched a January 2026 Request for Information on diagnostic imaging interoperability standards and certification, reinforcing requirements for standards-based image exchange and workflow integration across care settings.
In Europe, Medical Device Regulation (MDR) compliance and notified body capacity remain central market-access variables, particularly for AI-rich software releases and updates. The European Commission adopted Commission Implementing Regulation (EU) 2026/977 (effective May 5, 2026) to establish uniform quality management and procedural requirements for notified bodies under MDR and IVDR. It also published Delegated Regulations (EU) 2026/1451 and 2026/1359 on Well-Established Technologies to streamline evidence and documentation expectations for certain device categories. Elsewhere, jurisdiction-specific operational rules continue to shape provider procurement and QA programs, including updated UK National Diagnostic Reference Levels (effective December 11, 2025) and Dubai Health Authority standards for diagnostic imaging services that took effect in November 2025 under Dubai Health Strategy 2026.
Value Chain Analysis
The medical imaging value chain runs from upstream materials and precision components (detectors, X-ray tubes, rare-earth inputs for MRI and nuclear imaging, semiconductors, and high-reliability electronics) to OEM system integration and software development (reconstruction, workflow, AI), then to distribution through direct sales, tenders, and channel partners. Logistics and service execution matter for the installed-base side of demand, since uptime depends on field engineering, parts availability, and compliance documentation. This has pushed OEMs toward tighter coordination with freight and procurement partners, including Kintetsu World Express expanding its partnership with Siemens Healthcare in October 2025 to manage procurement flows from Asia to UK production facilities (200 to 300 container units annually). On the demand side, large multi-site buyers and managed-service structures bundle equipment, software entitlements, training, and lifecycle maintenance into longer-term contracts that help smooth provider capital cycles.
Supply risk and input volatility have increasingly influenced imaging procurement decisions, especially when advanced systems rely on constrained components and specialty materials. In April 2025, China Ministry of Commerce export controls introduced restrictions on 12 rare earth elements (including gadolinium, lutetium, and yttrium), linking trade policy directly to MRI or X-ray-related manufacturing inputs. Reported lead-time extensions for chip-dependent assemblies and certain X-ray components can shift delivery schedules and affect vendor selection. Downstream, the nuclear imaging sub-chain adds radiopharmaceutical and tracer distribution dynamics, reflected in September 2025 agreements such as GE HealthCare and CDL Nuclear Technologies Group to support Flyrcado distribution and services in the United States. Large-scale deployment contracts, including the October 2025 Superhealth and United Imaging agreement covering supply, installation, and management of radiology systems across 100 hospitals in India, also show where value is concentrating for OEMs and partners that can combine financing, implementation, and service at scale.
Competitive Landscape
Market concentration remains moderately high as Siemens Healthineers, GE HealthCare, and Philips together hold an estimated 50–55% of global revenue with broad modality portfolios, embedded service networks, and deep ties to academic and referral centers in the medical imaging market. Chinese OEMs, including United Imaging, Mindray, and Neusoft, win tenders in budget-constrained markets with 30–40% price differentials while achieving ISO 13485 quality certifications and regional regulatory approvals. Disruptors focus on handheld ultrasound, low-field portable MRI, and distributed X-ray models to unlock new use cases and capital-light deployment paths that reshape utilization patterns in the medical imaging market.
Strategic emphasis is tilting from hardware specs to software, services, and integrated workflows that improve throughput, automate routine steps, and link imaging to longitudinal data platforms in the medical imaging market. Photon-counting CT and AI-native reconstruction demonstrate that performance and dose gains can be packaged as software-managed capabilities within evolving service models. Managed equipment services and outcomes-based contracts gain traction as hospitals prefer operating expense models that shift utilization and uptime risk to vendors, a trend visible in multi-site upgrades across public and private systems in the medical imaging market.
Select players pursue vertical integration into radiopharmaceuticals and theranostics, where tracer production and therapy isotopes tie hardware to dosing and care protocols in oncology. Partnerships with cloud and EHR vendors embed image exchange, analytics, and report automation into clinical workflows and revenue cycles in the medical imaging market. Compliance frameworks such as FDA 510(k), CE marking under MDR, and China NMPA protect quality and safety while setting a higher bar for AI-enabled changes to clinical performance, which shapes release plans and market access strategies. These dynamics sustain competitive intensity and encourage differentiated service models across the medical imaging market.
Medical Imaging Industry Leaders
GE HealthCare
Koninklijke Philips N.V.
Siemens Healthineers AG
Fujifilm Holdings Corporation
Canon Medical System Corporation
- *Disclaimer: Major Players sorted in no particular order

Market Opportunities and Future Outlook
AI-enabled imaging and software-defined upgrades are expanding the addressable opportunity beyond hardware replacement, particularly where workflow automation helps maintain throughput amid radiologist and technologist shortages. FDA-cleared algorithm counts provide a measurable signal of this shift, with 1,524 total FDA-cleared AI algorithms reported as of March 30, 2026, including 1,163 (76.31%) for radiology. Commercialization signals remain tied to clearance and integration, including FDA 510(k) clearances for new CT platforms and SaMD that fit screening and triage pathways. Philips received FDA 510(k) clearance in April 2026 for its detector-based Spectral CT Verida system, and Median Technologies announced FDA 510(k) clearance in February 2026 for eyonis LCS software for lung cancer screening. Integration of PACS viewers and imaging workflows into EHR environments also supports a platform opportunity around enterprise imaging and interoperability, exemplified by a July 2026 FDA 510(k) clearance for an EHR-integrated PACS viewer.
Photon-counting CT and advanced reconstruction are creating an opportunity pocket where providers focus on dose, spectral detail, and productivity gains rather than incremental slice counts. In 2026, GE HealthCare received FDA 510(k) clearance (March 2026) for Photonova Spectra, a photon-counting CT solution. Canon Medical Systems USA introduced deep learning reconstruction updates (CLEAR Motion and Precise IQ Engine with 1024 matrix capability) across its CT portfolio in July 2026. These releases reinforce vendor strategies that package reconstruction, spectral modes, and workflow tools into subscription-like feature roadmaps, which aligns with provider preferences for managed equipment services and operating-expense models. In emerging markets, access-enabling configurations such as refurbished MRI, mobile imaging fleets, and handheld ultrasound remain the most direct pull-through, since lower system price points and service coverage determine adoption. Programs such as Healthy China 2030 and Ayushman Bharat continue to anchor multi-site procurement and capacity build-outs that drive demand for imaging suites and associated service contracts.
Recent Industry Developments
- July 2026: Canon Medical Systems USA introduced CLEAR Motion and the Precise IQ Engine (PIQE) 1024 Matrix deep learning reconstruction across its CT portfolio. The release highlights software-driven image quality and motion management as differentiators, supporting OEM strategies that monetize installed bases through reconstruction and workflow upgrades rather than only new scanner placements.
- March 2025: Sutter Health signed a seven-year strategic imaging partnership with GE HealthCare spanning PET/CT, SPECT/CT, MRI, CT, X-ray, and ultrasound. The multi-modality scope reinforces GE HealthCare's long-term installed-base position through standardization, service alignment, and upgrade pathways across a large health system footprint.
- November 2024: GE HealthCare and RadNet collaborated to integrate SmartMammo AI into GE's Senographe Pristina mammography system. Embedding AI into a high-volume screening workflow supports faster interpretation and consistency, and it reinforces OEM-provider partnerships that tie software performance to specific hardware ecosystems.


Research Methodology Framework and Report Scope
Market Definition and Coverage
For this study, the medical imaging market covers the sale and installed use of diagnostic imaging modalities used to create images for clinical decision making in healthcare settings, reported in value terms in USD across major regions.
Scope exclusions: We do not count general hospital IT, standalone lab diagnostics, or routine service labor that is not directly tied to imaging modality usage and upgrades.
Segmentation Overview
- By Modality
- MRI
- Low & Mid-Field (<1.5 T)
- High-Field (1.5–3 T)
- Very-/Ultra-High-Field (>3 T)
- Computed Tomography
- Low-End (~16-slice)
- Mid-Range (~64-slice)
- High-End (≥128-slice)
- Ultrasound
- 2-D
- 3-D/4-D
- Hand-held/Portable
- X-Ray
- Analog Systems
- Digital Radiography (CR/DR)
- Nuclear Imaging
- PET
- SPECT
- Hybrid PET/MRI – emerging
- Fluoroscopy
- Mammography
- MRI
- By Application
- Diagnostic
- Therapeutic / Interventional
- Research & Clinical Trials
- By End User
- Hospitals
- Diagnostic Imaging Centers
- Academic & Research Institutes
- Ambulatory Surgical Centers
- Physician Offices & Outpatient Clinics
- Mobile Imaging Providers
- Geography
- North America
- United States
- Canada
- Mexico
- Europe
- Germany
- United Kingdom
- France
- Italy
- Spain
- Rest of Europe
- Asia-Pacific
- China
- Japan
- India
- Australia
- South Korea
- Rest of Asia-Pacific
- Middle East & Africa
- GCC
- South Africa
- Rest of Middle East & Africa
- South America
- Brazil
- Argentina
- Rest of South America
- North America
Data Sources, Market Sizing, and Validation
Desk Research
Desk research is used to set the market boundary, establish starting ratios, and sanity check the demand pool before any forecast is built. We leaned on public sources such as the World Health Organization (WHO), the US FDA device databases, Centers for Medicare and Medicaid Services (CMS) imaging reimbursement files, OECD health statistics, and peer reviewed radiology and healthcare technology journals.
In parallel, we reviewed company annual reports, investor presentations, earnings call transcripts, association publications, and reputed press coverage to track product launches and the direction of pricing. Where needed, we used paid subscriptions for company financials and news intelligence, plus patent databases, to cross check revenue exposure and technology refresh cycles. These examples are not exhaustive, and other public sources were also referenced for data collection, validation, and clarification during research.
Primary Interviews and Surveys
Primary interviews were used to pressure test assumptions that are hard to read from public data, like replacement cycles, ASP movement by modality, and how quickly new imaging features get adopted in routine care. We spoke with a mix of manufacturers, distributors, imaging center operators, hospital leaders, and radiology focused clinicians across APAC, EMEA, and the Americas, and we followed up when interview responses did not match desk signals.
Distribution of primary research fieldwork respondents
| Company type | Respondent position | Region |
|---|---|---|
| Top tier: 35% | CXOs: 13% | APAC: 44% |
| Mid tier: 45% | Functional/Unit leaders: 38% | EMEA: 31% |
| Smaller Players: 20% | Managers: 49% | Americas: 25% |
Market-Sizing & Forecasting
The core model uses a top-down approach where procedure volumes, imaging equipment install base, and typical utilization rates are used to reconstruct the addressable imaging demand by modality and setting, which is then converted to value using realistic ASP ranges. Once that picture is built, totals are corroborated with selective bottom-up approximations like sampled supplier revenue splits, channel checks, and a few volume times ASP cross checks, and then adjusted where the two views do not align.
For medical imaging, we kept inputs practical and traceable, so we focused on indicators such as diagnostic scan volumes, chronic disease and aging trends that change imaging need, capital spending patterns in hospitals and imaging centers, replacement and upgrade cycles for major systems, and the mix shift across CT, MRI, ultrasound, X-ray, and nuclear imaging. Because adoption and pricing rarely move in a straight line, scenario analysis was used to translate expert views on reimbursement direction, technology refresh timing, and utilization recovery into the forecast path. When local country data is thin, we used region level ratios tied to healthcare spending and installed base intensity, and then we rechecked those assumptions through interviews.
Data Validation & Update Cycle
Validation is done through multiple checks so the final numbers stay consistent with real world signals. Our team compares outputs against independent indicators like imaging procedure trends, device approvals and shipment cues, and publicly discussed pricing movement, then reviews anomalies before sign off.
A second analyst review is completed for key assumptions, and we trigger re contact when interview feedback conflicts with observed utilization or replacement cycle patterns. The report is refreshed annually, and interim updates are made when material events occur, such as major regulatory changes or sudden shifts in hospital capital budgets. Before delivery, a final pass is done so clients receive the latest updated view with consistent assumptions.
Mordor Intelligence's Medical Imaging Market Sizing Compared With Other Published Estimates
Published market sizes for medical imaging often do not line up because firms draw the boundary differently and then apply different price and volume assumptions on top of it. In practice, differences show up when one study counts device revenue only, another mixes in imaging services, or the forecast assumes a faster replacement cycle than what hospitals can fund.
Procedure growth signals, modality level utilization patterns, and cross checks against public device and healthcare statistics are the evidence that keeps Mordor Intelligence's estimate tied to what imaging systems are realistically used for across hospitals and imaging centers, instead of expanding the pool through adjacent services. The remaining spread usually comes from how each publisher handles multi modality systems, the treatment of interventional and research use cases, and the currency timing used for USD conversion, especially when the refresh cadence is slow.
Benchmark comparison
| Source | Market Size | Gaps in Research Methodology |
|---|---|---|
| Mordor Intelligence | USD 82.42 B (2026) | |
| Industry Publisher A | USD 63.40 B (2024) | Uses an earlier base year and a different scope that emphasizes manufacturer revenue by product type, which can exclude parts of the broader imaging workflow and may apply different regional coverage and currency timing. |
| Market Portal B | USD 41.70 B (2024) | Tends to size a narrower device revenue pool and can undercount higher value modalities and upgrade driven ASP increases when utilization and replacement cycles are not explicitly validated against demand signals. |
The table shows that the biggest driver is not math, it is the boundary and the year used for the starting point. By anchoring the model to observable utilization, installed base logic, and realistic ASP bands, the final value stays explainable and repeatable, even when public data depth varies by region.


Key Questions Answered in the Report
What is the current size and growth outlook of the medical imaging market?
The medical imaging market size is USD 82.42 billion in 2026 and is projected to reach USD 102.56 billion by 2031 at a 4.46% CAGR. This trajectory reflects stable demand in mature regions and faster expansion in Asia-Pacific.
Which modality and end-use segments are growing the fastest through 2031?
CT is the fastest-growing modality at a 6.39% CAGR, and diagnostic imaging centers are the fastest-growing end-use setting at a 7.11% CAGR due to site-of-service reimbursement shifts.
Which region leads and which region is expanding the fastest in medical imaging?
North America leads with 41.95% share in 2025, while Asia-Pacific is expanding the fastest at a 5.54% CAGR supported by public investment and private-chain growth.
What are the main restraints affecting capital purchases in imaging?
High equipment cost, workforce constraints, and compliance obligations are the primary restraints, including ALARA-driven dose features, interoperability requirements, and evolving regulatory standards for AI-enabled devices.
How are vendors differentiating beyond hardware specifications?
Vendors are investing in AI-native workflows, image reconstruction software, cloud connectivity, service models, and outcomes-based contracts that improve throughput and align with provider budgeting preferences.
What opportunities are emerging for portable and point-of-care imaging?
Handheld ultrasound priced below USD 5,000, mobile fleets, and workflow SaaS models that lift throughput create entry points in rural clinics, ambulatory settings, and emergency response, expanding access while preserving budgets.
Page last updated on:


