種子処理市場規模

|
|
調査期間 | 2019 - 2029 |
|
|
市場規模 (2024) | USD 73億8000万ドル |
|
|
市場規模 (2029) | USD 114.1億ドル |
|
|
市場集中度 | 高い |
|
|
最も急速に成長する市場 | アジア太平洋地域 |
|
|
CAGR(2024 - 2029) | 9.10 % |
主要プレーヤー |
||
|
|
||
|
*免責事項:主要選手の並び順不同 |
種子処理市場分析
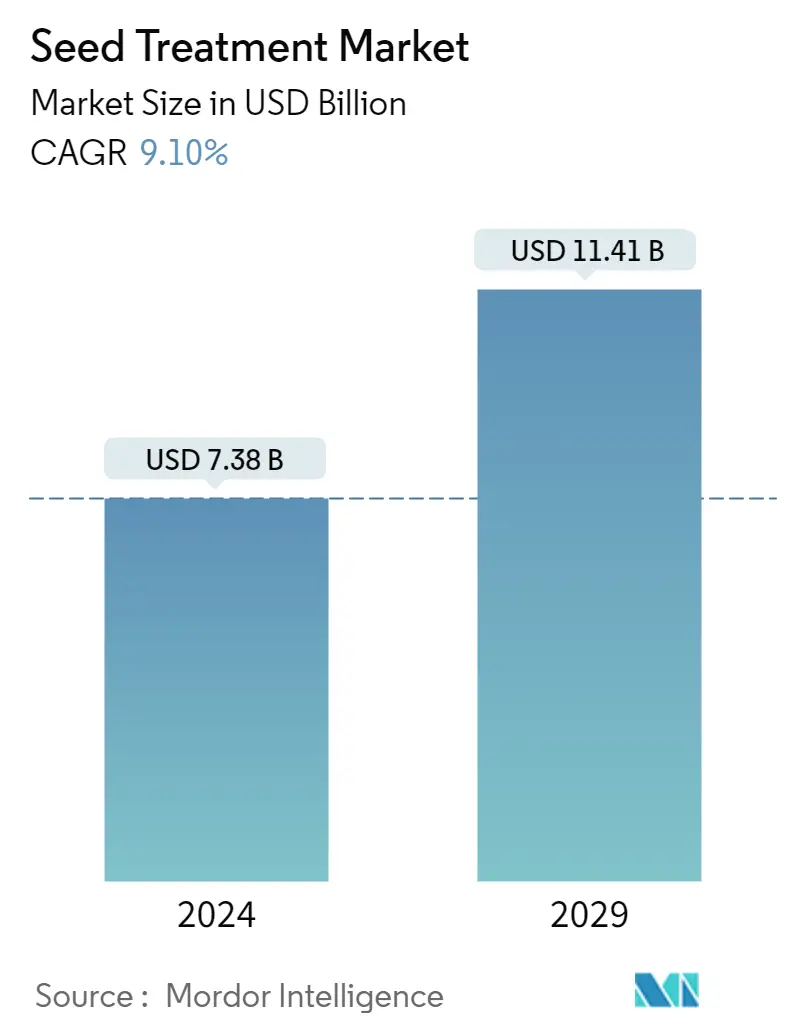
種子処理市場規模は9.10%年に73億8,000万米ドルと推定され、2029年までに114億1,000万米ドルに達すると予測されており、予測期間(2024年から2029年)中に9.10%のCAGRで成長します。
- 種子処理は、作物の出現と成長に影響を与える種子や土壌媒介の病気や害虫から種子や苗を保護する上で重要な役割を果たします。種子処理技術の進歩と農家からの高品質種子への需要の増加に伴う政府支援の増加が、予測期間中の市場の成長を推進しています。農薬の燻蒸や葉面散布に関する規制上の問題が増加しているため、農家は良質の種子に対する投資を保護する手段として種子処理を検討することが増えています。したがって、農家の間の意識の高まりにより、世界中で種子処理化学物質の販売が促進されています。
- さらに、種子処理は従来の散布よりも効果的で労力がかからないため、より手頃な価格の作物保護方法となっています。さらに、種子処理方法を農家に普及させるために、さまざまな政府が全国的なキャンペーンを組織し、農家が農薬、除草剤、殺菌剤を補助価格で入手できるようにする法案を推進しています。したがって、政府の支援の増加と種子処理の有効性により、今後数年間で種子処理市場の成長が促進される可能性があります。
- 人々の環境と健康への懸念の高まり、有機農業の人気の高まり、化学残留物を含まない農産物に対する高い需要、および生物学的種子処理の使用を奨励するために世界中の政府が行っている取り組みは、いくつかの重要な要因です。市場の成長に貢献します。
高まる高品質種子の人気
ハイブリッドや遺伝子組み換え種子に関する人気の高まりは、世界の種子処理市場の成長を促進する重要な要因である。農家は、燻蒸や農薬の葉面散布に関する規制問題の増加により、良質な種子への投資を保護するために種子処理を検討するようになっている。
望ましい農学的形質を備えた高品質の種子に対する需要の増加により、種子のコストは上昇すると予想される。企業も農家も、高品質の種子を保存するために種子処理ソリューションに費用をかける用意がある。例えば、シンジェンタは、小麦、デュラム小麦、大麦の冠腐病予防のための先駆的な種子処理剤であるVICTRATOの試験プログラムを実施した。この製剤は、シンジェンタの世界的な施設ネットワークであるシードケア研究所(SCI)の支援を受けて、オーストラリアの状況に合わせて改良された。2022年5月、シンジェンタ・クロップ・プロテクションのシードケア事業はVICTRATOを上市し、農作物の品質と収量を向上させ、土壌の長期的な健全性をサポートしたい生産者のために、線虫と病害の防除を強力に組み合わせた斬新な技術であるとしている。
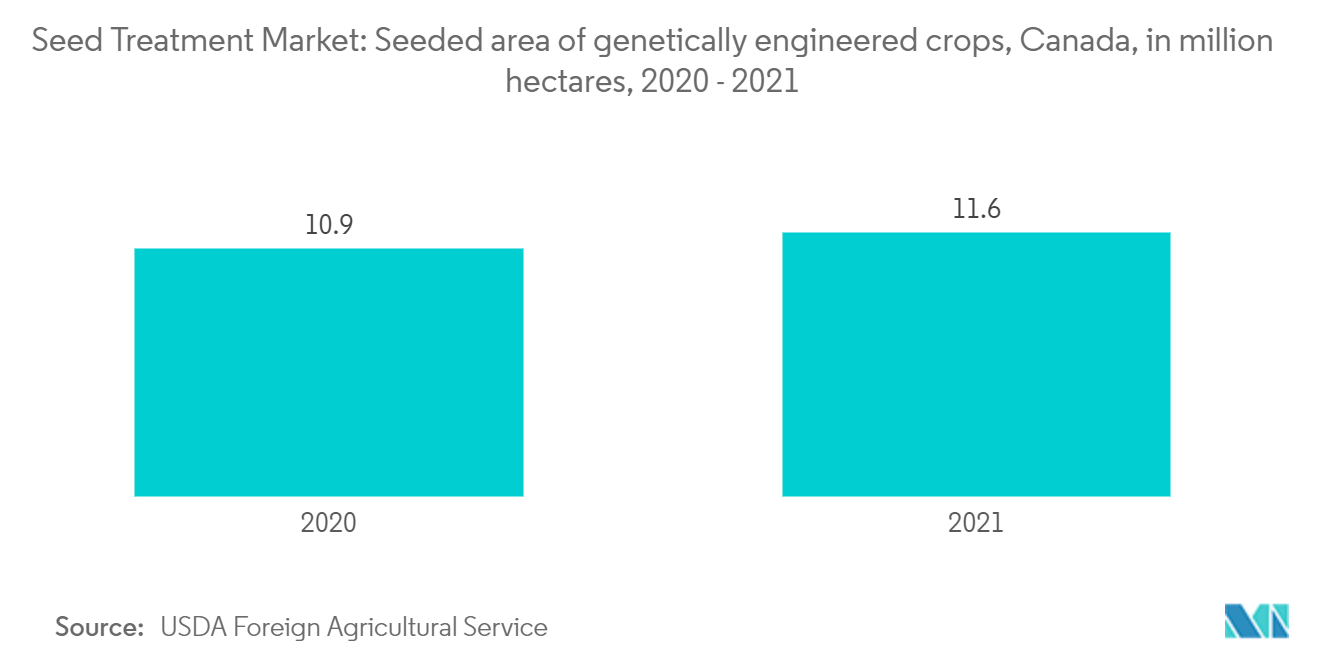
また、フレーム農家は、複数回の薬剤散布を必要としない種子を選択することで、経営コストを削減しようとしている。これらの人工種子の初期保護は、種子処理製品を使用することで確保されている。過去7年間で、トウモロコシの総営業コストに占める種子の割合は約28%から32%に増加した。ほとんどのGM種子は生物学的および化学的処理によって処理されるため生産性が高く、GM作物の栽培面積が増加しており、種子処理市場の成長にプラスの影響を与えると予想される。
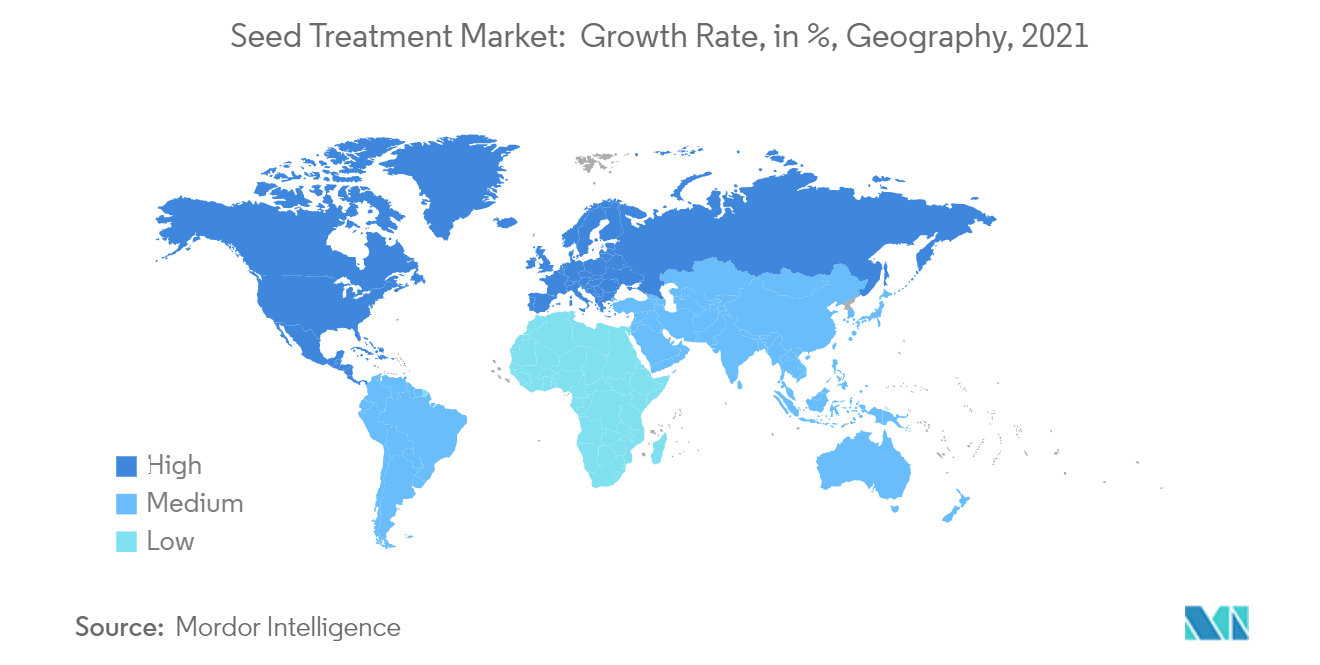
欧州が種子処理市場を独占
ヨーロッパでは種子処理市場のシェアが最も高く、スペイン、フランス、ドイツ、ロシアが続いた。穀物(トウモロコシ、大麦など)や飼料植物(アルファルファ、クローバー、菜種など)といった重要な作物では、種子処理は腐敗病や裸芽病といった炭疽病の予防に不可欠である。さらに、種子処理は作物の初期生育を助けることもできる。そのため、植物の根系を刺激するマンガンと亜鉛をベースにした種子処理剤が、この地域で人気を集めている。
2020年、スペインのテンサイ生産者は、ウイルス・イエローによる作物被害と収量の減少を経験した。農家は深刻な懸念を抱いた。彼らは、作物被害を軽減するためにクルーザーSBネオニコチノイド処理剤を使用させてほしいと嘆願を開始し、後に政府はこれを承認した。このように、昆虫や害虫による攻撃の増加、作物を守る生産者のニーズ、収穫量の増加が、この地域の市場成長を牽引している。
ある調査によると、従来の種子に比べ、この種子に1ユーロ余分に支出するごとに、農家は4.95ユーロ(4.93米ドル)の追加収入を得た。こうした収入増のほとんどは、種子処理剤を含む改良技術の使用による収量の増加によるもので、これが市場の成長に影響を及ぼしている。さらに、この地域の主要な種子生産企業による種子処理製品の発売が、種子処理市場の成長を後押ししている。例えば、2021年、ドイツの種子生産会社であるKWSは、バイオテクノロジー企業であるEvologic Technologiesと提携して、生物学的種子処理製品を発売した。従って、種子から得られるインカムゲインは、地域企業の開発増加とともに、市場の成長に寄与している。
種子処理業界の概要
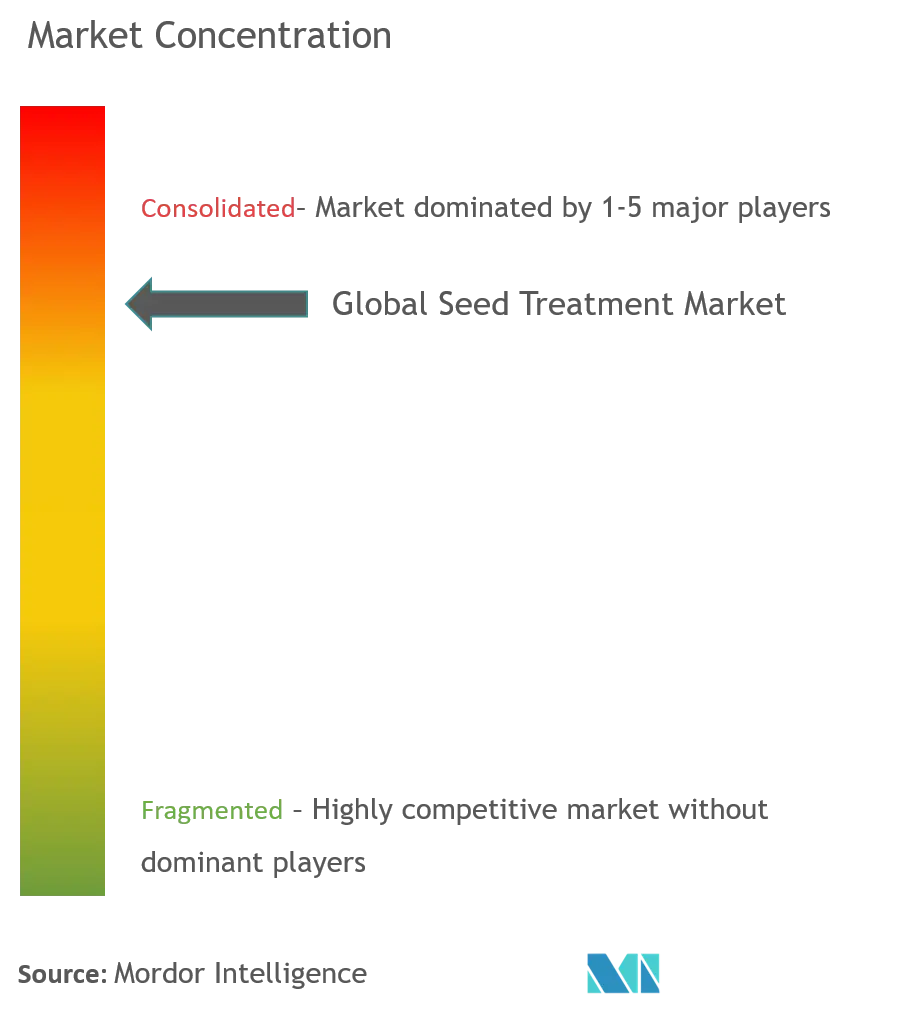
種子処理剤市場は、Syngenta International AG、Bayer CropScience AG、BASF SE、Corteva Agriscience、Croda International PLCといった複数の大手企業で固められている。同市場の大手企業は、多様で増え続ける製品ポートフォリオを提供している。各社は新製品の発売やMAに力を入れており、市場シェアの拡大に貢献している。バイオベースの種子処理製品の開発は、環境の持続可能性や新製品を開発・上市するための規制の緩和など、いくつかの利点があり、予測期間中に拡大する大きな可能性を秘めている。
種子処理市場のリーダー
Syngenta International AG
Bayer CropScience AG
BASF SE
Corteva AgriScience
Croda International PLC
*免責事項:主要選手の並び順不同
種子処理市場ニュース
2022年7月:コルテバ・アグリスサイエンスは、トウモロコシとカノーラ作物用の複数の新製品を含む2つの新しい種子処理パッケージを発売し、昆虫と病害の幅広い防除で生産者を支援する。
2022 年5 月: シンジェンタ・シードケアは、線虫と土壌伝染性の主要な菌類病害を防除し、 大豆、トウモロコシ、穀類、綿花、稲を含む多くの作物の品質と収量を向上させる種子処理剤 Victrato を発売した。
2022年5月:バイエルは、早場米の種子をいもち病菌から守り、稲作農家の作物生産性と資源有効性を向上させる新しい種子処理ソリューション、Routine Startを発売。
種子処理市場レポート - 目次
0. 導入
0_0. 研究の前提条件と市場の定義
0_1. 研究の範囲
1. 研究方法
2. エグゼクティブサマリー
3. 市場ダイナミクス
3_0. 市場概況
3_1. 市場の推進力
3_2. 市場の制約
3_3. 業界の魅力 - ポーターのファイブフォース分析
3_3_0. サプライヤーの交渉力
3_3_1. 買い手の交渉力
3_3_2. 新規参入の脅威
3_3_3. 代替品の脅威
3_3_4. 競争の激しさ
4. 市場セグメンテーション
4_0. 用途別
4_0_0. 化学薬品
4_0_1. ノンケミカル/バイオロジカル
4_1. 機能別
4_1_0. 種子の保護
4_1_1. シードの強化
4_1_2. その他の機能
4_2. 作物の種類別
4_2_0. 穀物およびシリアル
4_2_1. 油糧種子
4_2_2. 野菜
4_2_3. その他の作物タイプ
4_3. 応用技術別
4_3_0. シードコーティング
4_3_1. 種子ペレット化
4_3_2. 種子ドレッシング
4_3_3. その他の応用テクニック
4_4. 地理別
4_4_0. 北米
4_4_0_0. アメリカ
4_4_0_1. カナダ
4_4_0_2. メキシコ
4_4_0_3. 北米のその他の地域
4_4_1. ヨーロッパ
4_4_1_0. スペイン
4_4_1_1. イギリス
4_4_1_2. フランス
4_4_1_3. ドイツ
4_4_1_4. ロシア
4_4_1_5. イタリア
4_4_1_6. ヨーロッパの残りの部分
4_4_2. アジア太平洋地域
4_4_2_0. 中国
4_4_2_1. 日本
4_4_2_2. インド
4_4_2_3. オーストラリア
4_4_2_4. 残りのアジア太平洋地域
4_4_3. 南アメリカ
4_4_3_0. ブラジル
4_4_3_1. アルゼンチン
4_4_3_2. 南アメリカの残りの地域
4_4_4. アフリカ
4_4_4_0. 南アフリカ
4_4_4_1. アフリカの残りの部分
5. 競争環境
5_0. 最も採用されている戦略
5_1. 市場シェア分析
5_2. 会社概要
5_2_0. Adama Agricultural Solutions Ltd
5_2_1. Advanced Biological Marketing Inc.
5_2_2. BASF SE
5_2_3. Bayer Cropscience AG
5_2_4. Bioworks Inc.
5_2_5. Corteva Agriscience
5_2_6. Germains Seed Technology
5_2_7. Croda International PLC (Incotec Group BV)
5_2_8. Nufarm Ltd
5_2_9. Plant Health Care
5_2_10. Precision Laboratories Inc.
5_2_11. Syngenta International AG
5_2_12. Valent Biosciences Corporation
5_2_13. Verdesian Life Sciences
6. 市場機会と将来のトレンド
種子処理産業のセグメント化
種子処理製品は、生物学的、物理的、化学的な薬剤や技術を種子に適用し、健全な作物の保護や定着を向上させるものである。
種子処理市場は、用途(化学的および非化学的/生物学的)、機能(種子保護、種子強化、その他の機能)、作物タイプ(穀物・穀類、油糧種子、野菜、その他の作物タイプ)、適用技術(種子コーティング、種子ペレット化、種子ドレッシング、その他の適用技術)、地域(北米、欧州、アジア太平洋、南米、アフリカ)で区分される。レポートでは、上記のすべてのセグメントについて、金額(百万米ドル)での市場規模と予測を提供しています。
| 用途別 | ||
| ||
|
| 機能別 | ||
| ||
| ||
|
| 作物の種類別 | ||
| ||
| ||
| ||
|
| 応用技術別 | ||
| ||
| ||
| ||
|
| 地理別 | ||||||||||||||||
| ||||||||||||||||
| ||||||||||||||||
| ||||||||||||||||
| ||||||||||||||||
|
市場の定義
- Vehicle Types - Passenger Vehicles, Commercial Vehicles and Motorcycles are the vehicle types considered under the automotive lubricants market.
- Product Types - For the purpose of this study, lubricant products such as engine oils, transmission oils, greases and hydraulic fluids are taken into consideration.
- Service Refill - Service refill is the primary factor considered while accounting the lubricant consumption for each of the vehicle segments, under the study.
- Factory Fill - First lubricant fill-ups for newly produced vehicles are considered.
研究方法論
Mordor Intelligenceは、すべてのレポートで4段階の方法論に従います。


