North America Fungicide Market Size and Share
Market Overview
| Study Period | 2018 - 2031 |
|---|---|
| Forecast Data Period | 2026 - 2031 |
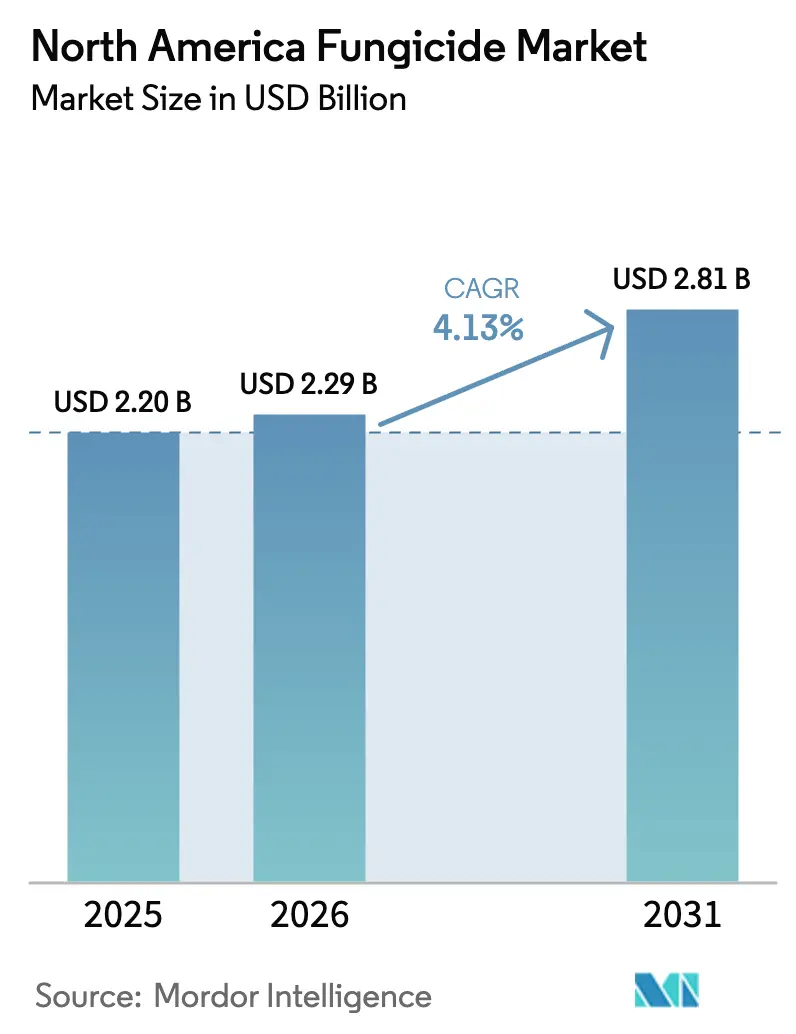
| Base Year Market Size (2025) | USD 2.20 Billion |
| Market Size (2026) | USD 2.29 Billion |
| Market Size (2031) | USD 2.81 Billion |
| Growth Rate (2026 - 2031) | 4.13% CAGR |
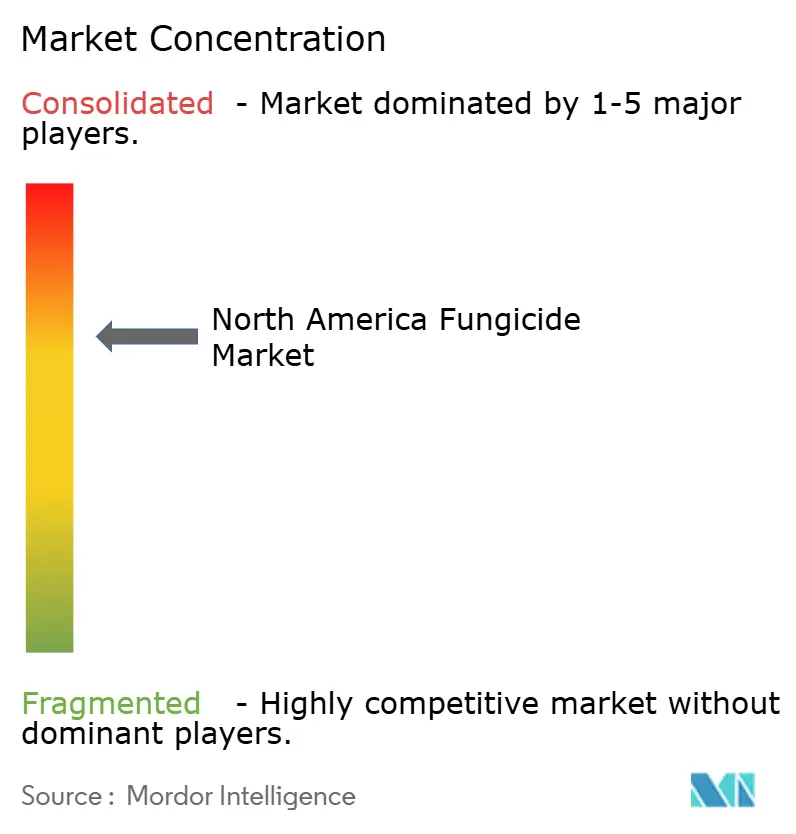
| Market Concentration | Medium |
Major Players *Disclaimer: Major Players sorted in no particular order Image © Mordor Intelligence. Reuse requires attribution under CC BY 4.0. | |
North America Fungicide Market Analysis by Mordor Intelligence
North America fungicide market size in 2026 is estimated at USD 2.29 billion, growing from 2025 value of USD 2.20 billion with 2031 projections showing USD 2.81 billion, growing at 4.13% CAGR over 2026-2031. The region’s growers continue to deploy fungicides to counter rising pathogen pressure while complying with tightening residue and environmental rules. Precision agriculture tools, biological formulations, and seed-treatment technologies help producers maintain yields even as application volumes level off. Digital platforms that connect weather data, crop phenology, and predictive disease models simplify decision-making and improve input efficiency. Parallel growth in carbon-credit programs encourages sustainable fungicide use that protects soil health and lowers off-farm emissions, reinforcing an integrated approach to crop protection throughout the North America fungicide market.[1]Source: USDA, “Climate-Smart Commodities Program,” usda.gov
Key Report Takeaways
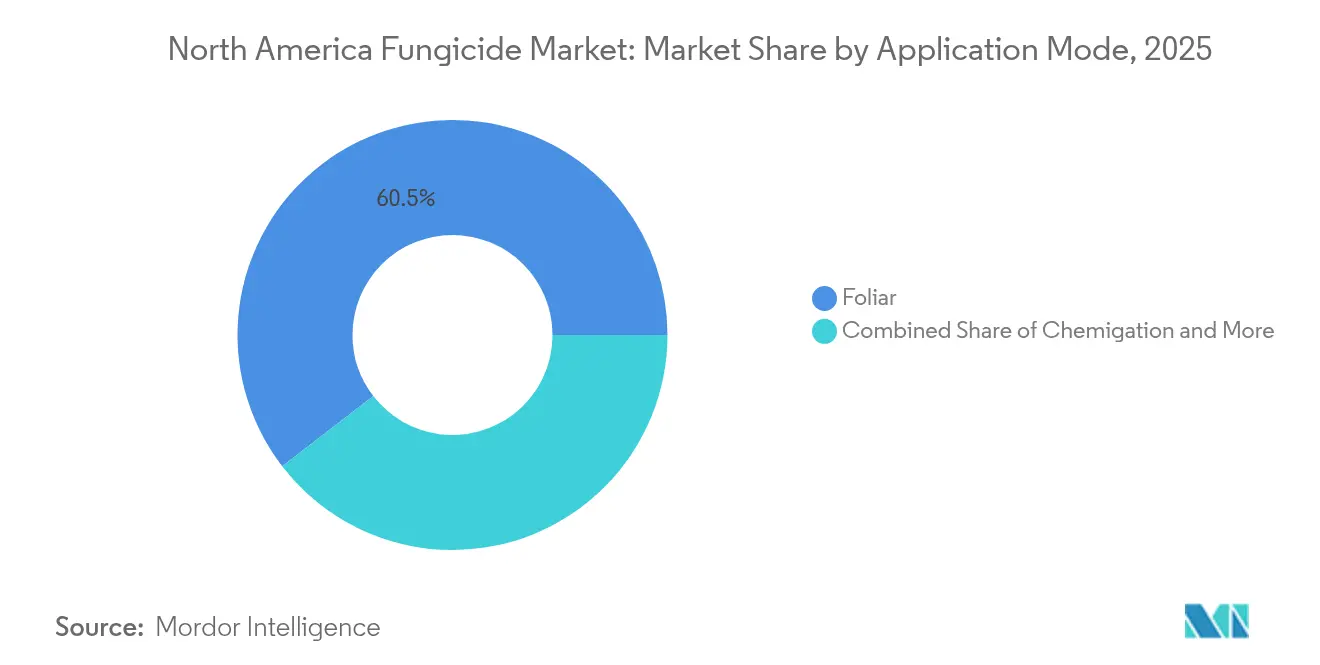
- By application mode, foliar treatments led with 60.45% of the North America fungicide market share in 2025 and are expected to expand at a 4.28% CAGR through 2031.
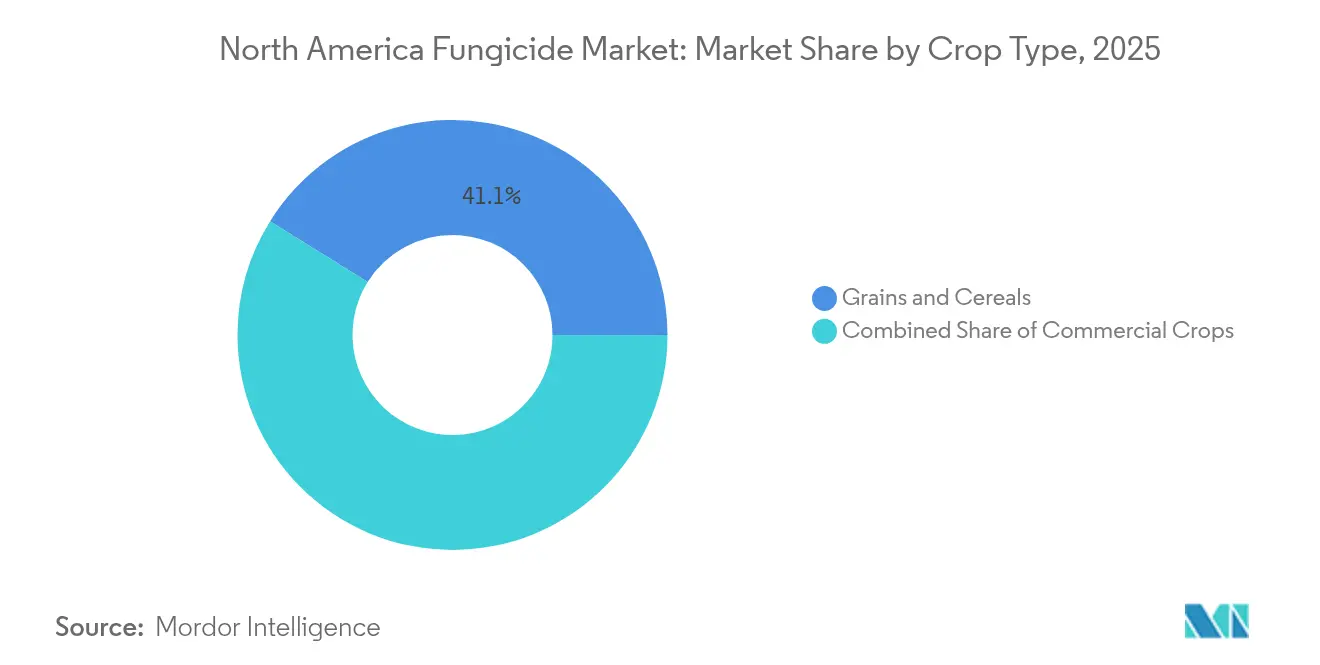
- By crop type, grains and cereals accounted for 41.12% of the North America fungicide market size in 2025 and are expected to expand at a 4.29% CAGR through 2031.
- By geography, the United States commanded 46.85% of revenue in 2025, while Mexico is set to rise at a 4.69% CAGR to 2031.
Note: Market size and forecast figures in this report are generated using Mordor Intelligence’s proprietary estimation framework, updated with the latest available data and insights as of 2026.
North America Fungicide Market Trends and Insights
Drivers Impact Analysis*
| Driver | (~) % Impact on CAGR Forecast | Geographic Relevance | Impact Timeline |
|---|---|---|---|
| Rising incidence of fungicide-resistant pathogens | +1.2% | North America-wide, concentrated in corn belt and vegetable regions | Medium term (2-4 years) |
| Expansion of protected fruit and vegetable acreage | +0.8% | Canada and Mexico core, spillover to US specialty crop regions | Long term (≥ 4 years) |
| Shift toward seed-treatment fungicides | +0.6% | US Midwest and Canadian Prairie provinces | Short term (≤ 2 years) |
| Drone-based ultra-low-volume spraying uptake | +0.5% | US corn belt, expanding to Canadian grain regions | Medium term (2-4 years) |
| Predictive disease-modeling platforms adoption | +0.4% | Technology-forward regions in US and Canada | Medium term (2-4 years) |
| State-level carbon-credit incentives | +0.3% | US states with climate-smart agriculture programs | Long term (≥ 4 years) |
| Source: Mordor Intelligence | |||
Rising Incidence of Fungicide-Resistant Pathogens
Widespread resistance in Botrytis cinerea, Phytophthora infestans, and Cercospora beticola pressures growers to rotate chemistries and integrate multi-site actives. University tests show QoI-resistant strains in rice and sugar beet fields, elevating demand for novel modes of action. Premium-priced combination products safeguard yields in high-risk zones and align with U.S. Environmental Protection Agency (EPA) stewardship rules for resistance management. Portfolio breadth, therefore, becomes a strategic differentiator for suppliers competing in the North America fungicide market. Deeper extension outreach further raises grower awareness of resistance trends, reinforcing balanced programs that include cultural and biological tactics.
Expansion of Protected Fruit and Vegetable Acreage
Greenhouse and shade-house footprints now cover over 71,000 ha across Canada, Mexico, and the United States, doubling over the last decade.[2]Source: Rabobank, “North American Protected Agriculture Market Analysis,” research.rabobank.com Enclosed systems favor warm, humid conditions that accelerate fungal cycles, prompting spray frequencies three to five times greater than in open fields. Consistent year-round production smooths fungicide demand across seasons, creating predictable revenue for suppliers. Biological agents gain traction inside protected units, so suppliers reformulate actives that remain compatible with beneficial insects and microbes. Tight climate controls enable drone and rail sprayers that place fungicides accurately on dense canopies, strengthening value propositions in the North America fungicide market.
Shift Toward Seed-Treatment Fungicides
Corn seed treatment penetration exceeds 85% and soybean treatment adoption nears 70% in key states.[3]Source: USDA National Agricultural Statistics Service, “Agricultural Chemical Usage Survey,” nass.usda.gov Encapsulating fungicides on the seed trims spray drift, shortens labor windows, and supports compliance with pollinator-protection directives. Premium formulations couple systemic actives with inoculants to defend seedlings through V4 growth stages. Chemical suppliers and planters collaborate to calibrate low-dust recipes that maintain flowability and stand counts. Given that registrants face fewer field-exposure studies for seed treatments, development pipelines tilt toward this delivery route, lifting the North America fungicide market over the near term.
Drone-Based Ultra-Low-Volume Spraying Uptake
University plots confirm 15-20% active-ingredient savings when drones apply variable rates driven by canopy imaging. Reduced carrier volumes cut refill stops and shrink water use, while sub-one-meter flight heights limit drift. Specialty crop estates that value rapid coverage invest first, but grain growers soon follow as drone fleets scale. New formulations with wider droplet-spectrum stability sustain efficacy at diluted volumes, supporting premium pricing tiers. Regulators increasingly favor technologies that minimize off-target movement, accelerating drone adoption across the North America fungicide market.
Restraints Impact Analysis*
| Restraint | (~) % Impact on CAGR Forecast | Geographic Relevance | Impact Timeline |
|---|---|---|---|
| Stringent EPA re-registration reviews | -0.7% | United States, with spillover effects to Canada and Mexico | Short term (≤ 2 years) |
| Retailer residue-limit pressure | -0.5% | North America-wide, concentrated in export-oriented regions | Medium term (2-4 years) |
| Biologic seed treatments cannibalization | -0.4% | US Midwest and Canadian grain regions | Long term (≥ 4 years) |
| Sulfur/raw-material price volatility | -0.3% | North America-wide manufacturing and distribution | Short term (≤ 2 years) |
| Source: Mordor Intelligence | |||
Stringent EPA Re-registration Reviews
The EPA’s accelerated schedule demands costly ecotoxicology and endangered species studies, pushing registrants to spend USD 15–25 million per active ingredient. Uncertainty over label revisions delays product launches and discourages investment in narrow-acre crops. Firms divert budgets toward biologicals that face shorter review cycles. The ripple effect reaches Canada’s Pest Management Regulatory Agency (PMRA) and Mexico’s Servicio Nacional de Sanidad, Inocuidad y Calidad Agroalimentaria (SENASICA), which often align with EPA outcomes. Constrained portfolios slow innovation flow into the North America fungicide market.
Retailer Residue-Limit Pressure
Although 99.5% of domestic samples stay below legal limits, leading grocery chains impose tighter private standards that restrict active-ingredient choice. European Union maximum residue limits add another compliance layer for exporters. Growers lengthen pre-harvest intervals or switch to biological alternatives, sometimes boosting application counts to maintain control. Documentation and testing expenses rise, especially for small and mid-size producers. Suppliers respond with low-residue labels and rapid-degradation chemistries, yet adoption costs temper overall demand.
*Our forecasts treat driver/restraint impacts as directional, not additive. The impact forecasts reflect baseline growth, mix effects, and variable interactions.
Segment Analysis
By Application Mode: Foliar Dominance Leads Precision Upgrades
Foliar sprays retained 60.45% share of the North America fungicide market in 2025, supported by broad label coverage and adaptability to nearly every crop. Compatibility with drone boom kits and electrostatic nozzles underpins a 4.28% CAGR to 2031. Growers fine-tune droplet spectra to target leaf layers and reduce runoff, aided by adjuvant advances. Chemigation follows in irrigated vegetables, where fertigation lines allow fungicide pulses timed to plant stress events. Fumigation remains niche in strawberry and nursery soils but commands high margins. Soil and in-furrow treatments rise slowly in conservation tillage systems, seeking soilborne pathogen control with minimal surface disturbance. Seed treatment, while only 13.62% of revenue in 2025, logs the second fastest absolute gains. Uptake accelerates as planters automate on-the-fly rate modulation tied to real-time soil temperature sensors. EPA priorities for pollinator safety favor seed treatments that reduce secondary exposure, ensuring the segment’s momentum within the North America fungicide market.
Companies bundle living microbes with low-dose chemical partners and micronutrients in single-pass coatings, trimming labor while extending protection windows. The approach appeals to regenerative farming advocates targeting carbon footprints and soil health metrics. These trends collectively reinforce an integrated delivery portfolio that keeps the North America fungicide market responsive to evolving regulatory and sustainability mandates.


By Crop Type: Grains Anchor Volume while Fruits Drive Value
Grains and cereals delivered 41.12% of 2025 revenue and will advance at a 4.29% CAGR through 2031 as corn, wheat, and rice rotations intensify disease management. Widespread strobilurin resistance in key pathogens encourages tank mixes of triazoles and succinate dehydrogenase inhibitors, lifting average application cost per hectare. Fruits and vegetables, harvested mainly from protected houses, contribute disproportionate value given higher spray counts and premium actives tailored to residue-sensitive export chains. Growers in tomato, pepper, and berry segments pay for softer chemistries that preserve beneficial arthropod balances, boosting margins for suppliers.
Pulses and oilseeds draw interest from Canadian growers integrating fungicides to prevent quality downgrades tied to sclerotinia infections. Turf and ornamentals post steady demand from golf courses and municipal landscapes, where low-dose micro-encapsulated formulations minimize public exposure. Commercial crops such as cotton and tobacco use specialized programs that include at-plant soil drenches followed by foliar covers aligned with moisture events. The diversity of crop cycles and disease complexes sustains a resilient revenue base that shields the North America fungicide market from single-crop volatility.
Geography Analysis
The United States held 46.85% of regional revenue in 2025 thanks to expansive acreage and sophisticated distribution channels. Corn Belt states use predictive models that link meteorological stations with smartphone alerts to synchronize fungicide timing. California’s fruit belt demands zero-drift delivery systems that satisfy air-quality districts and retailer protocols, encouraging electrostatic and drone technologies. Federal carbon-smart pilots reward low-emission fungicide programs, steering adopters toward biologicals and precision devices.
Mexico registers the highest forecast pace at a 4.69% CAGR through 2031. Greenhouse surfaces now exceed 50,000 hectares and service year-round shipments to North American grocers. SENASICA cut dossier turnaround times by 15 months, speeding advanced chemistry access for protected crops. Growers average 8-12 sprays per cycle inside climate-controlled houses, using blue-light sensitive tracers to verify coverage. Cross-border chemical re-packagers harmonize labels to U.S. and Canadian languages, easing logistics for integrated supply chains inside the North America fungicide market.
Canada’s Prairie Provinces intensify cereal rotations, often applying fungicides at flag-leaf and heading stages to combat fusarium head blight that threatens grade and mycotoxin thresholds. Health Canada PMRA aligns re-evaluation timelines with the EPA yet tailors pollinator risk mitigation to canola landscapes. Greenhouse vegetables double capacity since 2015, extending fungicide demand into winter. Remote scouting drones and AI-powered imagery spot powdery mildew clusters early, allowing spot treatments that conserve product and satisfy retailer residue audits.
Competitive Landscape
The North America fungicide market displays moderate concentration; the top five suppliers occupy a significant market share. Integrated giants such as Syngenta, Bayer, BASF, Corteva Agriscience, and FMC leverage captive active-ingredient synthesis, regionwide sales and agronomy networks, and multi-crop label libraries. Digital platforms tie product choice to satellite and drone imagery, embedding fungicide sales into subscription decision tools.
Mid-tier players like Nufarm and UPL add capacity through toll manufacturing and private-label blends that fill distribution gaps. Specialty houses such as Valent USA concentrate on soft-chemistry solutions for fruits and vegetables, winning share in residue-sensitive markets. Patent filings for drone-ready formulations and living-microbe delivery systems rose 28% year over year at the United States Patent and Trademark Office (USPTO). Competitive advantage shifts from sheer volume to ecosystem integration that meshes chemistry, biology, hardware, and software into seamless management packages.
Growing retailer scrutiny and carbon accounting invite co-branding partnerships between agrochemical firms and food companies. Suppliers commit to field-level data transparency, often using blockchain ledgers to verify fungicide practices. Companies that marry product efficacy with traceable sustainability metrics will strengthen pricing power and customer loyalty across the North America fungicide market.
North America Fungicide Industry Leaders
BASF SE
Bayer AG
Corteva Agriscience
Syngenta Group
UPL Limited
- *Disclaimer: Major Players sorted in no particular order

Recent Industry Developments
- October 2025: BASF received EPA approval for Zorina fungicide, which controls white mold and foliar diseases in soybeans, canola, and dry beans. The fungicide combines Endura and Revysol fungicides to provide broad-spectrum, long-lasting disease control for improved yield potential.
- June 2025: FMC Corporation and Corteva Agriscience formed a partnership to provide U.S. growers with increased access to fluindapyr fungicide technology. The agreement allows Corteva to distribute fluindapyr-based products, expanding disease control solutions for major crops.
- September 2024: Syngenta received registration in California for Postiva fungicide, which provides broad-spectrum disease control for specialty crops, including grapes, almonds, and strawberries. The fungicide combines ADEPIDYN and difenoconazole active ingredients to deliver both preventive and curative protection, supporting plant health and potential yield improvements.


North America Fungicide Market Report Scope
The North America Fungicide Market Report is Segmented by Application Mode (Chemigation, Foliar, Fumigation, Seed Treatment, and Soil Treatment), Crop Type (Commercial Crops, Fruits and Vegetables, Grains and Cereals, Pulses and Oilseeds, and Turf and Ornamental), and Geography (Canada, Mexico, United States, and Rest of North America). The Market Forecasts are provided in terms of Value (USD) and Volume (Metric Tons).
| Chemigation |
| Foliar |
| Fumigation |
| Seed Treatment |
| Soil Treatment |
| Commercial Crops |
| Fruits and Vegetables |
| Grains and Cereals |
| Pulses and Oilseeds |
| Turf and Ornamental |
| Canada |
| Mexico |
| United States |
| Rest of North America |
| Application Mode | Chemigation |
| Foliar | |
| Fumigation | |
| Seed Treatment | |
| Soil Treatment | |
| Crop Type | Commercial Crops |
| Fruits and Vegetables | |
| Grains and Cereals | |
| Pulses and Oilseeds | |
| Turf and Ornamental | |
| Country | Canada |
| Mexico | |
| United States | |
| Rest of North America |


Market Definition
- Function - Fungicides are chemicals used to control or prevent fungi from damaging the crop and prevent yield loss.
- Application Mode - Foliar, Seed Treatment, Soil Treatment, Chemigation, and Fumigation are the different type of application modes through which crop protection chemicals are applied to the crops.
- Crop Type - This represents the consumption of crop protection chemicals by Cereals, Pulses, Oilseeds, Fruits, Vegetables, Turf, and Ornamental crops.
| Keyword | Definition |
|---|---|
| IWM | Integrated weed management (IWM) is an approach to incorporate multiple weed control techniques throughout the growing season to give producers the best opportunity to control problematic weeds. |
| Host | Hosts are the plants that form relationships with beneficial microorganisms and help them colonize. |
| Pathogen | A disease-causing organism. |
| Herbigation | Herbigation is an effective method of applying herbicides through irrigation systems. |
| Maximum residue levels (MRL) | Maximum Residue Limit (MRL) is the maximum allowed limit of pesticide residue in food or feed obtained from plants and animals. |
| IoT | The Internet of Things (IoT) is a network of interconnected devices that connect and exchange data with other IoT devices and the cloud. |
| Herbicide-tolerant varieties (HTVs) | Herbicide-tolerant varieties are plant species that have been genetically engineered to be resistant to herbicides used on crops. |
| Chemigation | Chemigation is a method of applying pesticides to crops through an irrigation system. |
| Crop Protection | Crop protection is a method of protecting crop yields from different pests, including insects, weeds, plant diseases, and others that cause damage to agricultural crops. |
| Seed Treatment | Seed treatment helps to disinfect seeds or seedlings from seed-borne or soil-borne pests. Crop protection chemicals, such as fungicides, insecticides, or nematicides, are commonly used for seed treatment. |
| Fumigation | Fumigation is the application of crop protection chemicals in gaseous form to control pests. |
| Bait | A bait is a food or other material used to lure a pest and kill it through various methods, including poisoning. |
| Contact Fungicide | Contact pesticides prevent crop contamination and combat fungal pathogens. They act on pests (fungi) only when they come in contact with the pests. |
| Systemic Fungicide | A systemic fungicide is a compound taken up by a plant and then translocated within the plant, thus protecting the plant from attack by pathogens. |
| Mass Drug Administration (MDA) | Mass drug administration is the strategy to control or eliminate many neglected tropical diseases. |
| Mollusks | Mollusks are pests that feed on crops, causing crop damage and yield loss. Mollusks include octopi, squid, snails, and slugs. |
| Pre-emergence Herbicide | Preemergence herbicides are a form of chemical weed control that prevents germinated weed seedlings from becoming established. |
| Post-emergence Herbicide | Postemergence herbicides are applied to the agricultural field to control weeds after emergence (germination) of seeds or seedlings. |
| Active Ingredients | Active ingredients are the chemicals in pesticide products that kill, control, or repel pests. |
| United States Department of Agriculture (USDA) | The Department of Agriculture provides leadership on food, agriculture, natural resources, and related issues. |
| Weed Science Society of America (WSSA) | The WSSA, a non-profit professional society, promotes research, education, and extension outreach activities related to weeds. |
| Suspension concentrate | Suspension concentrate (SC) is one of the formulations of crop protection chemicals with solid active ingredients dispersed in water. |
| Wettable powder | A wettable powder (WP) is a powder formulation that forms a suspension when mixed with water prior to spraying. |
| Emulsifiable concentrate | Emulsifiable concentrate (EC) is a concentrated liquid formulation of pesticide that needs to be diluted with water to create a spray solution. |
| Plant-parasitic nematodes | Parasitic Nematodes feed on the roots of crops, causing damage to the roots. These damages allow for easy plant infestation by soil-borne pathogens, which results in crop or yield loss. |
| Australian Weeds Strategy (AWS) | The Australian Weeds Strategy, owned by the Environment and Invasives Committee, provides national guidance on weed management. |
| Weed Science Society of Japan (WSSJ) | WSSJ aims to contribute to the prevention of weed damage and the utilization of weed value by providing the chance for research presentation and information exchange. |


Research Methodology
Mordor Intelligence follows a four-step methodology in all our reports.
- Step-1: Identify Key Variables: In order to build a robust forecasting methodology, the variables and factors identified in Step-1 are tested against available historical market numbers. Through an iterative process, the variables required for market forecast are set and the model is built on the basis of these variables.
- Step-2: Build a Market Model: Market-size estimations for the forecast years are in nominal terms. Inflation is not a part of the pricing, and the average selling price (ASP) is kept constant throughout the forecast period.
- Step-3: Validate and Finalize: In this important step, all market numbers, variables and analyst calls are validated through an extensive network of primary research experts from the market studied. The respondents are selected across levels and functions to generate a holistic picture of the market studied.
- Step-4: Research Outputs: Syndicated Reports, Custom Consulting Assignments, Databases & Subscription Platforms


