Juices Market Size and Share
Market Overview
| Study Period | 2021 - 2031 |
|---|---|
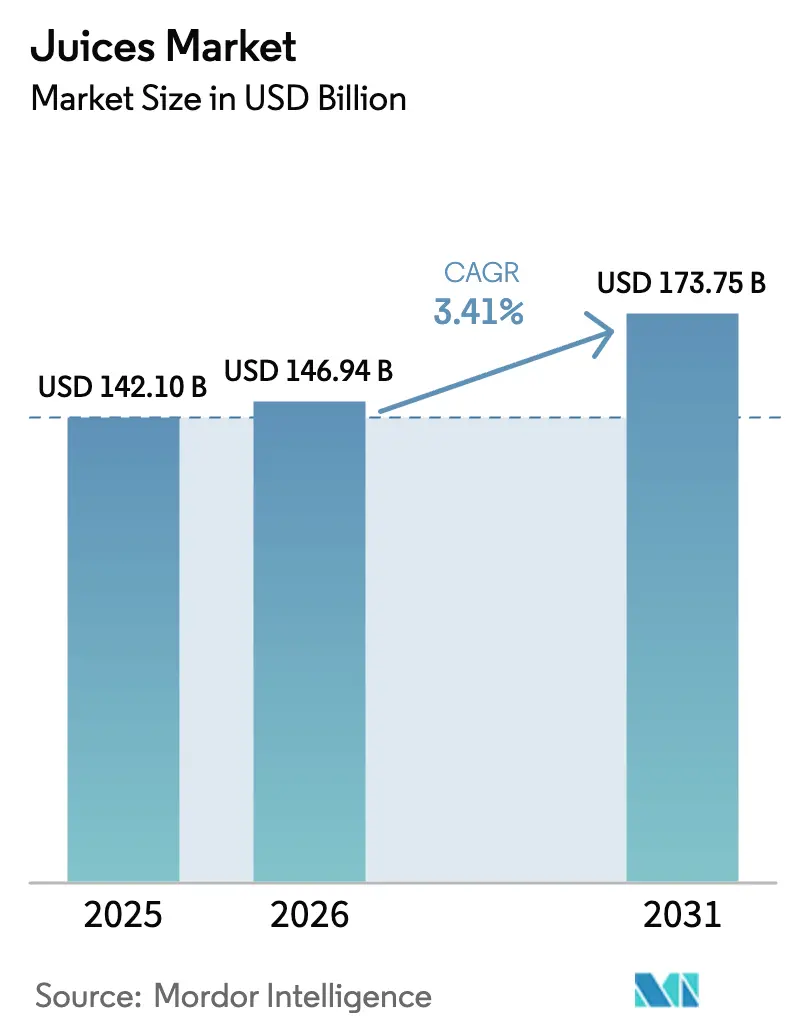
| Market Size (2026) | USD 146.94 Billion |
| Market Size (2031) | USD 173.75 Billion |
| Growth Rate (2026 - 2031) | 3.41% CAGR |
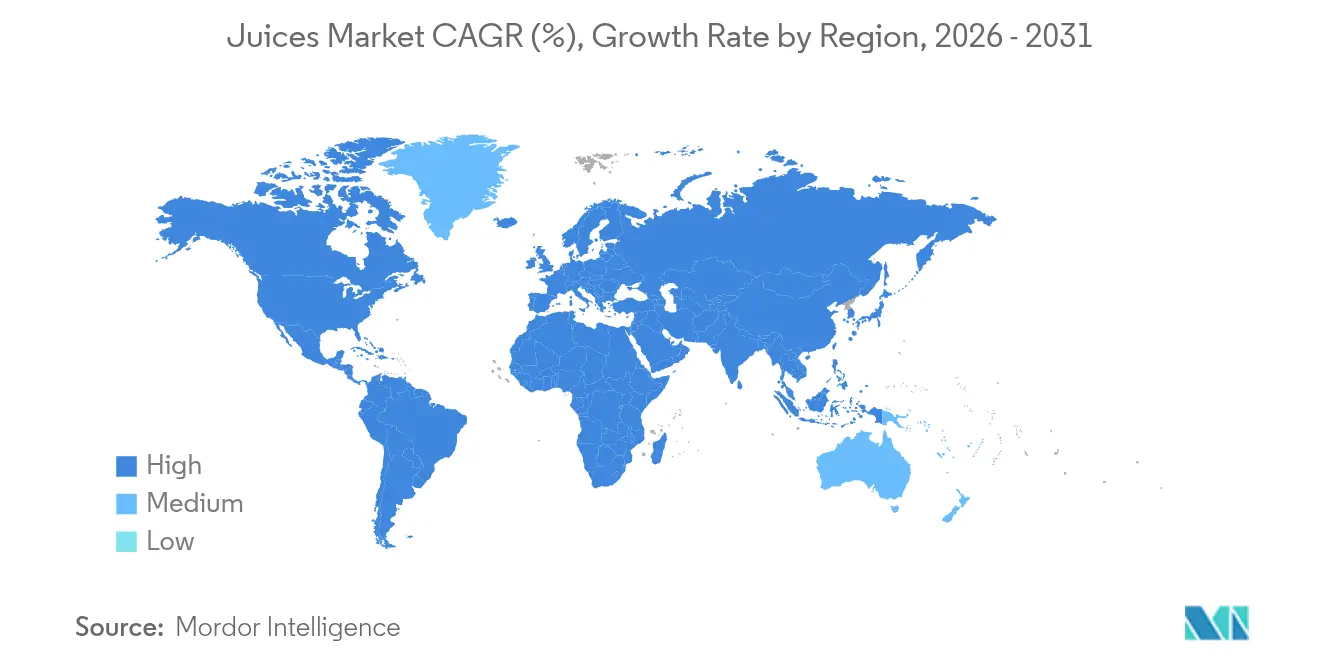
| Fastest Growing Market | Asia Pacific |
| Largest Market | North America |
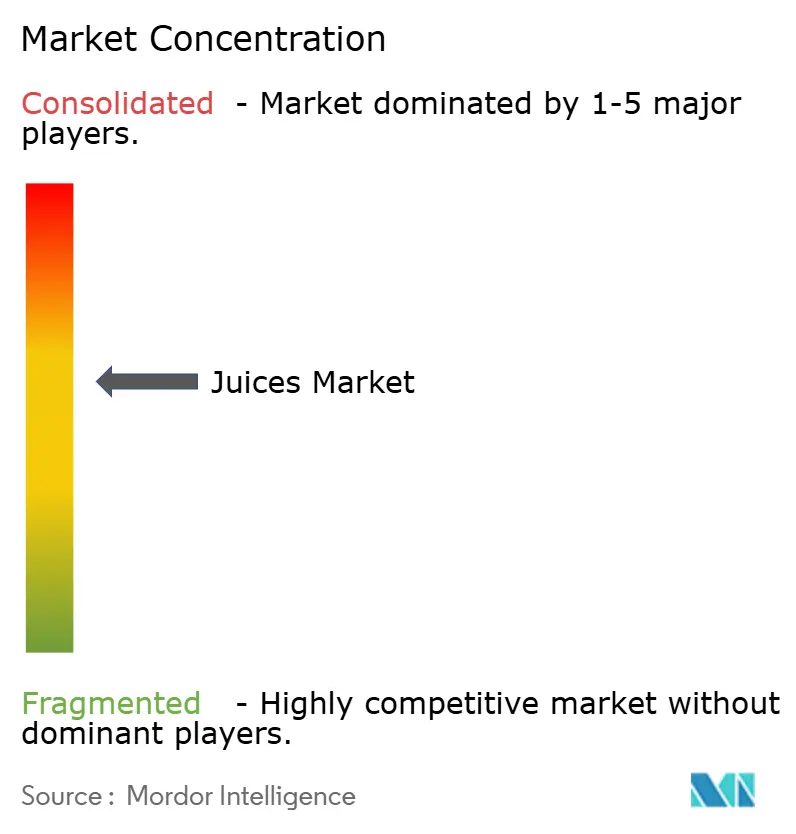
| Market Concentration | Medium |
Major Players
*Disclaimer: Major Players sorted in no particular order Image © Mordor Intelligence. Reuse requires attribution under CC BY 4.0. |
|
Juices Market Analysis by Mordor Intelligence
The global juices market size is expected to grow from USD 142.10 billion in 2025 to USD 146.94 billion in 2026 and is forecast to reach USD 173.75 billion by 2031 at 3.41% CAGR over 2026-2031. Growth in the market is driven by strong demand for premium, minimally processed products, counterbalanced by the expansion of sugar taxes in over 45 jurisdictions and climate-related challenges affecting citrus and apple harvests. Factors such as functional fortification, the rapid development of cold-chain infrastructure in the Asia-Pacific region, and the adoption of aseptic cartons, which reduce lifecycle carbon emissions by 30%, are contributing to value creation. Additionally, sugar-conscious consumers are driving the transition to 100% juice and not-from-concentrate (NFC) options, while organic-certified products are commanding higher price premiums in North America and Europe. Competitive dynamics are shifting toward smaller, high-margin segments, including direct-to-consumer cold-pressed shots, probiotic blends, and blockchain-verified provenance, which align with ESG-focused procurement trends.
Key Report Takeaways
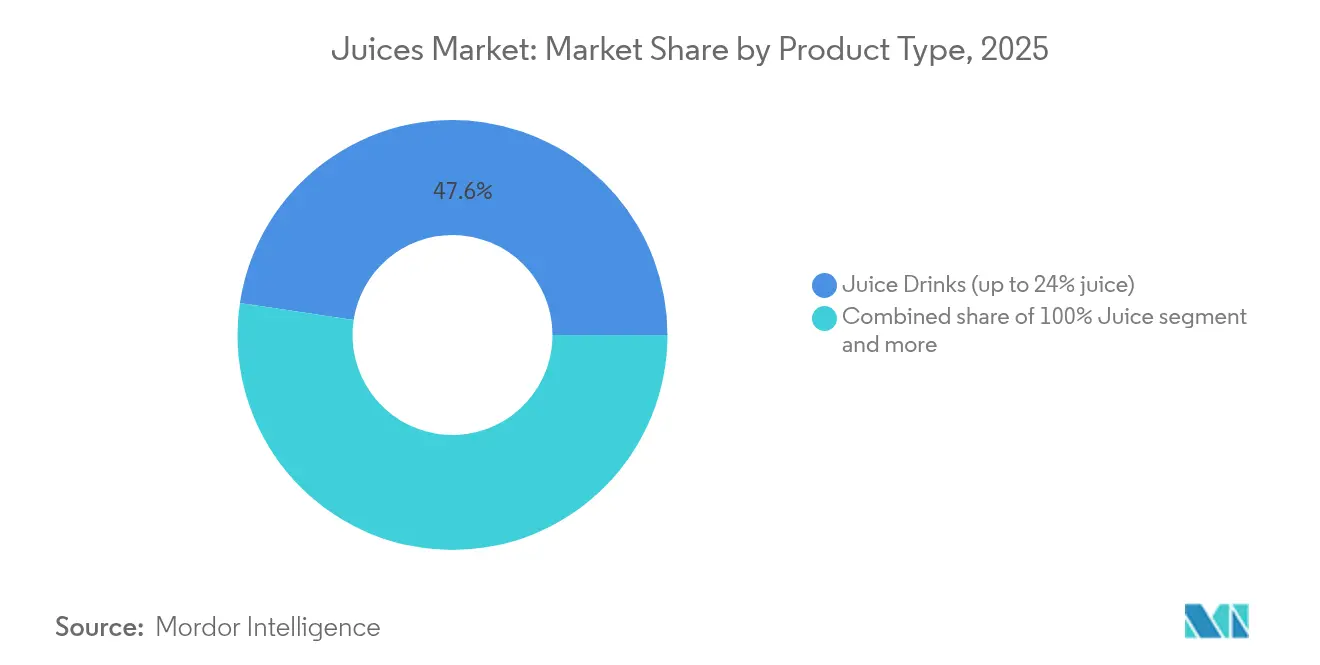
- By product type, juice drinks (up to 24% juice) led with 47.62% of the global juices market share in 2025, while 100% juice is forecast to post the fastest 3.94% CAGR through 2031.
- By packaging type, PET bottles captured 38.78% of 2025 revenue, whereas aseptic packages are on track for the highest 4.31% CAGR to 2031.
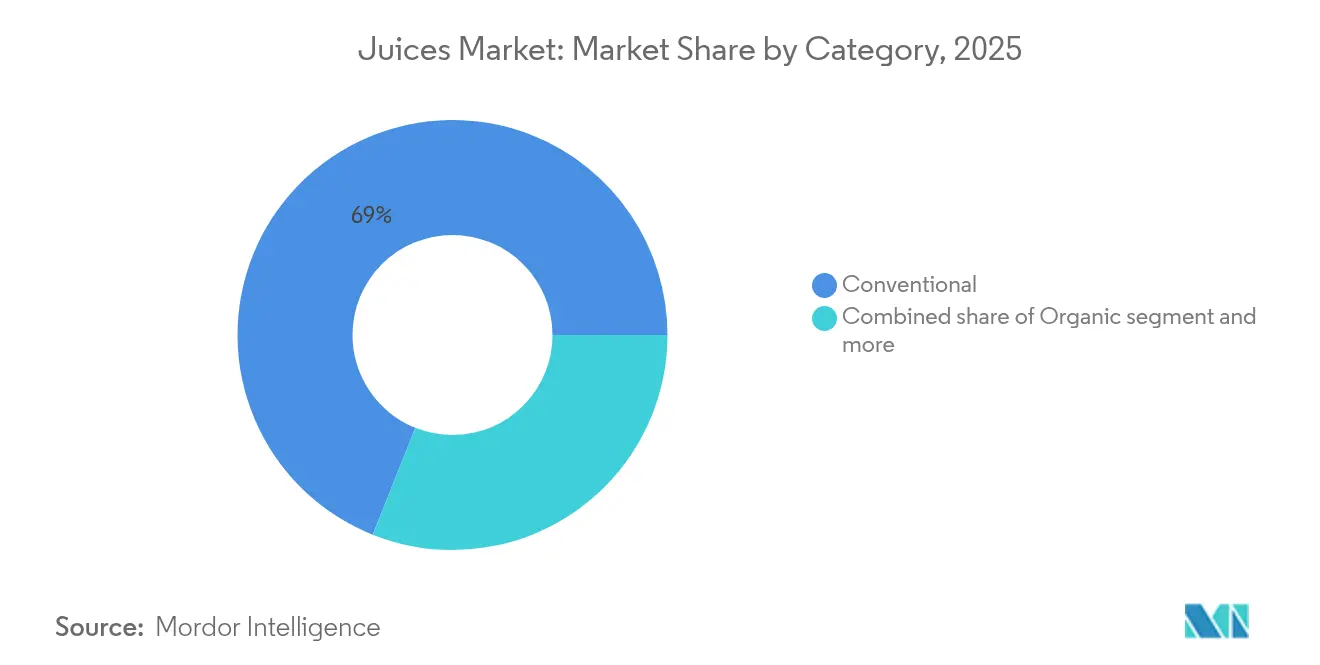
- By category, conventional variants retained 68.95% of the 2025 market share, yet organic juices are advancing at a 5.72% CAGR over the forecast period.
- By distribution channel, off-trade outlets accounted for 78.15% of 2025 sales, and on-trade venues are rebounding at a 4.29% CAGR through 2031.
- By geography, North America dominated with 27.94% of 2025 revenue, while Asia-Pacific is positioned for a 5.18% CAGR and will contribute the largest absolute growth by 2031.
Note: Market size and forecast figures in this report are generated using Mordor Intelligence’s proprietary estimation framework, updated with the latest available data and insights as of 2026.
Global Juices Market Trends and Insights
Drivers Impact Analysis*
| Driver | (~) % Impact on CAGR Forecast | Geographic Relevance | Impact Timeline |
|---|---|---|---|
| Product innovation and functional fortification | +0.8% | Global, with premium adoption in North America, Europe, and urban Asia-Pacific | Medium term (2-4 years) |
| Sugar-averse shift to 100% and NFC juices | +0.9% | North America, Europe, Australia; emerging in tier-1 Asian cities | Medium term (2-4 years) |
| Sustainable and recyclable beverage-carton adoption | +0.6% | Europe (regulatory push), North America, spillover to Asia-Pacific and Middle East and Africa | Long term (≥ 4 years) |
| Digital D2C subscription platforms for juice shots | +0.3% | North America, the United Kigdom, Australia; nascent in urban India and China | Short term (≤ 2 years) |
| Rapid cold-chain and HPP capacity build-out in Asia-Pacific | +0.7% | Asia-Pacific core (China, India, Indonesia, Thailand), spillover to the Middle East and Africa | Medium term (2-4 years) |
| Growth in portion control and single-serve packaging | +0.5% | Global, with strong uptake in convenience retail and on-the-go consumption | Short term (≤ 2 years) |
| Source: Mordor Intelligence | |||
Product innovation and functional fortification
Product innovation and functional fortification are significantly influencing the global juices market, transforming traditional fruit and vegetable juices into beverages designed to provide specific health benefits beyond hydration and taste. In response to growing consumer demand for wellness-oriented products, manufacturers are incorporating ingredients such as probiotics, adaptogens, turmeric, collagen peptides, vitamins, and antioxidants into juice formulations. These additions aim to address consumer needs related to digestive health, immunity, stress management, skin health, and overall well-being. Innovation in fortified juice products is reflected in the diverse range of functional ingredients being utilized and the strategic initiatives of major brands to differentiate through health-focused offerings. Functional juice blends featuring probiotics, adaptogens, turmeric, and collagen peptides are being positioned as lifestyle beverages that cater to specific health objectives and promote daily wellness. For instance, PepsiCo’s Tropicana Essentials Probiotics line, introduced in North America, combines Lactobacillus strains with 100% orange juice to appeal to gut-health-conscious millennials. This example highlights how leading companies are leveraging functional fortification to reshape consumer expectations within the juice category.
Sugar-averse shift to 100% and NFC juices
The global juices market is experiencing a notable shift due to increasing consumer aversion to sugar, which is influencing purchasing behavior and product expectations. As health awareness grows globally, consumers are paying closer attention to the sugar content in beverages, including juices that were traditionally considered healthy. This trend has led to a rising demand for 100% juices, produced solely from fruit or vegetable juice without added sugars, and NFC (Not From Concentrate) juices, which undergo minimal processing to retain natural flavor and perceived nutritional value. Health concerns and epidemiological trends are further driving this preference for low-sugar options. According to the International Diabetes Federation, Portugal recorded the highest adult diabetes prevalence in Europe at 14.3% in 2024, followed by Croatia at 13.7% [1]Source: International Diabetes Federation, "Diabetes Atlas," diabetesatlas.org. These figures underscore the public health challenges posed by metabolic diseases and are contributing to the growing demand for low-sugar beverage alternatives in the region. Similar patterns of health risk awareness are evident globally, encouraging consumers to choose juices that provide natural fruit nutrition without added sugars.
Sustainable and recyclable beverage-carton adoption
Increasing consumer and regulatory focus on environmental sustainability is driving the adoption of sustainable and recyclable beverage cartons in the global juices market. Traditional single-use packaging, such as plastic bottles and multi-layer laminates, is facing growing criticism from both consumers and policymakers due to its environmental impact, including waste generation and carbon emissions. Consumer sentiment data underscores the importance of this shift, as sustainability has become a critical factor influencing brand trust and purchasing decisions in the global juices market. According to the Round Up Organization (2025), 83% of respondents identified unsustainable packaging as a concern, while 82% expressed concerns about irresponsible sourcing of materials, reflecting widespread dissatisfaction with current packaging practices [2]Source: The Roundup Organization, "52 Huge Environmentally Conscious Consumer Statistics," theroundup.org. Additionally, 50% of global consumers reported that environmental factors, such as a brand’s efforts to reduce carbon emissions, use recycled materials, or minimize plastic waste, often or always affect their trust in a brand.
Rapid cold-chain and HPP capacity build-out in Asia-Pacific
The rapid development of cold-chain infrastructure and high-pressure processing (HPP) capacity in the Asia-Pacific region is emerging as a key growth driver for the global juices market. These advancements are facilitating wider distribution, enhancing product quality, and expanding shelf-stable product offerings. Previously, limited refrigeration logistics and processing capabilities in many emerging markets confined the availability of fresh, minimally processed juices to urban areas. Simultaneously, the adoption of HPP technology, which employs high pressure instead of heat to eliminate pathogens, enables the production of higher-quality juices that better preserve natural flavor, color, and nutrients compared to traditional thermal pasteurization. This aligns with the preferences of health- and quality-conscious consumers, who increasingly demand "fresh-taste" juice options with maintained nutritional value.
Restraints Impact Analysi*
| Restraint | (~) % Impact on CAGR Forecast | Geographic Relevance | Impact Timeline |
|---|---|---|---|
| Geopolitical tariff swings on juice concentrates | -0.4% | Global, with an acute impact on the United States-China trade and the European Union-Mercosur negotiations | Short term (≤ 2 years) |
| Loss of nutritional value due to processing for extended shelf life | -0.3% | Global, particularly affecting conventional pasteurized segments | Long term (≥ 4 years) |
| Sugar-tax expansion in more than 45 countries | -0.6% | Latin America, Europe, Middle East, South Africa; expanding to Southeast Asia | Medium term (2-4 years) |
| Climate-driven citrus and apple supply volatility | -0.7% | Global, with critical exposure in Florida, Brazil, Mediterranean Europe | Medium term (2-4 years) |
| Source: Mordor Intelligence | |||
Sugar-tax expansion in more than 45 countries
The implementation of sugar taxes in over 45 countries is increasingly restricting growth in the global juices market, particularly for products with higher levels of natural or added sugar. Although juices are often promoted as nutritious beverages, many contain inherent sugars that fall under these regulatory measures. This has resulted in price increases for sugar-rich juices, potentially reducing demand among price-sensitive consumers and limiting volume growth in impacted markets. Additionally, the expansion of sugar taxation requires manufacturers to reformulate products, invest in sugar-reduction technologies, or develop low- and no-sugar alternatives. These efforts add to production complexity and costs. In regions such as Europe and Latin America, where sugar taxes are becoming integral to public health strategies, juice brands face the dual challenge of preserving flavor and nutritional value while adhering to tax regulations.
Climate-driven citrus and apple supply volatility
Climate-related disruptions are increasingly impacting the global juices market by causing significant volatility in the supply of essential fruit inputs, particularly citrus and apples. Extreme weather events, such as droughts, frosts, and unseasonal storms, directly affect crop yields, resulting in supply shortages that increase raw material costs and complicate consistent production. This volatility disrupts planning, distribution, and pricing stability, posing challenges for both large multinational juice manufacturers and smaller regional producers. An illustrative example is the Florida citrus harvest for 2024-2025, which totaled 14.6 million boxes, a 28% decrease from the previous season's 20.3 million boxes as reported by United States Department of Agriculture. Total orange production dropped by 32% to 12.2 million boxes, with Non-Valencia oranges also declining 32% to 4.6 million boxes compared to 2023-2024, as per United States Department of Agriculture [3]Source: United States Department of Agriculture, "All Citrus Production Down 28 Percent," nass.usda.gov . These significant declines highlight how climate-driven yield fluctuations lead to raw material shortages, compelling manufacturers to source from higher-cost regions, reformulate products, or adjust retail prices.
*Our forecasts treat driver/restraint impacts as directional, not additive. The impact forecasts reflect baseline growth, mix effects, and variable interactions.
Segment Analysis
By Product Type: 100% Juice Outpaces Diluted Formats
Juice drinks (up to 24% juice) accounted for 47.62% of 2025 revenue, supported by affordability and widespread distribution. However, the segment's growth is slowing due to the impact of sugar taxes and increasing health awareness, which are diminishing its value proposition. The 100% juice segment is projected to grow at a CAGR of 3.94% through 2031, driven by premiumization and the rising demand for not-from-concentrate (NFC) products. Brands such as Coca-Cola's Simply and PepsiCo's Tropicana Pure Premium are gaining market share by eliminating flavor packs and emphasizing single-origin sourcing. Juice concentrates, which were previously dominant in foodservice and industrial applications, are facing challenges from tariff fluctuations and a shift toward ready-to-drink formats. Despite this, they maintain cost advantages in bulk catering and export markets where reconstitution infrastructure is available.
Regulatory frameworks are significantly influencing segment trends. The EU Fruit Juice Directive mandates clear labeling of juice content percentages and prohibits misleading "natural" claims on diluted drinks. Similar standards are being adopted by food regulatory agencies in Australia and Canada. The segment's development highlights a clear divergence: volume-driven juice drinks are defending market share through private-label collaborations, while 100% juice and nectars are focusing on higher margins by leveraging wellness narratives and ingredient transparency.


By Packaging Type: Aseptic Cartons Challenge PET Dominance
PET bottles accounted for 38.78% of the packaging market share in 2025, driven by consumer familiarity, resealability, and transparency, which conveys freshness. However, aseptic packaging is growing at a compound annual growth rate (CAGR) of 4.31% through 2031, supported by sustainability mandates and the cost advantages of ambient distribution. Tetra Pak's Tetra Evero Aseptic, incorporating a paper-based barrier and plant-derived polymers, achieved 12% adoption among European juice brands in 2025. This packaging reduced carbon footprints by 30% compared to virgin PET and aligned with EU Extended Producer Responsibility targets.
The packaging market is increasingly segmented by use cases. PET bottles dominate take-home and refrigerated retail due to their clarity and resealability. Aseptic cartons are preferred for ambient distribution and rural markets where cold chain infrastructure is limited. Glass packaging is positioned in premium organic and artisanal segments, while cans are favored for impulse purchases and on-the-go consumption. Technological advancements are driving hybrid solutions, such as PET bottles with 50% recycled content and cartons with bio-based caps, which aim to balance sustainability, functionality, and cost. These developments often benefit larger players with the resources to navigate complex certification processes and invest in research and development.
By Category: Organic Premiumization Accelerates
Conventional formats are expected to account for 68.95% of the 2025 volume, driven by price differences of 40-70% and the limited availability of organic orchard acreage. However, organic juices are projected to grow at a CAGR of 5.72% through 2031, representing the fastest growth among all segments. The growth in organic juices is primarily concentrated in North America and Europe, where USDA Organic and EU Organic certifications enable access to shelf space in retailers such as Whole Foods, Waitrose, and Alnatura, which emphasize regenerative agriculture practices.
Conventional juices are maintaining their market share through economies of scale and private-label collaborations. Brands like Walmart's Great Value and Costco's Kirkland Signature source concentrates from Brazil and China at costs 50-60% lower than branded organic products. This market division highlights two distinct segments: a high-margin, low-volume organic category catering to affluent, health-conscious consumers, and a high-volume, low-margin conventional category aimed at price-sensitive households and bulk foodservice buyers.
By Distribution Channel: Off-Trade Dominance with On-Trade Recovery
Off-Trade channels accounted for 78.15% of the distribution in 2025, driven by supermarkets and hypermarkets that provide a wide product range, promotional pricing, and private-label options. However, on-trade venues are experiencing a resurgence, with a projected CAGR of 4.29% through 2031, as hotels, restaurants, and cafés introduce innovations such as craft juice pairings and wellness-focused menus. Within the Off-Trade segment, supermarkets and hypermarkets hold the largest share, utilizing strategies like end-cap displays and loyalty programs to encourage impulse purchases.
Online Retail is the fastest-growing sub-segment within Off-Trade, with platforms like Amazon Fresh and Instacart capturing 8% of U.S. juice sales in 2025. This growth is supported by subscription models and same-day delivery services that cater to busy urban consumers. The distribution channel split highlights distinct consumption patterns: Off-Trade dominates breakfast and at-home hydration occasions, while On-Trade is preferred for experiential and social drinking moments, where consumers are willing to pay a premium for freshness, presentation, and customization. E-commerce is influencing both channels, with direct-to-consumer brands such as Daily Harvest and Kencko bypassing traditional retail intermediaries. These brands achieve 12-15% higher margins by leveraging subscription models and data-driven personalization.
Geography Analysis
North America accounted for 27.94% of the 2025 turnover, driven by established breakfast habits and widespread access to refrigerated products. However, market maturity and increasing consumer awareness of sugar content have slowed overall growth. Traditional leaders such as Tropicana and Simply Orange have lost market share to emerging cold-pressed brands like Suja and Evolution Fresh. In Canada, the demand for organic products is growing rapidly, supported by consumer preferences for healthier options and stricter labeling regulations. Meanwhile, Mexico's sugar tax continues to influence product reformulations, favoring alternatives like stevia and agave nectar, as manufacturers adapt to shifting consumer preferences and regulatory pressures.
The Asia-Pacific region is experiencing the fastest growth, with a 5.18% compound annual growth rate (CAGR), supported by rising urban incomes and investments in high-pressure processing (HPP) and cold-chain infrastructure. Nongfu Spring's entry into the not-from-concentrate (NFC) segment has positioned juice as a lifestyle product in China, appealing to health-conscious urban consumers. In India, the popularity of mango juice is fueled by regional varietal preferences, with brands leveraging local sourcing to enhance authenticity and appeal. Japan's functional beverage market has expanded to include electrolyte-rich hybrids, catering to an aging population and a growing focus on wellness. However, regulatory fragmentation poses challenges, complicating the standardization of stock-keeping units (SKUs) across borders within the global juice market, which limits the scalability of certain product lines.
Europe represents a mature but evolving market influenced by sustainability regulations and reduced-sugar initiatives. Southern Europe capitalizes on its abundant stone-fruit crops for nectars, though irrigation challenges linked to climate change present risks to long-term production. Producers are increasingly adopting water-efficient practices and exploring alternative crop varieties to mitigate these challenges. In South America, Brazil remains a focal point as the leading exporter of orange juice, benefiting from its extensive citrus plantations and established export networks. However, domestic consumption is limited by affordability issues, with lower-income households opting for cheaper alternatives. Meanwhile, Argentina's high inflation rates have significantly reduced 2025 volumes, underscoring the region's vulnerability to macroeconomic risks and the need for producers to adopt cost-effective strategies to maintain competitiveness.

Competitive Landscape
The Global Juices Market demonstrates moderate concentration, with multinational companies such as The Coca-Cola Company, PepsiCo, and Suntory Holdings holding a significant combined market share. This dominance is attributed to their extensive product portfolios, global distribution networks, and long-established brand equity. Market trends indicate a shift from volume-focused competition to higher-margin segments, including functional beverages, direct-to-consumer subscription models, and sustainable packaging solutions. These solutions align with ESG-linked financing and retailer preferences, further strengthening the position of established players.
Opportunities are emerging in hybrid juice formats, such as 100% juice blended with collagen, electrolytes, or adaptogens. Additionally, underserved regions like Sub-Saharan Africa and Southeast Asia present growth potential due to changing market dynamics. Historically, weak cold chain infrastructure in these areas has limited the availability of fresh and minimally processed juice formats. However, investments in high-pressure processing (HPP) and aseptic packaging are addressing these challenges, enabling better product availability and quality.
Patent activity highlights innovation in areas such as enzymatic browning inhibition, extended shelf-life without preservatives, and bio-based barrier coatings for aseptic cartons. These advancements are critical for maintaining product quality and meeting consumer demand for natural and sustainable options. Companies like Tetra Pak and SIG Combibloc hold dominant intellectual property positions in these domains. This creates significant entry barriers for smaller packaging startups, limiting their ability to compete effectively in the market.
Juices Industry Leaders
-
The Coca-Cola Company
-
Tropicana Brands Group
-
PepsiCo Inc.
-
Keurig Dr Pepper Inc.
-
Suntory Holdings Ltd.
- *Disclaimer: Major Players sorted in no particular order

Recent Industry Developments
- December 2025: Waitrose partnered with the British cold-pressed juice brand Daily Dose to introduce a limited-edition apple juice made from surplus fruit from its Leckford Estate farm in Hampshire. This initiative transformed excess apples from a bumper 2025 harvest into a sustainable beverage offering. The 900 ml bottles, containing approximately 50% Leckford apples, were made available in Waitrose stores across the UK for around EUR 3.50 starting December 17. The effort aimed to reduce food waste and promote local agriculture.
- December 2025: Spanish beverage producer García Carrión introduced a sustainable aseptic carton for its Don Simón juice range. This innovation, developed in collaboration with Tetra Pak, replaced the traditional aluminum foil barrier with a paper-based barrier. The new carton, the first of its kind globally for juice portion packs, utilized renewable materials to increase the renewable content to approximately 92% and reduced the carbon footprint by about 43% compared to conventional aseptic cartons with aluminum foil. Despite the changes, the packaging continued to protect products from oxygen, light, moisture, and bacteria, ensuring shelf life was maintained.
- March 2025: Reliance Consumer Products (RCPL), the FMCG division of Reliance Industries, launched the Sun Crush juice brand in India after acquiring the India rights from Sri Lankan company Ceylon Beverage International, owned by former cricketer Muttiah Muralitharan. Local production of Sun Crush began, with 200 ml bottles priced competitively at around INR 20. The product was positioned to compete with established brands such as Dabur’s Real, ITC’s B Natural, Amul Tru, PepsiCo’s Tropicana, and Paperboat in India’s rapidly growing packaged beverages market.
- January 2025: Odwalla re-entered the U.S. market with the launch of a new line of juices and smoothies, marking the return of the iconic brand to retail shelves. Supported by Full Sail IP Partners and produced in collaboration with Grupo Jumex, the relaunched portfolio targeted health-conscious consumers with simple, transparent formulations free from added sugar and high-fructose corn syrup.


Global Juices Market Report Scope
100% Juice, Juice Drinks (up to 24% Juice), Juice concentrates, Nectars (25-99% Juice) are covered as segments by Soft Drink Type. Aseptic packages, Disposable Cups, Glass Bottles, Metal Can, PET Bottles are covered as segments by Packaging Type. Off-trade, On-trade are covered as segments by Distribution Channel. Africa, Asia-Pacific, Europe, Middle East, North America, South America are covered as segments by Region.| 100% Juice |
| Juice Drinks (up to 24% Juice) |
| Juice Concentrates |
| Nectars |
| Aseptic packages |
| Glass Bottles |
| Metal Can |
| PET Bottles |
| Disposable Cups and Pouches |
| Conventional |
| Organic |
| Off-Trade | Supermarkets/Hypermarkets |
| Convenience Stores | |
| Online Retail | |
| Other Distribution Channels | |
| On-Trade |
| North America | United States |
| Canada | |
| Mexico | |
| Rest of North America | |
| Europe | Germany |
| United Kingdom | |
| Italy | |
| France | |
| Spain | |
| Netherlands | |
| Poland | |
| Belgium | |
| Sweden | |
| Rest of Europe | |
| Asia-Pacific | China |
| India | |
| Japan | |
| Australia | |
| Indonesia | |
| South Korea | |
| Thailand | |
| Singapore | |
| Rest of Asia-Pacific | |
| South America | Brazil |
| Argentina | |
| Colombia | |
| Chile | |
| Peru | |
| Rest of South America | |
| Middle East and Africa | South Africa |
| Saudi Arabia | |
| United Arab Emirates | |
| Nigeria | |
| Egypt | |
| Morocco | |
| Turkey | |
| Rest of Middle East and Africa |
| By Product Type | 100% Juice | |
| Juice Drinks (up to 24% Juice) | ||
| Juice Concentrates | ||
| Nectars | ||
| By Packaging Type | Aseptic packages | |
| Glass Bottles | ||
| Metal Can | ||
| PET Bottles | ||
| Disposable Cups and Pouches | ||
| By Category | Conventional | |
| Organic | ||
| By Distribution Channel | Off-Trade | Supermarkets/Hypermarkets |
| Convenience Stores | ||
| Online Retail | ||
| Other Distribution Channels | ||
| On-Trade | ||
| By Geography | North America | United States |
| Canada | ||
| Mexico | ||
| Rest of North America | ||
| Europe | Germany | |
| United Kingdom | ||
| Italy | ||
| France | ||
| Spain | ||
| Netherlands | ||
| Poland | ||
| Belgium | ||
| Sweden | ||
| Rest of Europe | ||
| Asia-Pacific | China | |
| India | ||
| Japan | ||
| Australia | ||
| Indonesia | ||
| South Korea | ||
| Thailand | ||
| Singapore | ||
| Rest of Asia-Pacific | ||
| South America | Brazil | |
| Argentina | ||
| Colombia | ||
| Chile | ||
| Peru | ||
| Rest of South America | ||
| Middle East and Africa | South Africa | |
| Saudi Arabia | ||
| United Arab Emirates | ||
| Nigeria | ||
| Egypt | ||
| Morocco | ||
| Turkey | ||
| Rest of Middle East and Africa | ||


Market Definition
- Carbonated Soft Drinks (CSDs) - Carbonated soft drinks (CSDs) refer to non-alcoholic beverages that are carbonated and typically flavored, containing dissolved carbon dioxide to create effervescence. These beverages commonly include cola, lemon-lime, orange, and various fruit-flavored sodas. Marketed in cans, bottles, or fountain dispense.
- Juices - We have considered packaged juices which encompass non-alcoholic beverages derived from fruits, vegetables, or a combination thereof, processed and sealed in various packaging formats such as bottles, cartons, or pouches. Excluding fresh juices, this market segment involves commercially prepared and preserved juices, often with added preservatives and flavors.
- Ready-to-Drink (RTD) Tea and RTD Coffee - Ready-to-Drink (RTD) tea and RTD coffee are pre-packaged, non-alcoholic beverages that are brewed and prepared for consumption without further dilution. RTD tea typically includes various tea varieties, infused with flavors and sweeteners, and comes in bottles, cans, or cartons. Similarly, RTD coffee involves pre-brewed coffee formulations, often mixed with milk, sugar, or flavorings, and is conveniently packaged for on-the-go consumption.
- Energy Drinks - Energy drinks are non-alcoholic beverages formulated to provide a quick boost of energy and alertness. Whereas, sports drinks are beverages designed to hydrate and replenish electrolytes, particularly after physical exertion, exercise, or intense activity
| Keyword | Definition |
|---|---|
| Carbonated Soft Drinks | Carbonated soft drinks (CSDs) are a combination of carbonated water and flavouring, sweetened by sugar or a non-sugar sweeteners. |
| Standard Cola | Standard Cola is defined as the original flavor of cola soda. |
| Diet Cola | A cola-based soft drink containing no or low amounts of sugar |
| Fruit Flavored Carbonates | A carbonated beverage prepared from fruit juice/fruit flavor with carbonated water and containing sugar, dextrose, invert sugar or liquid glucose either singly or in combination. It may contain peel oil and fruit essences. |
| Juice | Juice is a drink made from the extraction or pressing of the natural liquid contained in fruit and vegetables. |
| 100% Juice | Fruit/vegetable juice made from fruit in the form of its juice with no water added to make up the volume. It is not permitted to add sugars, sweeteners, preservatives, flavourings or colourings to fruit juice. |
| Juice Drinks (up to 24% Juice) | Fruit/vegetable juice drinks with up to 24% fruits/vegetable extract. |
| Nectars (25-99% Juice) | Juices that can have between 25 and 99% of fruit, with the minimum legal limits defined depending on the type of fruit |
| Juice concentrates | Juice Concentrates are those form of juices when most of this liquid is removed resulting in a thick, syrupy product known as juice concentrate. |
| RTD Coffee | Packaged coffee beverages that are sold in a prepared form and are ready for consumption at the time of purchase. |
| Iced Coffee | An iced coffee is a cold version of coffee, usually a combination of hot espresso and milk with ice added to it. |
| Cold Brew Coffee | Cold brew also called cold water extraction or cold pressing is made by steeping ground coffee in room-temperature water for several hours. |
| RTD Tea | Ready-to-drink (RTD) tea is a packaged tea product ready for immediate consumption without brewing or preparation |
| Iced Tea | Ice tea or iced tea is a drink made from tea without milk but with sugar and sometimes fruit flavourings, drunk cold. |
| Green Tea | Green tea is a tea beverage which promotes mental alertness, relieving digestive symptoms and promoting weight loss. |
| Herbal Tea | Herbal tea beverages are made from the infusion or decoction of herbs, spices, or other plant material in hot water. |
| Energy Drink | A type of drink containing stimulant compounds, usually caffeine, which is marketed as providing mental and physical stimulation. They may or may not be carbonated and may also contain sugar, other sweeteners, or herbal extracts, among numerous possible ingredients. |
| Sugar-free or Low-calories Energy Drinks | Sugar-free or Low-calories Energy Drinks are sugar-free, artificially sweetened energy drinks with few or no calories. |
| Traditional Energy Drink | Traditional Energy Drinks are functional soft drinks containing ingredients designed to boost the consumer's energy. |
| Natural/Oraganic Energy Drinks | Natural/Organic energy drinks are energy drinks free of artificial sweeteners and synthetic colorings. Instead, they contain naturally derived ingredients such as green tea, yerba mate, and botanical extracts. |
| Energy Shots | A small but highly concentrated energy drink that contains large amounts of caffeine and/or other stimulants. The quantity is comparatively smaller compared to energy drinks. |
| Sports Drink | Sports drinks are beverages designed specifically for the rapid supply of fluid, carbohydrates, and electrolytes before, during or after exercise. |
| Isotonic | Isotonic drinks contain similar concentrations of salt and sugar as in the human body, and are designed to quickly replace fluids lost during exercise but with an increase of carbohydrate. |
| Hypertonic | Hypertonic drinks have a higher concentration of salt and sugar than the human body. They are best drunk after exercise as it is important to replace glycogen levels quickly after exercise. |
| Hypotonic | Hypotonic drinks are designed to quickly replace fluids lost during exercise. They have very low carbohydrate content and a lower concentration of salt and sugar than the human body. |
| Electrolyte-Enhanced Water | Electrolyte water is water infused with electrically-charged minerals, such as sodium, potassium, calcium, and magnesium. |
| Protein-based Sport Drinks | Protein-based sports drinks are those sports drinks which has added protein in it that will improve performance and reduce muscle protein breakdown. |
| On-Trade | The on-trade refers to places that sell beverages for immediate consumption on the premises like bars, restaurants, and pubs |
| Off-Trade | Off-trade usually means places like liquor stores, supermarkets and other places where you don't consume the beverage right away. |
| Convenience Store | A retail business that provides the public with a convenient location to quickly purchase a wide variety of consumable products and services, generally food and gasoline. |
| Specialty store | A specialty store is a shop/store that carries a deep assortment of brands, styles, or models within a relatively narrow category of goods |
| Online Retail | Online retail is a type of eCommerce whereby a business sells goods or services directly to consumers from a website. |
| Aseptic Packaging | Aseptic packaging refers to the filling of a cold, commercially sterile product under sterile conditions into a presterilized container and closure under sterile conditions to form a seal that effectively excludes microorganisms. These includes tetra packs, cartons, pouches etc. |
| PET Bottle | PET bottle means a bottle made of polyethylene terephthalate. |
| Metal Cans | Metal containers made of aluminum or tin- plated or zinc-plated steel, which are commonly used for packaging food, beverages or other products. |
| Disposable Cups | Disposable Cup means a cup or other container designed for single use to serve beverages, such as water, cold drinks, hot drinks and alcoholic beverages. |
| Gen Z | A way of referring to the group of people who were born in the late 1990s and early 2000s. |
| Millenial | Anyone born between 1981 and 1996 (ages 23 to 38 in 2019) is considered a Millennial |
| Taurine | Taurine is an amino acid that supports immune health and nervous system function. |
| Bars & Pubs | It is a drinking establishment licensed to serve alcoholic drinks for consumption on the premises. |
| Café | It is a foodservice establishment serving refreshments (mainly coffee) and light meals. |
| On the go | It means doing / dealing with while busily engaged with something and not diverting plans in order to accommodate. |
| Internet Penetration | The Internet Penetration Rate corresponds to the percentage of the total population of a given country or region that uses the Internet. |
| Vending Machine | A machine that dispenses small articles such as food, drinks, or cigarettes when a coin or token is inserted |
| Discount store | A discount store or discounter offers a retail format in which products are sold at prices that are in principle lower than an actual or supposed "full retail price". Discounters rely on bulk purchasing and efficient distribution to keep down costs. |
| Clean Label | Clean label on the beverage market are drinks that are made from few ingredients of natural origin and are not or only slightly processed. |
| Caffeine | An alkaloid compound which is a stimulant of the central nervous system. It is mainly used recreationally, as a mild cognitive enhancer to increase alertness and attentional performance. |
| Extreme sport | Action sports, adventure sports or extreme sports are activities perceived as involving a high degree of risk. |
| High-intensity interval training | It incorporates several rounds that alternate between several minutes of high intensity movements to significantly increase the heart rate to at least 80% of one's maximum heart rate, followed by short periods of lower intensity movements. |
| Shelf life | The length of time for which an item remains usable, fit for consumption, or saleable. |
| Cream Soda | Cream soda is a sweet soft drink. Generally flavored with vanilla and based on the taste of an ice cream float |
| Root Beer | Root beer is a sweet North American soft drink traditionally made using the root bark of the sassafras tree Sassafras albidum or the vine of Smilax ornata as the primary flavor. Root beer is typically, but not exclusively, non-alcoholic, caffeine-free, sweet, and carbonated. |
| Vanilla Soda | A carbonated soft drink flavoured with vanilla. |
| Dairy-Free | A product that does not contain any milk or milk products from cows, sheep or goats. |
| Caffeine-Free Energy Drinks | Caffeine-free energy drinks rely on other ingredients to boost the energy. Popular choices include amino acids, B vitamins, and electrolytes. |


Research Methodology
Mordor Intelligence follows a four-step methodology in all our reports.
- Step-1: IDENTIFY KEY VARIABLES: In order to build a robust forecasting methodology, the variables and factors identified in Step 1 are tested against available historical market numbers. Through an iterative process, the variables required for market forecast are set, and the model is built on the basis of these variables.
- Step-2: Build a Market Model: Market-size estimations for the forecast years are in nominal terms. Inflation is not a part of the pricing, and the average selling price (ASP) is kept constant throughout the forecast period for each country.
- Step-3: Validate and Finalize: In this important step, all market numbers, variables, and analyst calls are validated through an extensive network of primary research experts from the market studied. The respondents are selected across levels and functions to generate a holistic picture of the market studied.
- Step-4: Research Outputs: Syndicated reports, custom consulting assignments, databases & subscription platforms


