Asia-Pacific Juices Market Size and Share
Market Overview
| Study Period | 2021 - 2031 |
|---|---|
| Forecast Data Period | 2026 - 2031 |
| Historical Data Period | 2021 - 2024 |
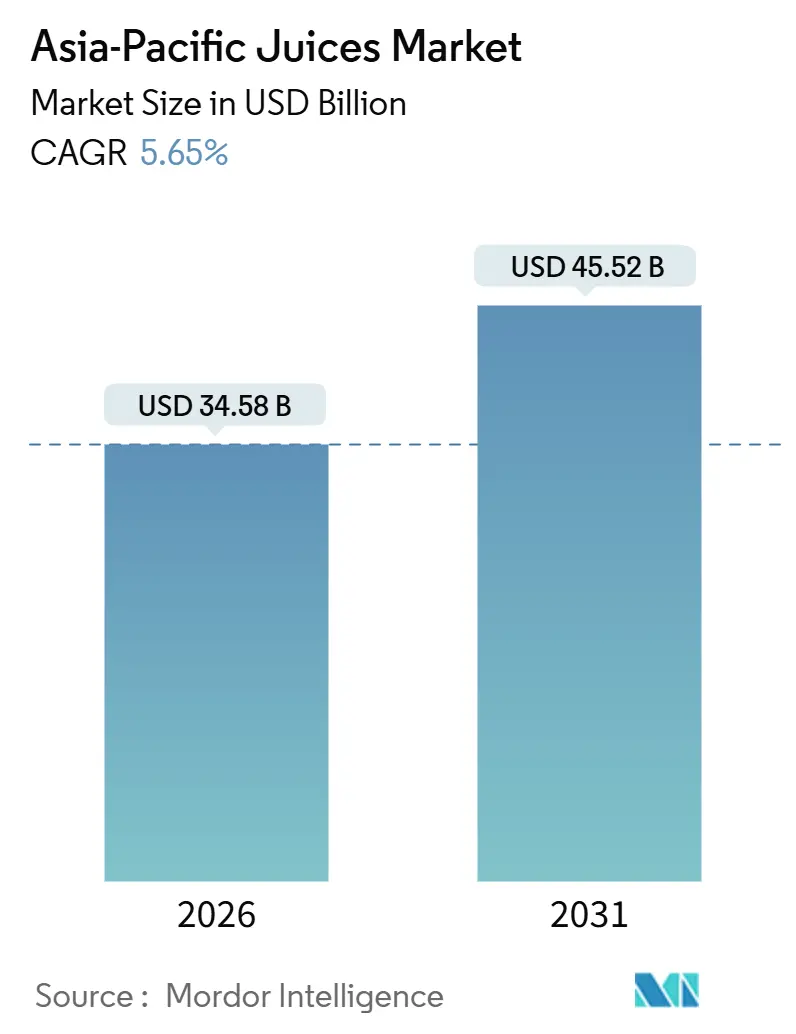
| Market Size (2026) | USD 34.58 Billion |
| Market Size (2031) | USD 45.52 Billion |
| Growth Rate (2026 - 2031) | 5.65% CAGR |
| Market Concentration | Medium |
Major Players *Disclaimer: Major Players sorted in no particular order Image © Mordor Intelligence. Reuse requires attribution under CC BY 4.0. | |
Asia-Pacific Juices Market Analysis by Mordor Intelligence
The Asia-Pacific juice market size is valued at USD 34.58 billion in 2026 and is projected to reach USD 45.52 billion by 2031, advancing at a 5.65% CAGR. Rising middle-class incomes, accelerated health awareness, and tighter regional sugar-labeling rules are steering shoppers toward 100% juice, while functional blends with vitamins and botanicals command price premiums. Investment in cold-chain and aseptic filling shortens time to market, widening rural reach and supporting ready-to-drink formats. China's urban corridors anchor revenue, yet Malaysia’s halal-certified launches and e-commerce adoption yield the fastest gains. Urbanization compresses meal-preparation windows and strengthens impulse purchases through convenience stores, as technological advances in packaging cut spoilage and improve sustainability. Competitive pressure remains moderate but mounting, because local specialists leverage localized flavors that global majors find hard to replicate at scale.
Key Report Takeaways
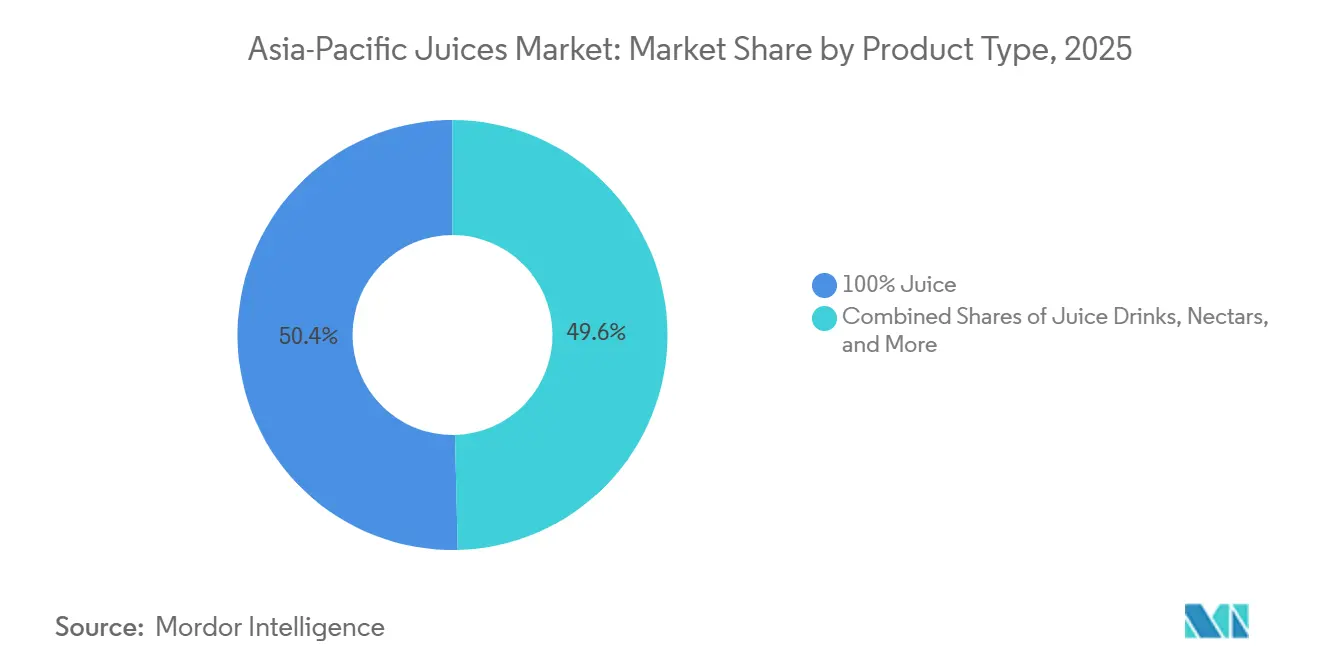
- By product type, 100% juice held 50.38% of the Asia-Pacific fruit juice market share in 2025, while juice drinks are forecast to post a 6.58% CAGR through 2031.
- By packaging type, PET bottles led with 48.28% revenue share in 2025; aseptic cartons are set to expand at a 7.12% CAGR to 2031.
- By category, conventional products accounted for 68.58% of the Asia-Pacific fruit juice market size in 2025, and organic drinks are projected to grow at a 6.24% CAGR.
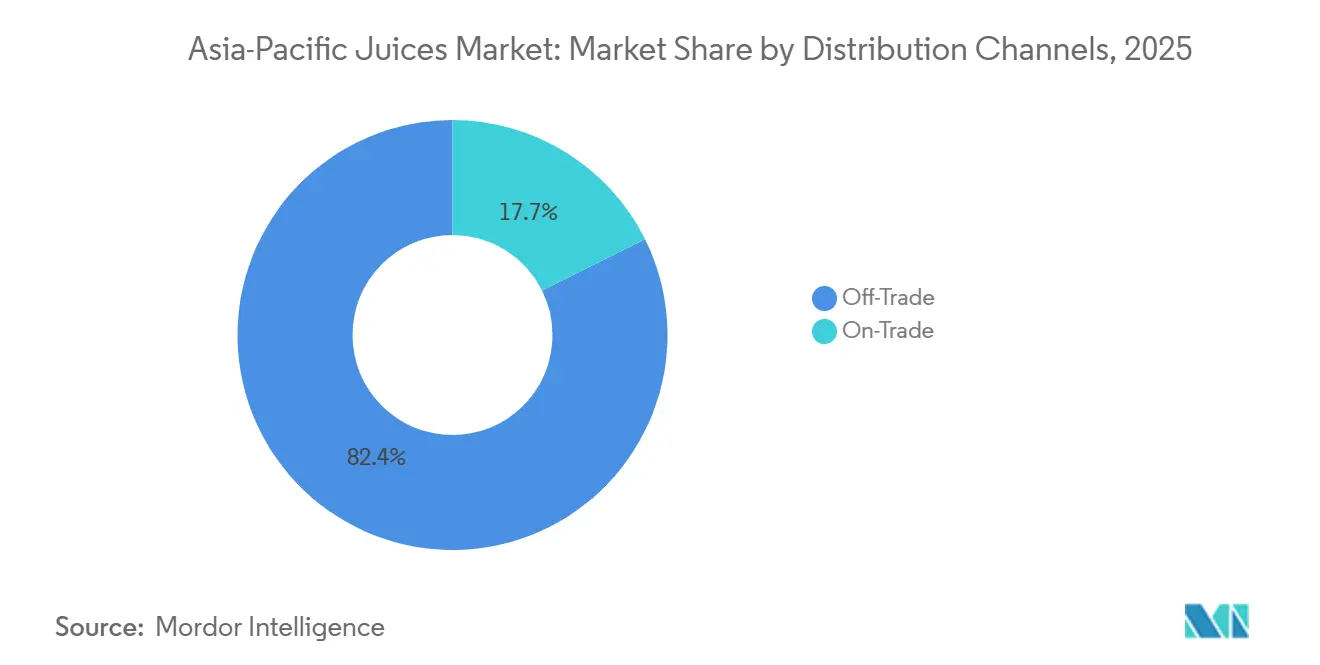
- By distribution channel, off-trade captured 82.35% revenue in 2025; on-trade is the fastest channel with a 7.52% CAGR through 2031.
- By geography, China commanded 40.58% of 2025 sales, whereas Malaysia is advancing at a 7.32% CAGR to 2031.
Note: Market size and forecast figures in this report are generated using Mordor Intelligence’s proprietary estimation framework, updated with the latest available data and insights as of January 2026.
Asia-Pacific Juices Market Trends and Insights
Drivers Impact Analysis*
| Drivers | (~) % Impact on CAGR Forecasts | Geographic Relevance | Impact Timeline |
|---|---|---|---|
| Rising Health Consciousness Boosts Demand for 100% Juices | 1.2% | China, Japan, Australia, India with early adoption in urban centers | Medium term (2-4 years) |
| Product Innovation, Including Functional Juices with Vitamins, Antioxidants, and New Flavors | 0.9% | APAC core markets (China, Japan, South Korea), spillover to Southeast Asia | Short term (≤ 2 years) |
| Technological Advancements in Processing and Packaging | 0.8% | China, India, Thailand with manufacturing hubs driving adoption | Medium term (2-4 years) |
| Urbanization and Busy Lifestyles Drive Preference for Ready-to-Drink, Portable Juices | 0.7% | Urban corridors across China, India, Indonesia, Vietnam | Long term (≥ 4 years) |
| Increasing Disposable Incomes Enable Spending on Premium and Convenient Beverages | 0.6% | Emerging middle class in India, Indonesia, Philippines, Vietnam | Long term (≥ 4 years) |
| Popularity of Organic and Sustainably Sourced Juices | 0.5% | Japan, Australia, urban China with premium positioning | Medium term (2-4 years) |
| Source: Mordor Intelligence | |||


Rising Health Consciousness Boosts Demand for 100% Juices
Consumers across Asia-Pacific increasingly view 100% juice as a functional alternative to carbonated soft drinks, driven by government nutrition campaigns and social-media wellness influencers. Japan's Ministry of Health, Labour and Welfare updated dietary guidelines in 2024 to recommend fruit-based beverages with no added sugars, catalyzing a 12% volume uptick in not-from-concentrate orange and apple juices[1]Source: Ministry of Health, Labour and Welfare Japan, “Dietary Guidelines Update 2024,” mhlw.go.jp. China's urban millennials, particularly in tier-1 cities like Shanghai and Beijing, prioritize "clean label" products, with Nongfu Spring reporting that its 100% pressed juice line grew 18% year-on-year in 2025. This premiumization creates a two-tier market: affluent households pay 40-60% more for cold-pressed variants, while price-sensitive rural buyers still favor juice drinks with 10-24% fruit content. The shift also pressures supply chains, as processors secure direct contracts with orchards to guarantee pesticide-free sourcing and traceability, raising input costs by an estimated 8-10%.
Product Innovation Including Functional Juices with Vitamins, Antioxidants, and New Flavors
Brands layer bioactive compounds, collagen peptides, probiotics, and plant sterols into juice matrices to justify premium pricing and differentiate from commodity SKUs. Suntory's "Wellness Shot" range in Japan, launched in early 2025, combines yuzu juice with hyaluronic acid and vitamin C, targeting female consumers aged 25-45 willing to pay JPY 300 (USD 2.10) per 100 ml bottle. PepsiCo's Tropicana Essentials line in India added turmeric and ashwagandha extracts in late 2024, tapping Ayurvedic wellness trends that resonate with health-conscious urban professionals. Flavor innovation extends beyond fortification: lychee-rose, dragon fruit-passionfruit, and calamansi-ginger blends cater to regional palates that global portfolios historically overlooked. However, regulatory complexity escalates when health claims cross borders; what qualifies as a "functional food" in Thailand may require pharmaceutical-grade testing in Australia, forcing companies to maintain region-specific formulations that dilute economies of scale.
Technological Advancements in Processing and Packaging
Aseptic filling technology enables ambient-stable juice cartons that eliminate dependence on the cold chain, unlocking distribution to rural Asia-Pacific, where refrigeration infrastructure remains patchy. Tetra Pak commissioned a USD 50 million aseptic line in Vietnam in 2024, targeting Southeast Asian brands seeking shelf-life extension from 7 days (chilled PET) to 12 months (aseptic carton). High-pressure processing (HPP), which inactivates microbes without heat, preserves volatile flavor compounds and vitamin C content, commanding 25-35% price premiums in Japan and South Korea. Dai Nippon Printing introduced a recyclable mono-material aseptic pouch in 2025, addressing sustainability mandates in Australia and New Zealand, where extended producer responsibility (EPR) schemes penalize multi-layer packaging. These innovations compress time-to-market: brands can reformulate and relaunch within 6-8 months, compared with 12-18 months for traditional hot-fill lines, accelerating their response to consumer trends.
Urbanization and Busy Lifestyles Drive Preference for Ready-to-Drink Portable Juices
Asia-Pacific's urban population will exceed 2.5 billion by 2030, per UN DESA projections, shrinking meal-preparation time and elevating demand for grab-and-go nutrition[2]Source: United Nations Department of Economic and Social Affairs, “World Urbanization Prospects 2024,” un.org. Single-serve PET bottles (250-350 ml) and aseptic cartons with twist caps proliferate in convenience stores and vending machines across Tokyo, Seoul, and Singapore, where commuters prioritize portability over bulk packaging. Coca-Cola's Minute Maid Pulpy launched 200 ml "commuter packs" in China and Indonesia in 2025, priced at CNY 5-6 (USD 0.70-0.85) to compete with bottled water on affordability. The trend also reshapes retail footprints: modern trade (supermarkets, hypermarkets) still dominates with 55-60% share, but convenience chains like 7-Eleven and FamilyMart grew juice sales 14% in 2025, driven by chilled-section expansion and promotional tie-ins with mobile-payment platforms. This channel shift favors brands with strong route-to-market capabilities and the financial muscle to fund slotting fees and promotional discounts.
Restraints Impact Analysis*
| Restraints | (~) % Impact on CAGR Forecasts | Geographic Relevance | Impact Timeline |
|---|---|---|---|
| Fluctuating Raw Material Prices, Especially Fruits | -0.8% | Tropical fruit exporters (Thailand, Philippines), citrus regions (China, India) | Short term (≤ 2 years) |
| Health Concerns and Regulations on Added Sugars and Labeling | -0.6% | Singapore, Thailand, India with front-of-pack labeling mandates | Medium term (2-4 years) |
| Stringent Food Safety and Quality Regulations | -0.4% | China (SAMR), India (FSSAI), Japan (MHLW) with import/export controls | Long term (≥ 4 years) |
| Competition from Substitutes Like Carbonated Drinks, Teas, and Water | -0.3% | Urban markets across APAC with diversified beverage portfolios | Medium term (2-4 years) |
| Source: Mordor Intelligence | |||
Fluctuating Raw Material Prices, Especially Fruits
Citrus and tropical-fruit prices surged 15-22% in 2024-2025 due to El Niño-induced droughts in Thailand, the Philippines, and southern China, compressing gross margins for juice manufacturers unable to hedge or pass costs downstream. Orange concentrate from Brazil, a key input for Asia-Pacific bottlers, traded at USD 3,200-3,500 per metric ton in late 2025, up from USD 2,400-2,600 in 2023, per Bloomberg commodity data. Mango pulp from India faced similar volatility: unseasonal rains in Uttar Pradesh and Maharashtra reduced 2025 yields by 18%, forcing processors to source from costlier imports or reformulate blends with apple and pear concentrates. Smaller regional players lack the balance-sheet strength to lock in forward contracts, leaving them exposed to spot-market swings that can erase 3-5 percentage points of EBITDA margin within a single quarter. Climate adaptation, drought-resistant rootstocks, and precision irrigation require multi-year investment horizons that conflict with short-term profitability pressures.
Health Concerns and Regulations on Added Sugars and Labeling
Singapore's Nutri-Grade labeling, implemented in December 2023, mandates color-coded front-of-pack labels (A to D) based on sugar and saturated-fat content, with Grade C and D beverages banned from advertising. Thailand's sugar tax, escalating from THB 1 per liter in 2024 to THB 5 per liter by 2027 for drinks exceeding 10 grams of sugar per 100 ml, incentivizes reformulation toward natural sweeteners like stevia and monk fruit, which cost 2-3 times more than sucrose. India's Food Safety and Standards Authority (FSSAI) proposed front-of-pack warning labels in 2025 for beverages with added sugars above 5 grams per serving, triggering industry pushback over compliance timelines and label real estate[3]Source: Ministry of Public Health Thailand, “Sugar Tax Schedule 2024-2027,” fda.moph.go.th. These regulations fragment product portfolios: brands maintain low-sugar SKUs for regulated markets and standard formulations for less restrictive geographies, inflating SKU complexity and production changeover costs. Consumer backlash also emerges when reformulated products taste noticeably different, risking brand equity erosion.
*Our forecasts treat driver/restraint impacts as directional, not additive. The impact forecasts reflect baseline growth, mix effects, and variable interactions.
Segment Analysis
By Product Type: Functional Blends Outpace Pure Juice
100% juice secured half of all 2025 revenue, anchored by breakfast-occasion orange and apple variants. Juice drinks with 10-24% fruit, however, are forecast to climb 6.58% annually as functional add-ins bolster value perception. These blends help defend the Asia-Pacific fruit juice market size against sugar-reduction headwinds that affect pure juice, while nectars and concentrates meet affordability and food-service needs. Regulatory thresholds differ; Australia requires at least 25% fruit to call a beverage “juice,” whereas China accepts 10%, forcing region-specific labels.
Functional blends underpin margin expansion by commanding 40-60% premiums, as shown by Suntory’s yuzu-collagen drink and PepsiCo’s turmeric-fortified line. Yet 100% juice faces unfavorable Nutri-Grade rankings because naturally occurring fructose still raises sugar scores, dampening impulse buys among calorie-watchers. Concentrates stay niche at retail but remain vital for cafés and hotels that reconstitute on-site to control cost. The Asia-Pacific fruit juice market therefore evolves into a two-tier structure: high-margin fortified drinks for health-oriented urbanities and cost-efficient concentrates for service operators.


By Packaging Type: Aseptic Cartons Gain on Sustainability and Shelf Life
PET bottles commanded 48.28% share in 2025, favored for transparency (consumers see pulp and color), resealability, and compatibility with existing filling lines. Yet aseptic packages will grow at 7.12% CAGR through 2031, driven by extended shelf-life economics (12 months ambient versus 7-14 days chilled) and sustainability mandates in Australia and New Zealand, where extended producer responsibility (EPR) schemes penalize multi-layer packaging. Tetra Pak's USD 50 million aseptic line in Vietnam, commissioned in 2024, targets Southeast Asian brands seeking to eliminate cold-chain dependency and penetrate rural markets where refrigeration infrastructure remains patchy. Glass bottles, while premium-positioned in on-trade channels (hotels, restaurants), suffer from weight-related logistics costs and breakage risk, limiting share to <5%. Metal cans appeal to single-serve convenience but face aluminum-price volatility and limited recycling infrastructure in emerging APAC markets. Disposable cups and pouches cater to ultra-low-price segments in India and Indonesia, where affordability overrides environmental concerns.
Aseptic technology also enables flavor innovation: heat-sensitive compounds like vitamin C and volatile aromatics degrade less under aseptic processing than traditional hot-fill methods, preserving sensory quality that justifies premium pricing. Dai Nippon Printing's recyclable mono-material aseptic pouch, introduced in 2025, addresses circular-economy pressures in Japan and Australia, where brands face escalating EPR fees for non-recyclable packaging. However, aseptic lines require capital outlays of USD 30-50 million and specialized technical expertise, creating barriers for smaller regional players. PET bottles retain dominance in modern trade due to visual appeal and consumer familiarity, but regulatory tailwinds, plastic-reduction targets, and carbon-footprint disclosure mandates will progressively tilt economics toward fiber-based aseptic formats.
By Category: Organic Niche Expands Amid Certification Complexity
Conventional juice held 68.58% share in 2025, benefiting from established supply chains, lower input costs, and broad retail distribution. Organic juice will grow at 6.24% CAGR through 2031, concentrated in Japan, Australia, and urban China, where consumers link pesticide-free agriculture to personal health and environmental stewardship. Japan's JAS Organic certification and Australia's NASAA/ACO standards impose traceability requirements, farm-to-bottle audits, and segregated processingand that elevate production costs 30-50%, restricting organic to specialty retailers and premium on-trade channels. Kagome's "Tsuchi to Yasai" organic line in Japan commands JPY 400-500 (USD 2.80-3.50) per 200 ml, targeting affluent shoppers in department-store food halls and natural-foods stores. India's National Programme for Organic Production (NPOP) certified 1.2 million hectares of organic farmland in 2025, yet juice processors struggle with inconsistent yields and fragmented supply, limiting organic SKU availability outside metros like Delhi and Mumbai.
Organic growth also hinges on consumer education: surveys in Southeast Asia reveal that <30% of shoppers understand organic certification, conflating it with "natural" or "preservative-free" claims that lack regulatory definition. Brands invest in point-of-sale materials and digital campaigns to justify price premiums, but conversion rates remain low in price-sensitive markets. Conventional juice benefits from economies of scale, bulk procurement, multi-crop blending, synthetic pesticide use, which keep retail prices 40-70% below organic equivalents, maintaining mass-market accessibility. Regulatory harmonization could accelerate organic adoption: mutual recognition of Japan's JAS and Australia's ACO standards would reduce duplicate certification costs, yet political and bureaucratic barriers slow progress.
By Distribution Channel: Off-Trade Dominance Masks On-Trade Resurgence
Off-trade outlets secured 82.35% of 2025 sales, anchored by hypermarkets (Carrefour, Aeon, Big Bazaar) that leverage promotional pricing and private-label penetration to drive volume. Supermarkets and hypermarkets account for 55-60% of off-trade sales, offering one-stop shopping convenience and loyalty programs that lock in repeat purchases. Convenience stores (7-Eleven, FamilyMart, Lawson) grew juice sales 14% in 2025, driven by chilled-section expansion and single-serve formats (200-350 ml) tailored to commuter occasions. Online retail, while still <10% of off-trade, will expand at double-digit CAGRs as e-grocery platforms (Alibaba's Freshippo, JD.com, BigBasket) invest in cold-chain logistics and subscription models that automate replenishment. Other off-trade channels, mom-and-pop stores, kiosks, retain importance in rural India and Indonesia, where modern trade penetration lags urban centers.
On-trade channels will grow at 7.52% CAGR through 2031, recovering from pandemic lows as tourism rebounds and premiumization drives single-serve glass-bottle sales in hotels, restaurants, and cafés. Hospitality operators leverage experiential consumption, freshly squeezed juice bars, tableside presentation to command 30-40% price premiums over retail equivalents. Thailand's tourism sector, which welcomed 28 million international arrivals in 2025 (up from 11 million in 2022), fuels on-trade demand for tropical-fruit blends (mango, pineapple, dragon fruit) that showcase local provenance. However, on-trade economics remain fragile: labor costs, rent, and spoilage rates (chilled juice has 7-14 day shelf life) compress margins, making operators vulnerable to economic downturns or renewed pandemic restrictions. Brands support on-trade partners with equipment loans (juicers, refrigerated displays) and staff training to ensure consistent quality and brand representation.
Geography Analysis
China held 40.58% of Asia-Pacific juice revenue in 2025, driven by urbanization, rising disposable incomes, and e-commerce penetration that brings premium brands to tier-2 and tier-3 cities. Nongfu Spring and Tingyi dominate with extensive distribution networks and localized flavors (lychee, hawthorn, kumquat) that resonate with regional palates. However, sugar-reduction campaigns and front-of-pack labeling proposals from China's State Administration for Market Regulation (SAMR) pressure reformulation toward natural sweeteners and functional fortification. Malaysia will expand at 7.32% CAGR through 2031, the fastest in the region, fueled by halal-certified product proliferation, young demographics, and modern-trade expansion in Kuala Lumpur and Johor Bahru. F&N Foods' halal-certified juice range, launched in 2024, targets Muslim-majority markets across Southeast Asia, leveraging Malaysia's Jakim certification as a trust signal.
India's juice market will grow at a mid-single-digit CAGR, concentrated in urban centers, where organized retail and cold-chain infrastructure support chilled distribution. Australia emphasizes organic and sustainably sourced juices, with NASAA and ACO certifications signaling pesticide-free provenance to health-conscious consumers. Bega Group's organic apple and orange juice, launched in 2025, commands AUD 6-8 (USD 4.00-5.30) per liter in Woolworths and Coles, targeting affluent shoppers willing to pay premiums for traceability. Indonesia, Thailand, and Singapore will post mid-to-high single-digit CAGRs, driven by tourism recovery (on-trade demand), convenience-store expansion (single-serve formats), and e-commerce logistics that reduce distribution friction. South Korea's juice market remains niche, overshadowed by coffee and tea, but functional blends (pomegranate-collagen, acai-berry) gain traction among female consumers aged 25-45. The Rest of Asia-Pacific, Vietnam, Philippines, Pakistan, will grow as modern trade penetrates secondary cities and cold-chain investments enable chilled distribution beyond urban cores.
the Regulatory frameworks vary widely: Singapore's Nutri-Grade labeling and Thailand's sugar tax mandate reformulation, while India's FSSAI and China's SAMR propose front-of-pack warnings that fragment product portfolios. Japan's Ministry of Health, Labour and Welfare updated dietary guidelines in 2024 to recommend fruit-based beverages with no added sugars, catalyzing demand for 100% juice. Australia and New Zealand enforce extended producer responsibility (EPR) schemes that penalize non-recyclable packaging, accelerating adoption of rPET and fiber-based aseptic cartons. These regulatory divergences force brands to maintain region-specific formulations, labeling, and packaging, diluting economies of scale and inflating compliance costs.
Competitive Landscape
The Asia-Pacific fruit juice market exhibits moderate fragmentation, with global majors, Coca-Cola, PepsiCo, Suntory controlling distribution but facing margin erosion from regional specialists that exploit flavor localization and halal certification. Multinational portfolios struggle to replicate niche blends lychee-rose in China, calamansi in the Philippines, yuzu-collagen in Japan, at scale, ceding premium segments to agile local players like Nongfu Spring, Dabur, and Kagome. Strategy patterns bifurcate: global brands leverage route-to-market muscle and marketing budgets to dominate modern trade, while regional players focus on value-for-money positioning, vernacular advertising, and direct-store delivery in traditional outlets.
White-space opportunities emerge in functional fortification (probiotics, adaptogens), organic certification, and on-trade premiumization, where experiential consumption justifies 30-40% price premiums over retail equivalents. Technology adoption differentiates winners: aseptic filling lines (Tetra Pak, Dai Nippon Printing) enable ambient-stable cartons that eliminate cold-chain dependency, unlocking rural distribution in India, Indonesia, and Vietnam. High-pressure processing (HPP) preserves volatile flavor compounds and vitamin C content without heat, commanding premiums in Japan and South Korea.
Brands also deploy digital tools, AI-driven demand forecasting, blockchain traceability, to optimize inventory and substantiate sustainability claims. However, smaller players lack capital for multi-million-dollar aseptic lines or HPP equipment, relying instead on toll manufacturing and co-packing arrangements that compress margins. Regulatory compliance, FSSAI in India, SAMR in China, MHLW in Japan—imposes testing, labeling, and traceability costs that favor incumbents with dedicated regulatory affairs teams, creating barriers to entry for startups and imports.
Asia-Pacific Juices Industry Leaders
Suntory Holdings Limited
The Coca-Cola Company
Nongfu Spring Co.
Beijing Huiyuan Food and Beverage Co.
ITC Limited
- *Disclaimer: Major Players sorted in no particular order

Recent Industry Developments
- February 2026: Malaysian beverage chain Bungkus Kaw Kaw unveiled its Ong Kaw Kaw Pineapple Series for Chinese New Year 2026, featuring real fresh fruits with no artificial ingredients. The limited-time lineup includes Pineapple Passion Fruit, Pineapple Lemon, and a Pineapple Series with tumbler, available at all outlets nationwide.
- August 2025: Rasna Pvt. Ltd. relaunched its acquired Jumpin ready-to-drink fruit juice brand. The reformulated lineup features Mango, Orange, Litchi, and Mixed Fruit flavors fortified with 10 vitamins and only 7g of added sugar per serving.
- May 2025: Australian firm WA Farm Direct launched Soluna Apple Juice, a cold-pressed product made exclusively from its signature ANABP 01 apples. The no-additive juice uses cold-pressing for nutrient retention and High-Pressure Processing (HPP) for safety.
- December 2024: Dabur India partnered with Ball Corporation to introduce Réal Bites juice in 185ml fully recyclable aluminium cans, featuring real fruit chunks in Peach, Pineapple, and Green Apple flavors.


Asia-Pacific Juices Market Report Scope
The Asia-Pacific juices market is segmented by product type into 100% juices, juice drinks (up to 24% juice), juice concentrates, and nectars. By packaging type, the market is segmented into aseptic packages, glass bottles, metal cans, PET bottles, and disposable cups and pouches. By category, the market is segmented into conventional and organic. By Distribution channels, the market is segmented into off-trade and on-trade. By off-trade, the market is further segmented into supermarkets/hypermarkets, convenience stores, online retail, and other distribution channels. The market is segmented by geography into China, India, Japan, Australia, Indonesia, South Korea, Thailand, Singapore, and the rest of Asia-Pacific. The market sizing has been done in value terms in USD for all the abovementioned segments.
| 100% Juice |
| Juice Drinks (up to 24% Juice) |
| Juice Concentrates |
| Nectars |
| Aseptic packages |
| Glass Bottles |
| Metal Can |
| PET Bottles |
| Disposable Cups and Pouches |
| Conventional |
| Organic |
| Off-Trade | Supermarkets/Hypermarkets |
| Convenience Stores | |
| Online Retail | |
| Other Distribution Channels | |
| On-Trade |
| China |
| India |
| Japan |
| Australia |
| Indonesia |
| South Korea |
| Thailand |
| Singapore |
| Rest of Asia-Pacific |
| Product Type | 100% Juice | |
| Juice Drinks (up to 24% Juice) | ||
| Juice Concentrates | ||
| Nectars | ||
| Packaging Type | Aseptic packages | |
| Glass Bottles | ||
| Metal Can | ||
| PET Bottles | ||
| Disposable Cups and Pouches | ||
| Category | Conventional | |
| Organic | ||
| Distribution Channel | Off-Trade | Supermarkets/Hypermarkets |
| Convenience Stores | ||
| Online Retail | ||
| Other Distribution Channels | ||
| On-Trade | ||
| Geography | China | |
| India | ||
| Japan | ||
| Australia | ||
| Indonesia | ||
| South Korea | ||
| Thailand | ||
| Singapore | ||
| Rest of Asia-Pacific | ||


Market Definition
- Carbonated Soft Drinks (CSDs) - Carbonated soft drinks (CSDs) refer to non-alcoholic beverages that are carbonated and typically flavored, containing dissolved carbon dioxide to create effervescence. These beverages commonly include cola, lemon-lime, orange, and various fruit-flavored sodas. Marketed in cans, bottles, or fountain dispense.
- Juices - We have considered packaged juices which encompass non-alcoholic beverages derived from fruits, vegetables, or a combination thereof, processed and sealed in various packaging formats such as bottles, cartons, or pouches. Excluding fresh juices, this market segment involves commercially prepared and preserved juices, often with added preservatives and flavors.
- Ready-to-Drink (RTD) Tea and RTD Coffee - Ready-to-Drink (RTD) tea and RTD coffee are pre-packaged, non-alcoholic beverages that are brewed and prepared for consumption without further dilution. RTD tea typically includes various tea varieties, infused with flavors and sweeteners, and comes in bottles, cans, or cartons. Similarly, RTD coffee involves pre-brewed coffee formulations, often mixed with milk, sugar, or flavorings, and is conveniently packaged for on-the-go consumption.
- Energy Drinks - Energy drinks are non-alcoholic beverages formulated to provide a quick boost of energy and alertness. Whereas, sports drinks are beverages designed to hydrate and replenish electrolytes, particularly after physical exertion, exercise, or intense activity
| Keyword | Definition |
|---|---|
| Carbonated Soft Drinks | Carbonated soft drinks (CSDs) are a combination of carbonated water and flavouring, sweetened by sugar or a non-sugar sweeteners. |
| Standard Cola | Standard Cola is defined as the original flavor of cola soda. |
| Diet Cola | A cola-based soft drink containing no or low amounts of sugar |
| Fruit Flavored Carbonates | A carbonated beverage prepared from fruit juice/fruit flavor with carbonated water and containing sugar, dextrose, invert sugar or liquid glucose either singly or in combination. It may contain peel oil and fruit essences. |
| Juice | Juice is a drink made from the extraction or pressing of the natural liquid contained in fruit and vegetables. |
| 100% Juice | Fruit/vegetable juice made from fruit in the form of its juice with no water added to make up the volume. It is not permitted to add sugars, sweeteners, preservatives, flavourings or colourings to fruit juice. |
| Juice Drinks (up to 24% Juice) | Fruit/vegetable juice drinks with up to 24% fruits/vegetable extract. |
| Nectars (25-99% Juice) | Juices that can have between 25 and 99% of fruit, with the minimum legal limits defined depending on the type of fruit |
| Juice concentrates | Juice Concentrates are those form of juices when most of this liquid is removed resulting in a thick, syrupy product known as juice concentrate. |
| RTD Coffee | Packaged coffee beverages that are sold in a prepared form and are ready for consumption at the time of purchase. |
| Iced Coffee | An iced coffee is a cold version of coffee, usually a combination of hot espresso and milk with ice added to it. |
| Cold Brew Coffee | Cold brew also called cold water extraction or cold pressing is made by steeping ground coffee in room-temperature water for several hours. |
| RTD Tea | Ready-to-drink (RTD) tea is a packaged tea product ready for immediate consumption without brewing or preparation |
| Iced Tea | Ice tea or iced tea is a drink made from tea without milk but with sugar and sometimes fruit flavourings, drunk cold. |
| Green Tea | Green tea is a tea beverage which promotes mental alertness, relieving digestive symptoms and promoting weight loss. |
| Herbal Tea | Herbal tea beverages are made from the infusion or decoction of herbs, spices, or other plant material in hot water. |
| Energy Drink | A type of drink containing stimulant compounds, usually caffeine, which is marketed as providing mental and physical stimulation. They may or may not be carbonated and may also contain sugar, other sweeteners, or herbal extracts, among numerous possible ingredients. |
| Sugar-free or Low-calories Energy Drinks | Sugar-free or Low-calories Energy Drinks are sugar-free, artificially sweetened energy drinks with few or no calories. |
| Traditional Energy Drink | Traditional Energy Drinks are functional soft drinks containing ingredients designed to boost the consumer's energy. |
| Natural/Oraganic Energy Drinks | Natural/Organic energy drinks are energy drinks free of artificial sweeteners and synthetic colorings. Instead, they contain naturally derived ingredients such as green tea, yerba mate, and botanical extracts. |
| Energy Shots | A small but highly concentrated energy drink that contains large amounts of caffeine and/or other stimulants. The quantity is comparatively smaller compared to energy drinks. |
| Sports Drink | Sports drinks are beverages designed specifically for the rapid supply of fluid, carbohydrates, and electrolytes before, during or after exercise. |
| Isotonic | Isotonic drinks contain similar concentrations of salt and sugar as in the human body, and are designed to quickly replace fluids lost during exercise but with an increase of carbohydrate. |
| Hypertonic | Hypertonic drinks have a higher concentration of salt and sugar than the human body. They are best drunk after exercise as it is important to replace glycogen levels quickly after exercise. |
| Hypotonic | Hypotonic drinks are designed to quickly replace fluids lost during exercise. They have very low carbohydrate content and a lower concentration of salt and sugar than the human body. |
| Electrolyte-Enhanced Water | Electrolyte water is water infused with electrically-charged minerals, such as sodium, potassium, calcium, and magnesium. |
| Protein-based Sport Drinks | Protein-based sports drinks are those sports drinks which has added protein in it that will improve performance and reduce muscle protein breakdown. |
| On-Trade | The on-trade refers to places that sell beverages for immediate consumption on the premises like bars, restaurants, and pubs |
| Off-Trade | Off-trade usually means places like liquor stores, supermarkets and other places where you don't consume the beverage right away. |
| Convenience Store | A retail business that provides the public with a convenient location to quickly purchase a wide variety of consumable products and services, generally food and gasoline. |
| Specialty store | A specialty store is a shop/store that carries a deep assortment of brands, styles, or models within a relatively narrow category of goods |
| Online Retail | Online retail is a type of eCommerce whereby a business sells goods or services directly to consumers from a website. |
| Aseptic Packaging | Aseptic packaging refers to the filling of a cold, commercially sterile product under sterile conditions into a presterilized container and closure under sterile conditions to form a seal that effectively excludes microorganisms. These includes tetra packs, cartons, pouches etc. |
| PET Bottle | PET bottle means a bottle made of polyethylene terephthalate. |
| Metal Cans | Metal containers made of aluminum or tin- plated or zinc-plated steel, which are commonly used for packaging food, beverages or other products. |
| Disposable Cups | Disposable Cup means a cup or other container designed for single use to serve beverages, such as water, cold drinks, hot drinks and alcoholic beverages. |
| Gen Z | A way of referring to the group of people who were born in the late 1990s and early 2000s. |
| Millenial | Anyone born between 1981 and 1996 (ages 23 to 38 in 2019) is considered a Millennial |
| Taurine | Taurine is an amino acid that supports immune health and nervous system function. |
| Bars & Pubs | It is a drinking establishment licensed to serve alcoholic drinks for consumption on the premises. |
| Café | It is a foodservice establishment serving refreshments (mainly coffee) and light meals. |
| On the go | It means doing / dealing with while busily engaged with something and not diverting plans in order to accommodate. |
| Internet Penetration | The Internet Penetration Rate corresponds to the percentage of the total population of a given country or region that uses the Internet. |
| Vending Machine | A machine that dispenses small articles such as food, drinks, or cigarettes when a coin or token is inserted |
| Discount store | A discount store or discounter offers a retail format in which products are sold at prices that are in principle lower than an actual or supposed "full retail price". Discounters rely on bulk purchasing and efficient distribution to keep down costs. |
| Clean Label | Clean label on the beverage market are drinks that are made from few ingredients of natural origin and are not or only slightly processed. |
| Caffeine | An alkaloid compound which is a stimulant of the central nervous system. It is mainly used recreationally, as a mild cognitive enhancer to increase alertness and attentional performance. |
| Extreme sport | Action sports, adventure sports or extreme sports are activities perceived as involving a high degree of risk. |
| High-intensity interval training | It incorporates several rounds that alternate between several minutes of high intensity movements to significantly increase the heart rate to at least 80% of one's maximum heart rate, followed by short periods of lower intensity movements. |
| Shelf life | The length of time for which an item remains usable, fit for consumption, or saleable. |
| Cream Soda | Cream soda is a sweet soft drink. Generally flavored with vanilla and based on the taste of an ice cream float |
| Root Beer | Root beer is a sweet North American soft drink traditionally made using the root bark of the sassafras tree Sassafras albidum or the vine of Smilax ornata as the primary flavor. Root beer is typically, but not exclusively, non-alcoholic, caffeine-free, sweet, and carbonated. |
| Vanilla Soda | A carbonated soft drink flavoured with vanilla. |
| Dairy-Free | A product that does not contain any milk or milk products from cows, sheep or goats. |
| Caffeine-Free Energy Drinks | Caffeine-free energy drinks rely on other ingredients to boost the energy. Popular choices include amino acids, B vitamins, and electrolytes. |


Research Methodology
Mordor Intelligence follows a four-step methodology in all our reports.
- Step-1: IDENTIFY KEY VARIABLES: In order to build a robust forecasting methodology, the variables and factors identified in Step 1 are tested against available historical market numbers. Through an iterative process, the variables required for market forecast are set, and the model is built on the basis of these variables.
- Step-2: Build a Market Model: Market-size estimations for the forecast years are in nominal terms. Inflation is not a part of the pricing, and the average selling price (ASP) is kept constant throughout the forecast period for each country.
- Step-3: Validate and Finalize: In this important step, all market numbers, variables, and analyst calls are validated through an extensive network of primary research experts from the market studied. The respondents are selected across levels and functions to generate a holistic picture of the market studied.
- Step-4: Research Outputs: Syndicated reports, custom consulting assignments, databases & subscription platforms


