Market Overview
| Study Period | 2018 - 2031 |
|---|---|
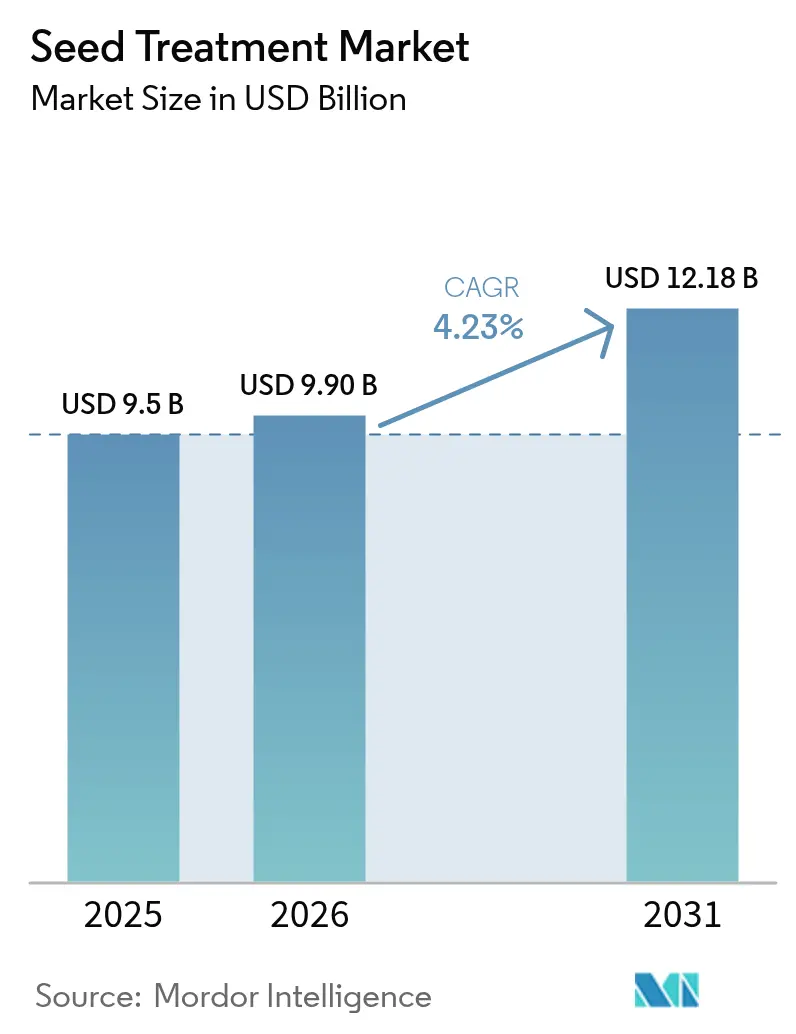
| Market Size (2026) | USD 9.9 Billion |
| Market Size (2031) | USD 12.18 Billion |
| Growth Rate (2026 - 2031) | 4.23% CAGR |
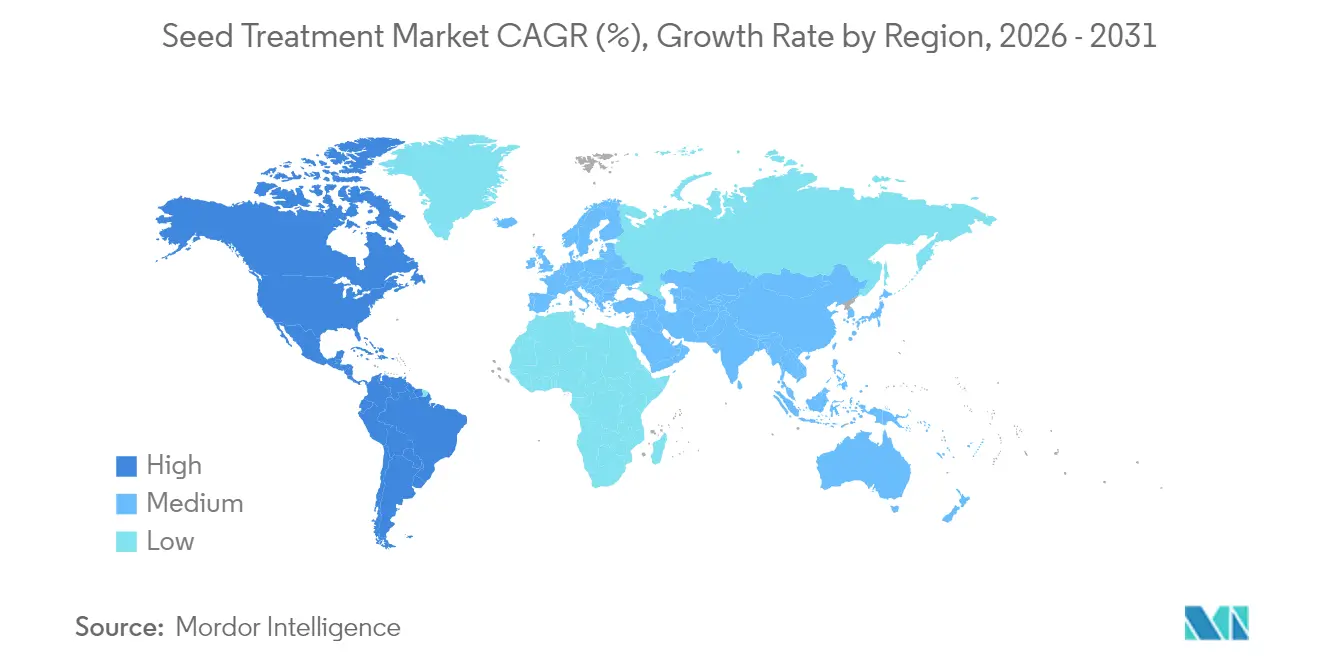
| Fastest Growing Market | North America |
| Largest Market | South America |
| Market Concentration | Medium |
Major Players *Disclaimer: Major Players sorted in no particular order Image © Mordor Intelligence. Reuse requires attribution under CC BY 4.0. | |
Seed Treatment Market Analysis by Mordor Intelligence
Seed treatment market size in 2026 is estimated at USD 9.9 billion, growing from 2025 value of USD 9.5 billion with 2031 projections showing USD 12.18 billion, growing at 4.23% CAGR over 2026-2031. Market expansion is propelled by precision-agriculture platforms that enable micro-dosing, a surge in biological formulations that comply with stricter residue rules, and escalating adoption of high-value hybrid and genetically modified seeds. Sustained investments in polymer encapsulation have reduced dust-off emissions to meet European and North American safety thresholds, while regulatory incentives reward low-residue coatings and expedite the approval of biological products. Competitive dynamics remain in flux as strategic alliances between agrochemical majors and biotech start-ups shorten product-development cycles and diversify seed-applied nematicide options. Moderate concentration leaves headroom for specialized players that can combine proprietary microorganisms with advanced coating chemistries and offer bundled agronomic services.
Key Report Takeaways
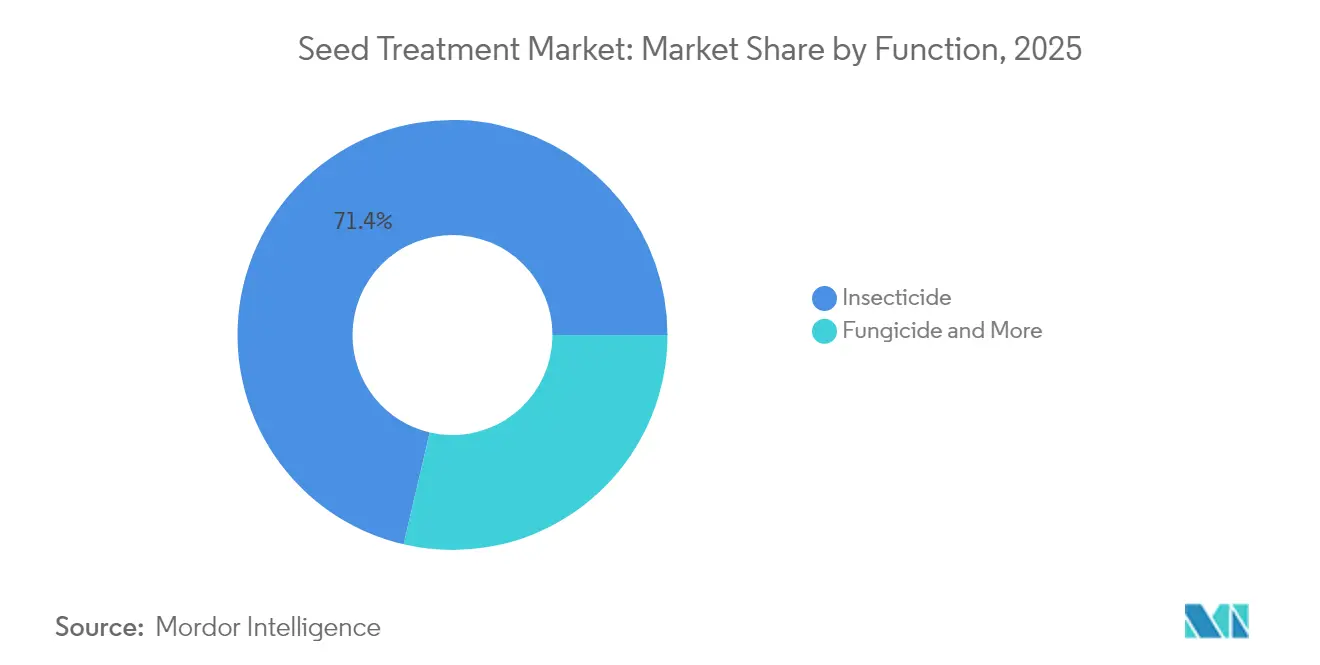
- By function, insecticides led the seed treatment market with a 71.35% market share in 2025 and are projected to record the fastest growth of 4.61% CAGR through 2031.
- By crop type, grains and cereals accounted for 41.75% of the seed treatment market size in 2025, whereas pulses and oilseeds are anticipated to advance at a 4.48% CAGR to 2031.
- By geography, South America captured 44.10% of the seed treatment market share in 2025, while North America is forecast to expand at a 4.66% CAGR between 2026 and 2031.
- The seed treatment market is moderately concentrated, with the top five suppliers accounting for less than 50% of global revenue.
Note: Market size and forecast figures in this report are generated using Mordor Intelligence’s proprietary estimation framework, updated with the latest available data and insights as of 2026.
Global Seed Treatment Market Trends and Insights
Drivers Impact Analysis*
| Driver | (~) % Impact on CAGR Forecast | Geographic Relevance | Impact Timeline |
|---|---|---|---|
| Surge in biological seed-treatment R&D partnerships | +0.8% | Global with Asia Pacific leadership | Medium term (2–4 years) |
| Precision-agriculture driven micro-dosing demand | +0.7% | North America and Europe | Short term (≤ 2 years) |
| Shift to polymer encapsulation for reduced dust-off | +0.6% | Europe and North America | Medium term (2–4 years) |
| Regulatory incentives favoring low-residue coatings | +0.5% | Europe, North America, emerging Asia Pacific | Long term (≥ 4 years) |
| Growth in GMO and high-value hybrid seed adoption | +0.9% | Global, strongest in Americas | Short term (≤ 2 years) |
| Expansion of seed-applied nematicides for soy and corn | +0.7% | South America, United States corn belt | Medium term (2–4 years) |
| Source: Mordor Intelligence | |||


Surge in Biological Seed-Treatment R&D Partnerships
R&D partnerships in seed treatment bring together the expertise and resources of leading agrochemical firms, biostimulant producers, and technology companies. Their goal is to tackle challenges commonly faced by traditional biological products, such as inconsistent performance and limited shelf life. By pooling diverse R&D capabilities ranging from microbial genomics and formulation chemistry to precision application technology, these partnerships significantly shorten the time it takes to bring novel biological solutions, such as biological seed treatment, to market. In a notable move, Syngenta Biologicals partnered with Unium Bioscience in May 2023, introducing the biological seed treatment NUELLO iN to Northwest Europe [1]Source: Syngenta, “Press releases,” syngenta.com. This innovative product enhances a plant's ability to utilize atmospheric nitrogen, allowing growers to reduce their reliance on synthetic fertilizers by over 10%.
Precision-Agriculture Driven Micro-Dosing Demand
Variable-rate seeding systems integrate treatment prescriptions that tailor active-ingredient loads to soil and pest data, thereby reducing input costs while preserving microbial viability. In 2024, companies such as FMC reported 23% growth in precision-applied solutions, indicating that data-enabled dosing has become a mainstream value driver for the seed treatment market. Machine-learning algorithms adjust dosages in real-time based on moisture and temperature, improving the return on investment for high-margin biological coatings.
Shift to Polymer Encapsulation for Reduced Dust-Off
Advanced biodegradable polymers slash particulate emissions by more than 70%, aligning with European rules that limit dust-off to 0.75 g per 100,000 seeds. Croda International and other specialty chemical suppliers now offer bio-based matrices that synchronize multi-active release profiles, extending protection windows and reducing environmental exposure. Compliance benefits and enhanced field performance underpin premium pricing, reinforcing revenue growth across the seed treatment market.
Regulatory Incentives Favoring Low-Residue Coatings
Regulatory incentives are steering the seed treatment market towards eco-friendly alternatives, pushing for a phase-out of harmful synthetic products. In September 2023, the European Union formally adopted Regulation 2023/2055, which took effect in October 2023 [2]Source: European Commission, “Commission Regulation (EU) 2023/2055,” ec.europa.eu. This regulation mandates a shift from conventional synthetic polymers in seed coatings, triggering immediate research and development into compliant alternatives. The regulation, the most pivotal of its kind, restricts the use of synthetic polymer microparticles in various products, notably in agricultural applications such as seed coatings. In Canada and certain United States states, tax credits are promoting the early adoption of microbial inoculants, broadening the market's reach and enhancing its prospects. Furthermore, suppliers aiming at export-oriented growers now find compliance with ISO 14001 frameworks essential.
Restraints Impact Analysis*
| Restraint | (~) % Impact on CAGR Forecast | Geographic Relevance | Impact Timeline |
|---|---|---|---|
| Pollinator-toxicity regulations on neonicotinoids | -0.9% | Europe, Canada, and emerging United States bans | Short term (≤ 2 years) |
| Farmer hesitancy over premium-coating costs | -0.6% | Asia Pacific smallholders, Africa | Medium term (2–4 years) |
| Shelf life challenges of microbial formulations | -0.4% | Hot-climate regions such as Asia Pacific, South America, and the Middle East and Africa | Medium term (2–4 years) |
| Supply chain volatility for specialty polymers | -0.3% | Global | Short term (≤ 2 years) |
| Source: Mordor Intelligence | |||
Pollinator-Toxicity Regulations on Neonicotinoids
The banning or restriction of popular systemic insecticides, such as neonicotinoids, due to their documented harm to pollinators, particularly bees, has created uncertainty for farmers and reduced the market for neonicotinoid-treated seeds. As of July 2024, Canada has implemented a ban on certain pesticides harmful to bees, specifically targeting neonicotinoids [3]Source: Center for Environmental Research and Innovation (CERI), “New Regulations on Bee-Harmful Pesticides and Registration Processes in Canada,” ceri.ca. This decision, combined with a more rigorous review process for new pesticides, is anticipated to shift the seed treatment market in Canada away from neonicotinoids. The ongoing risk of neonicotinoid bans and the lengthy approval process for new pesticides may disrupt agricultural planning. Farmers relying on these treatments to protect high-value crops face uncertainty regarding future access, which may delay purchasing decisions and limit market growth.
Farmer Hesitancy Over Premium-Coating Costs
Although innovative coatings provide advantages such as enhanced yield and sustainability, the upfront costs can discourage adoption, particularly among farmers in developing economies or those with limited financial resources and exposure to volatile crop prices. In many developing markets, farmers often operate with restricted credit and constrained budgets. The higher price of premium-treated seeds poses a considerable financial challenge, hindering their adoption despite the evident long-term benefits. For instance, small-scale farmers in India are reluctant to adopt treatments priced above INR 200 per kg (approximately USD 2.40 per kg) and frequently avoid biological or polymer options, even when these could improve yields. Limited access to credit and low penetration of crop insurance further reduce adoption rates, slowing the growth of the seed treatment market in densely populated regions.
*Our forecasts treat driver/restraint impacts as directional, not additive. The impact forecasts reflect baseline growth, mix effects, and variable interactions.
Segment Analysis
By Function: Adaptive Innovation Sustains Growth
Insecticides accounted for 71.35% of the seed treatment market in 2025 and are anticipated to grow at a 4.61% CAGR by 2031, despite tightened neonicotinoid bans in many regions. Rapid shifts in portfolio toward diamide, pyrethroid, and bio-insecticide classes underpin the growth. Nematicides, though smaller in base, post the steady growth as rising soybean cyst and root-knot infestations compel early-season action. Fluopyram and abamectin formulas enhance seed-zone coverage, delivering double-digit yield increases, while microbial contenders based on Bacillus firmus carve out a premium niche.
Climate-driven pathogen loads keep fungicides firmly in second place in terms of revenue. Controlled-release polymers extend field efficacy, enhancing treatment value and sustaining mid-single-digit growth. Companies with integrated active plus polymer development pipelines outperform peers by shortening registration cycles and securing multi-season stewardship data that satisfy regulators. Altogether, functional diversification shields the seed treatment market from single-segment volatility and encourages solution bundling, which elevates per-acre spending.


By Crop Type: Protein Demand Reshapes Treatment Portfolios
Grains and cereals dominated the seed treatment market, accounting for 41.75% of the market size in 2025, primarily driven by the increased acreage of corn, wheat, and rice. Still, pulses and oilseeds advance at a 4.48% CAGR as dietary shifts toward plant proteins spur soybean and chickpea planting in South America and South Asia. Soybean treatments alone generated USD 2.1 billion, driven by dual-mode fungicide-nematicide packages protecting high-value traits. Integrated treatment bundles lower per-bushel costs and simplify compliance with zero-tolerance residue mandates prevalent in export destinations.
Commercial crops, such as cotton and canola, are rapidly adopting hybrid seeds and multi-active coatings that protect against insects, nematodes, and diseases. Fruits and vegetables often emphasize biological coatings to secure organic certification and obtain export clearances, creating opportunities for microbial innovators. Aesthetic demands keep turf and ornamentals a premium, yet niche, arena where seed counts are low, yet treatment margins remain high. Diverse crop-specific regulations require suppliers to maintain flexible manufacturing and registration infrastructures, while also enabling them to segment pricing and value propositions across the broader seed treatment market.
Geography Analysis
South America retained the largest stake at 44.10% in 2025, as Brazil’s soybean frontier in Mato Grosso and Argentina’s corn belt expanded, fuelling the deployment of intensive nematicides. ANVISA’s 47 biological approvals underscore regulatory momentum for eco-friendly solutions, and the establishment of cold-chain infrastructure supports microbial viability across Brazil’s diverse climates.
North America is poised for the fastest growth, registering a 4.66% CAGR through 2031, driven by precision agriculture rebates in the United States Midwest and blackleg-related demand for canola treatments in Canada. State-level pollinator protection acts channel R&D dollars into alternative chemistries and incentivize on-farm pilots for biological formulations.
The Asia-Pacific region exhibits uneven progress, with China advancing variable-rate seeders and striving for greater self-sufficiency in soybean production, whereas India’s smallholder structure and price sensitivity hinder the adoption of premium seeds. Japan leads in residue-sensitive vegetable exports that demand certified biological solutions, while Australia’s broad-acre wheat segment continues to rely on synthetic chemistries under relatively lenient regulatory frameworks. Expanding cold-storage nodes in Southeast Asia gradually mitigate microbial shelf-life concerns, enlarging the potential addressable seed treatment market in tropical zones.

Competitive Landscape
Market concentration remains moderate, with the top five suppliers accounting for less than 50% of global revenue. Notably, Syngenta leads, followed by Bayer and BASF. Scale affords these firms unmatched distribution, R&D, and regulatory resources. Yet, the seed treatment market leaves ample room for specialists to leverage patented microbial strains, RNAi technology, and biodegradable polymers that satisfy emerging sustainability metrics.
Companies are investing in bio-based treatments and environmentally friendly formulations to meet growing demand for sustainable agriculture practices. Building strong relationships with seed companies and agricultural service providers has become crucial for maintaining market share. Expanding presence in emerging markets through localized solutions and technical support remains a key growth strategy. Patent-filing volumes, with 340 biological versus 89 synthetic applications, signal where competitive intensity is migrating.
Regulatory mastery differentiates leaders. Microbial facilities must comply with dual Environmental Protection Agency (EPA) and Food and Drug Administration (FDA) standards, a barrier many start-ups bypass by partnering with incumbents. In emerging markets, domestic firms exploit faster local approvals and cost advantages, prompting global companies to localize production or acquire regional competitors. Vertical integration into polymer manufacturing hedges supply risk and captures additional margin as advanced coatings gain traction across the seed treatment market.
Seed Treatment Industry Leaders
BASF SE
Bayer AG
Corteva Agriscience
FMC Corporation
Syngenta Group
- *Disclaimer: Major Players sorted in no particular order

Recent Industry Developments
- October 2025: Syngenta introduced VICTRATO, a seed treatment using TYMIRIUM technology to combat nematodes and early-stage foliar diseases. It protects crops like soybeans, corn, and cotton by reducing nematode pressure, improving nutrient absorption, and enhancing stress tolerance for consistent productivity.
- January 2025: UPL Corp announced U.S. EPA registration and commercial launch of ATROFORCE bionematicide, a new seed treatment designed to protect cotton yield potential from a wide range of nematodes. This biosolution utilizes a patented strain of Trichoderma atroviride as its active ingredient, which exhibits bionematicide properties.
- December 2024: BioConsortia introduced its microbial nitrogen-fixing seed treatment, Always-N, in New Zealand. The product is distributed by H&T and will be marketed as FixiN 33 in the region.


Global Seed Treatment Market Report Scope
Fungicide, Insecticide, Nematicide are covered as segments by Function. Commercial Crops, Fruits & Vegetables, Grains & Cereals, Pulses & Oilseeds, Turf & Ornamental are covered as segments by Crop Type. Africa, Asia-Pacific, Europe, North America, South America are covered as segments by Region.Function
| Fungicide |
| Insecticide |
| Nematicide |
Crop Type
| Commercial Crops |
| Fruits and Vegetables |
| Grains and Cereals |
| Pulses and Oilseeds |
| Turf and Ornamental |
Region
| Africa | By Country | South Africa |
| Rest of Africa | ||
| Asia-Pacific | By Country | Australia |
| China | ||
| India | ||
| Indonesia | ||
| Japan | ||
| Myanmar | ||
| Pakistan | ||
| Philippines | ||
| Thailand | ||
| Vietnam | ||
| Rest of Asia-Pacific | ||
| Europe | By Country | France |
| Germany | ||
| Italy | ||
| Netherlands | ||
| Russia | ||
| Spain | ||
| Ukraine | ||
| United Kingdom | ||
| Rest of Europe | ||
| North America | By Country | Canada |
| Mexico | ||
| United States | ||
| Rest of North America | ||
| South America | By Country | Argentina |
| Brazil | ||
| Chile | ||
| Rest of South America |
| Function | Fungicide | ||
| Insecticide | |||
| Nematicide | |||
| Crop Type | Commercial Crops | ||
| Fruits and Vegetables | |||
| Grains and Cereals | |||
| Pulses and Oilseeds | |||
| Turf and Ornamental | |||
| Region | Africa | By Country | South Africa |
| Rest of Africa | |||
| Asia-Pacific | By Country | Australia | |
| China | |||
| India | |||
| Indonesia | |||
| Japan | |||
| Myanmar | |||
| Pakistan | |||
| Philippines | |||
| Thailand | |||
| Vietnam | |||
| Rest of Asia-Pacific | |||
| Europe | By Country | France | |
| Germany | |||
| Italy | |||
| Netherlands | |||
| Russia | |||
| Spain | |||
| Ukraine | |||
| United Kingdom | |||
| Rest of Europe | |||
| North America | By Country | Canada | |
| Mexico | |||
| United States | |||
| Rest of North America | |||
| South America | By Country | Argentina | |
| Brazil | |||
| Chile | |||
| Rest of South America | |||


Market Definition
- Function - Insecticides, fungicides, and nematicides are the crop protection chemicals used to treat seeds or seedlings.
- Application Mode - Seed treatment is a method of applying crop protection chemicals to the seeds before sowing or the seedlings before transplanting to the main field.
- Crop Type - This represents the consumption of crop protection chemicals by Cereals, Pulses, Oilseeds, Fruits, Vegetables, Turf, and Ornamental crops.
| Keyword | Definition |
|---|---|
| IWM | Integrated weed management (IWM) is an approach to incorporate multiple weed control techniques throughout the growing season to give producers the best opportunity to control problematic weeds. |
| Host | Hosts are the plants that form relationships with beneficial microorganisms and help them colonize. |
| Pathogen | A disease-causing organism. |
| Herbigation | Herbigation is an effective method of applying herbicides through irrigation systems. |
| Maximum residue levels (MRL) | Maximum Residue Limit (MRL) is the maximum allowed limit of pesticide residue in food or feed obtained from plants and animals. |
| IoT | The Internet of Things (IoT) is a network of interconnected devices that connect and exchange data with other IoT devices and the cloud. |
| Herbicide-tolerant varieties (HTVs) | Herbicide-tolerant varieties are plant species that have been genetically engineered to be resistant to herbicides used on crops. |
| Chemigation | Chemigation is a method of applying pesticides to crops through an irrigation system. |
| Crop Protection | Crop protection is a method of protecting crop yields from different pests, including insects, weeds, plant diseases, and others that cause damage to agricultural crops. |
| Seed Treatment | Seed treatment helps to disinfect seeds or seedlings from seed-borne or soil-borne pests. Crop protection chemicals, such as fungicides, insecticides, or nematicides, are commonly used for seed treatment. |
| Fumigation | Fumigation is the application of crop protection chemicals in gaseous form to control pests. |
| Bait | A bait is a food or other material used to lure a pest and kill it through various methods, including poisoning. |
| Contact Fungicide | Contact pesticides prevent crop contamination and combat fungal pathogens. They act on pests (fungi) only when they come in contact with the pests. |
| Systemic Fungicide | A systemic fungicide is a compound taken up by a plant and then translocated within the plant, thus protecting the plant from attack by pathogens. |
| Mass Drug Administration (MDA) | Mass drug administration is the strategy to control or eliminate many neglected tropical diseases. |
| Mollusks | Mollusks are pests that feed on crops, causing crop damage and yield loss. Mollusks include octopi, squid, snails, and slugs. |
| Pre-emergence Herbicide | Preemergence herbicides are a form of chemical weed control that prevents germinated weed seedlings from becoming established. |
| Post-emergence Herbicide | Postemergence herbicides are applied to the agricultural field to control weeds after emergence (germination) of seeds or seedlings. |
| Active Ingredients | Active ingredients are the chemicals in pesticide products that kill, control, or repel pests. |
| United States Department of Agriculture (USDA) | The Department of Agriculture provides leadership on food, agriculture, natural resources, and related issues. |
| Weed Science Society of America (WSSA) | The WSSA, a non-profit professional society, promotes research, education, and extension outreach activities related to weeds. |
| Suspension concentrate | Suspension concentrate (SC) is one of the formulations of crop protection chemicals with solid active ingredients dispersed in water. |
| Wettable powder | A wettable powder (WP) is a powder formulation that forms a suspension when mixed with water prior to spraying. |
| Emulsifiable concentrate | Emulsifiable concentrate (EC) is a concentrated liquid formulation of pesticide that needs to be diluted with water to create a spray solution. |
| Plant-parasitic nematodes | Parasitic Nematodes feed on the roots of crops, causing damage to the roots. These damages allow for easy plant infestation by soil-borne pathogens, which results in crop or yield loss. |
| Australian Weeds Strategy (AWS) | The Australian Weeds Strategy, owned by the Environment and Invasives Committee, provides national guidance on weed management. |
| Weed Science Society of Japan (WSSJ) | WSSJ aims to contribute to the prevention of weed damage and the utilization of weed value by providing the chance for research presentation and information exchange. |


Research Methodology
Mordor Intelligence follows a four-step methodology in all our reports.
- Step-1: Identify Key Variables: In order to build a robust forecasting methodology, the variables and factors identified in Step-1 are tested against available historical market numbers. Through an iterative process, the variables required for market forecast are set and the model is built on the basis of these variables.
- Step-2: Build a Market Model: Market-size estimations for the forecast years are in nominal terms. Inflation is not a part of the pricing, and the average selling price (ASP) is kept constant throughout the forecast period.
- Step-3: Validate and Finalize: In this important step, all market numbers, variables and analyst calls are validated through an extensive network of primary research experts from the market studied. The respondents are selected across levels and functions to generate a holistic picture of the market studied.
- Step-4: Research Outputs: Syndicated Reports, Custom Consulting Assignments, Databases & Subscription Platforms


