Market Overview
| Study Period | 2020 - 2031 |
|---|---|
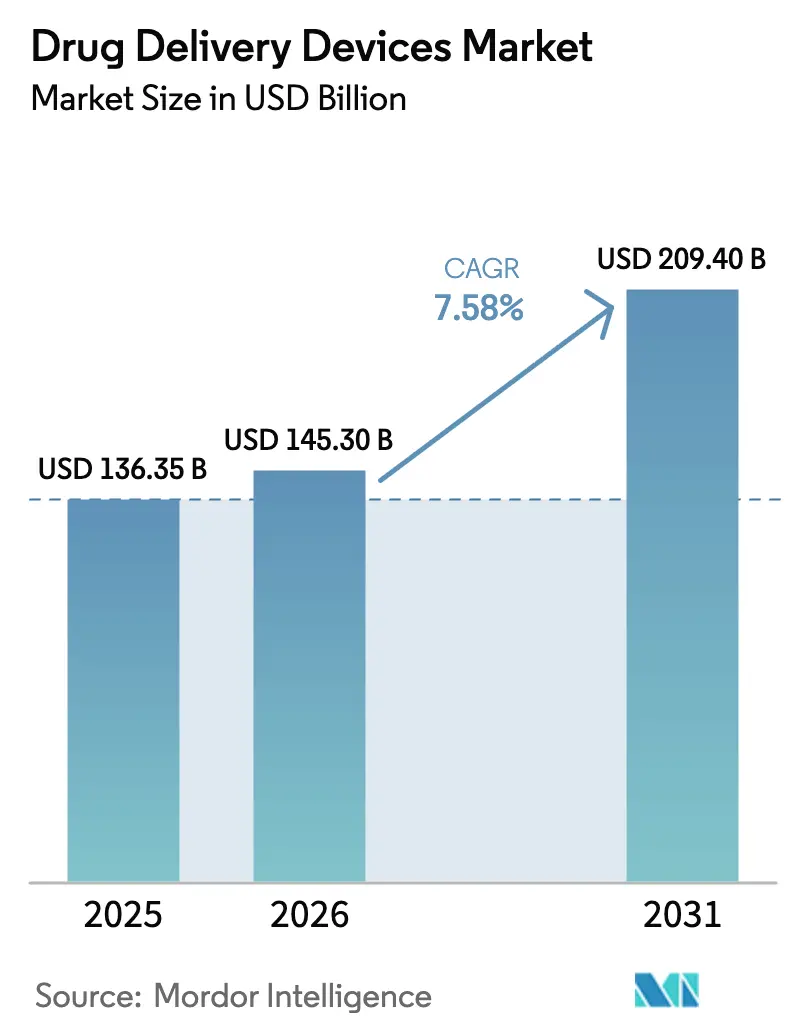
| Market Size (2026) | USD 145.30 Billion |
| Market Size (2031) | USD 209.40 Billion |
| Growth Rate (2026 - 2031) | 7.58% CAGR |
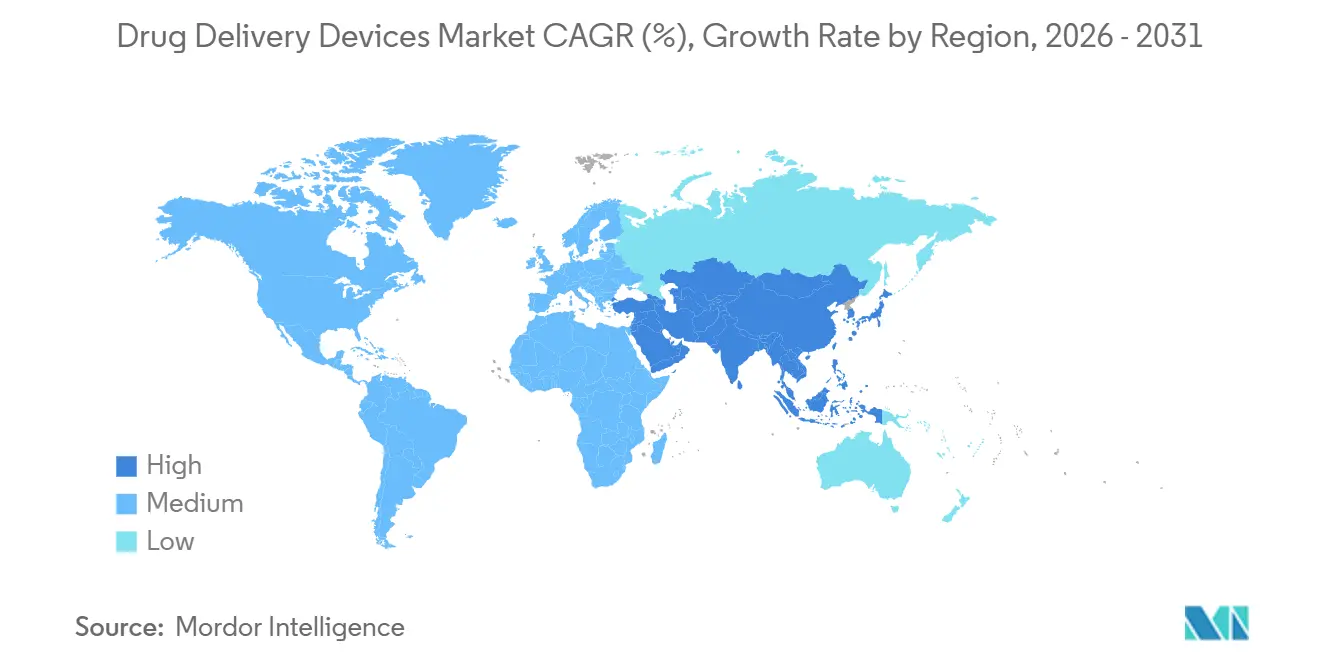
| Fastest Growing Market | Asia Pacific |
| Largest Market | North America |
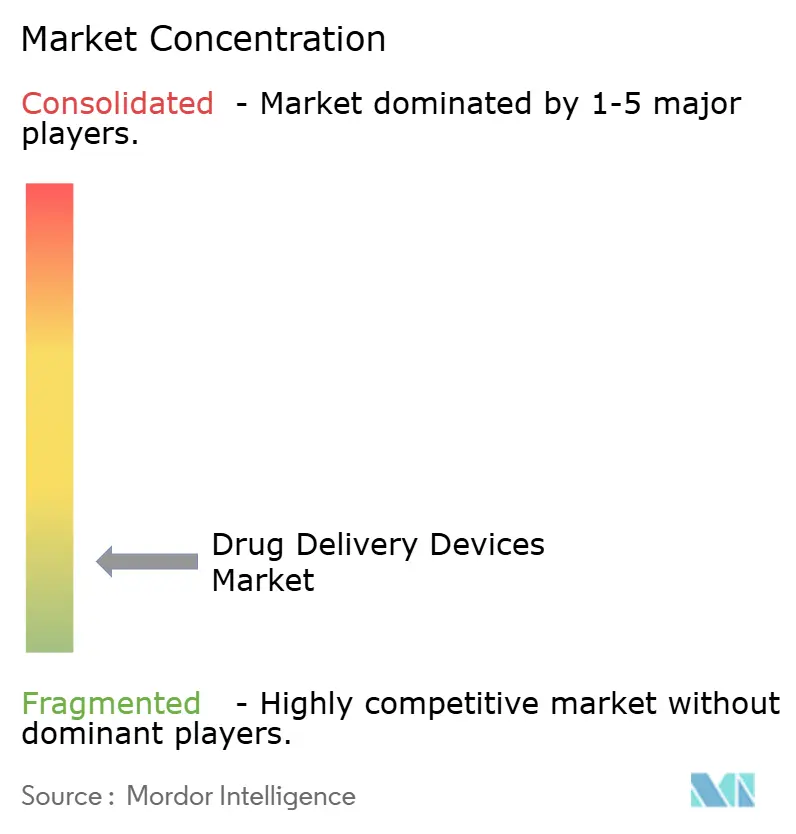
| Market Concentration | Low |
Major Players *Disclaimer: Major Players sorted in no particular order Image © Mordor Intelligence. Reuse requires attribution under CC BY 4.0. | |
Drug Delivery Devices Market Analysis by Mordor Intelligence
The Drug Delivery Devices Market size was valued at USD 136.35 billion in 2025 and is estimated to grow from USD 145.30 billion in 2026 to reach USD 209.40 billion by 2031, at a CAGR of 7.58% during the forecast period (2026-2031).
Three secular shifts underpin growth: chronic-disease management replacing episodic care, biologics demanding precise dosing and cold-chain stewardship, and payer mandates that shift therapy to lower-cost settings. Manufacturers are responding with self-administered formats that embed connectivity, human-factors engineering, and ESG-aligned materials. Competitive strategies now revolve around vertical integration of drug and device platforms, while opportunities emerge for suppliers that can ease regulatory friction and ensure supply resilience. Macroeconomic headwinds—glass shortages, cyber-security recalls, and reimbursement pressure—create volatility, yet they also open white-space for differentiated solutions that improve adherence and traceability, reinforcing momentum in the drug delivery devices market.
Key Report Takeaways
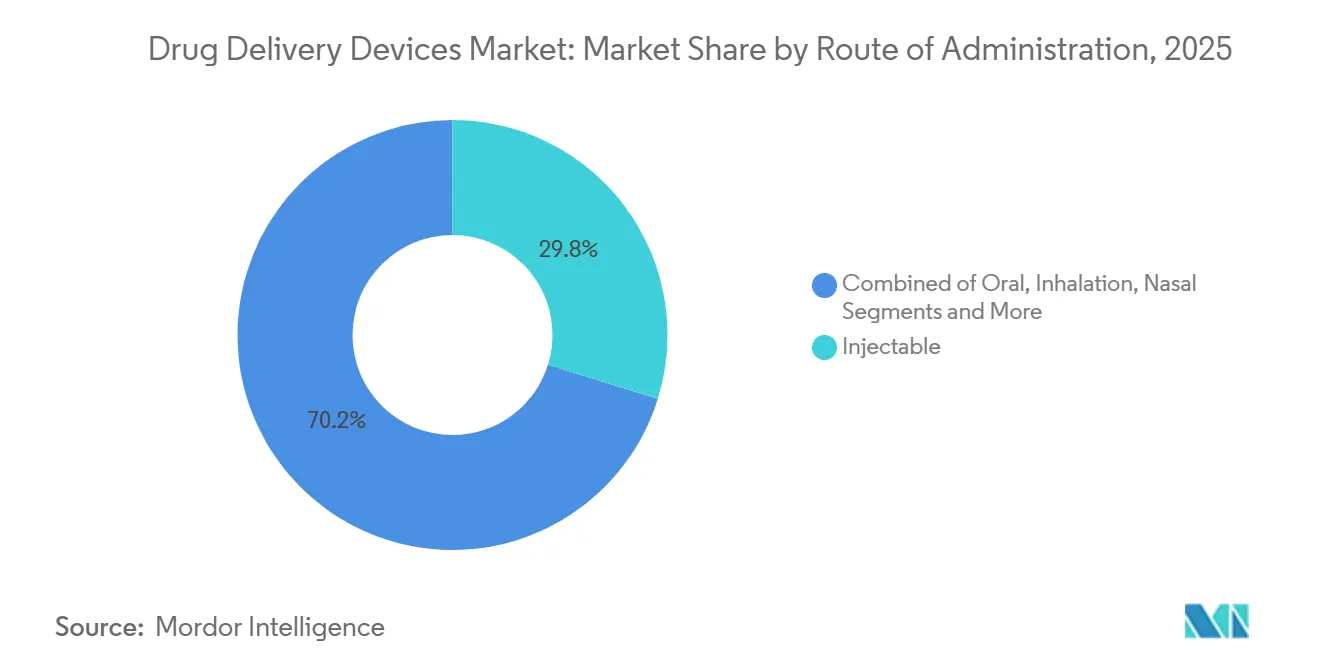
- By route of administration, injectables led with a 29.80% revenue share in 2025 and are expected to witness a CAGR of 8.35% over the forecast period.
- By device type, inhalers and nebulizers accounted for 22.10% of the drug delivery devices market share in 2025 and are expected to witness a CAGR of 6.12% over the forecast period.
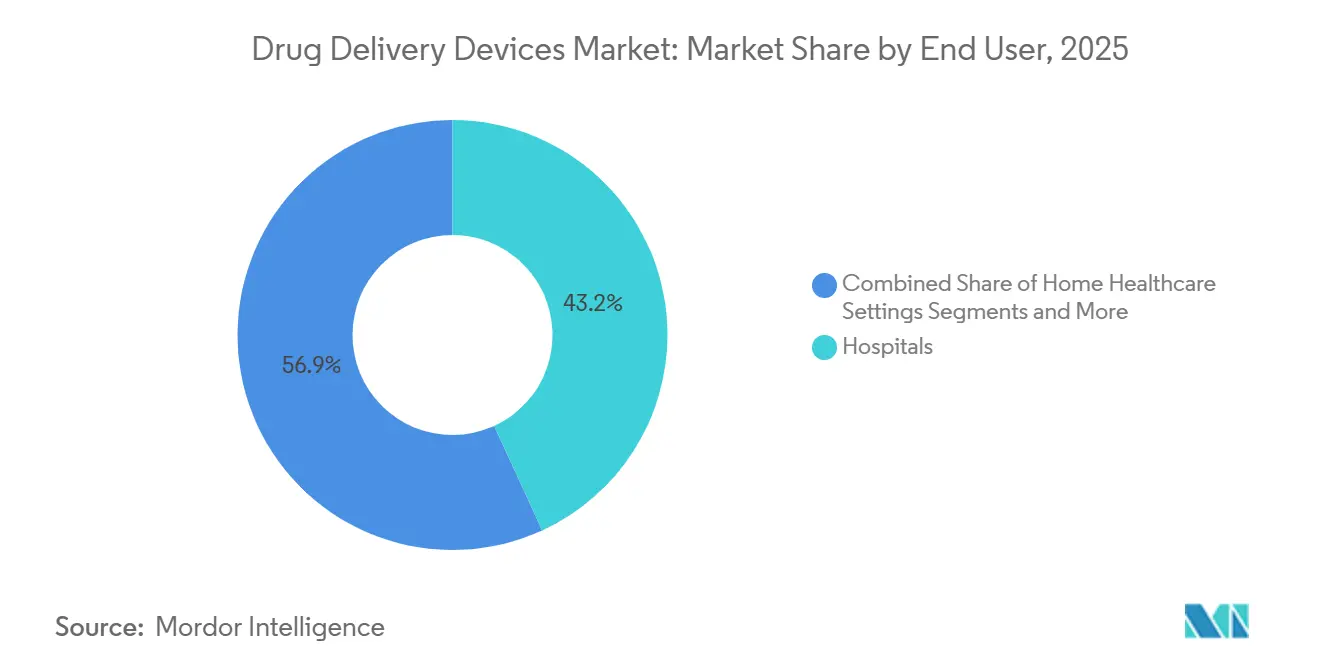
- By end user, hospitals accounted for 42.92% of demand in 2025 and are expected to grow at a CAGR of 6.98% over the forecast period.
- By therapeutic area, oncology accounted for 35.00% of revenue in 2025 and is expected to grow at a CAGR of 8.40% over the forecast period.
- By geography, North America accounted for 43.07% of sales in 2025 and is expected to grow at a CAGR of 6.87% over the forecast period.
Note: Market size and forecast figures in this report are generated using Mordor Intelligence’s proprietary estimation framework, updated with the latest available data and insights as of January 2026.
Global Drug Delivery Devices Market Trends and Insights
Drivers Impact Analysis*
| Driver | (~) % Impact on CAGR Forecast | Geographic Relevance | Impact Timeline |
|---|---|---|---|
| Rising chronic-disease burden | +1.2% | Global, highest in Asia-Pacific and North America | Long term (≥ 4 years) |
| Proliferation of biologics and biosimilars | +1.5% | North America and Europe core, Asia-Pacific spillover | Medium term (2-4 years) |
| Shift toward self-administration | +1.3% | North America and Europe leading, Asia-Pacific next | Medium term (2-4 years) |
| Smart and connected devices | +1.1% | North America and Europe, urban Asia-Pacific pockets | Short term (≤ 2 years) |
| Microneedle patch roll-outs | +0.6% | Sub-Saharan Africa, South Asia, Latin America | Long term (≥ 4 years) |
| ESG-driven switch to polymer syringes | +0.4% | Europe regulatory push, North America commitments | Medium term (2-4 years) |
| Source: Mordor Intelligence | |||
Rising Chronic-Disease Burden Fueling Long-Term Therapeutics
Non-communicable diseases caused 74% of global deaths in 2024, and their economic burden surpassed USD 7 trillion each year. Diabetes prevalence reached 537 million adults in 2024 and will likely rise to 643 million by 2030, with rapid growth in low- and middle-income countries.[1]International Diabetes Federation, “IDF Diabetes Atlas,” idf.org Such epidemiology guides drug makers toward maintenance therapies that require frequent administration over decades, creating steady demand in the drug delivery devices market. Health systems already spend 90% of the United States’ USD 3.8 trillion annual outlay on chronic-disease care, so payers support devices that cut emergency visits.[2]Centers for Disease Control and Prevention, “Chronic Disease in America,” cdc.gov As different disease clusters prefer distinct modalities, suppliers that offer diverse portfolios—prefilled syringes, transdermal patches, and implantable pumps—capture cross-indication opportunities.
Proliferation of Biologics & Biosimilars Needing Advanced Delivery
Biologics accounted for 30% of pharmaceutical sales in 2025 and are expanding roughly twice as fast as small molecules, propelled by oncology immunotherapies and monoclonal antibodies. Temperature sensitivity and aggregation risk elevate the role of prefilled syringes, autoinjectors, and pumps that assure dose accuracy. Biosimilars amplify device demand because regulators require comparable delivery systems to the originator, locking in device design and creating switching costs. Amgen demonstrates the downside of supply shocks; any syringe shortfall immediately erodes market share because alternative devices are not cross-approved. Device suppliers that can add hidden needles, lower injection force, or dose-confirmation cues gain formulary preference, widening opportunity in the drug delivery devices market.
Shift Toward Self-Administration & Home Healthcare Models
The COVID-19 pandemic accelerated decentralization, and by 2025 about 40% of injectable biologics in North America and Europe moved from clinics to patient homes. Reimbursement reforms cut per-episode costs up to 50% when therapy shifts out of hospitals. The FDA’s Home Healthcare Hub, launched in 2024, streamlines approvals for self-injection and wearables, shortening device launch timelines.[3]U.S. Food and Drug Administration, “Home Health Care Hub,” fda.gov Insulet’s Omnipod 5 generated USD 1.6 billion in 2025, underscoring that intuitive interfaces unlock mass adoption. Manufacturers now invest in multilingual labeling and remote monitoring, because liability migrates from clinicians to device firms when patients self-administer.
Smart / Connected Devices Improving Adherence & Traceability
More than 10 million connected drug delivery devices were active in 2025, transmitting dose data to cloud portals that clinicians and payers can audit. Novo Nordisk’s smart insulin pens cut hypoglycemic events by 18% in a 2024 trial, proving that data loops translate into better outcomes. Payers now link reimbursement to adherence data, which favors device makers that meet cyber-security norms. Draft FDA guidance in 2025 mandates encryption and vulnerability disclosure for connected devices. Serialization also curbs counterfeiting, enhancing supply-chain integrity and reinforcing adoption of smart platforms within the drug delivery devices market.
Restraints Impact Analysis*
| Restraint | (~) % Impact on CAGR Forecast | Geographic Relevance | Impact Timeline |
|---|---|---|---|
| Stringent sterility and compliance costs | -0.8% | Global, highest in North America and Europe | Short term (≤ 2 years) |
| High R&D and manufacturing capital intensity | -0.7% | Global, acute for emerging-market entrants | Medium term (2-4 years) |
| Cyber-security recalls of connected systems | -0.5% | North America and Europe, some Asia-Pacific incidents | Short term (≤ 2 years) |
| Specialty-glass supply bottlenecks | -0.4% | Global, acute in North America and Europe | Short term (≤ 2 years) |
| Source: Mordor Intelligence | |||
Stringent Sterility & Regulatory Compliance Costs
Combination products face dual oversight, extending approval cycles and multiplying validation studies. Sterility assurance for prefilled syringes may consume up to 24 months and USD 5 million per line. Twenty-three FDA warning letters in 2024 highlighted sterility lapses, even among incumbents. The EU Medical Device Regulation, fully enforced in 2024, forces manufacturers to re-certify legacy products and has stretched launches by nine months. Smaller firms struggle to fund these processes, which consolidates the drug delivery devices market around multinationals with deep compliance teams.
High R&D and Manufacturing Capital Intensity
Bringing an autoinjector from concept to market can cost USD 50-150 million, while greenfield syringe plants often exceed USD 200 million. Gerresheimer’s Peachtree City expansion required USD 300 million for 500 million units of annual capacity and took 30 months to build. Such thresholds deter new entrants and create switching costs for drug sponsors because re-validation is lengthy and expensive. Capital intensity therefore narrows supplier pools and slows innovation in new formats within the drug delivery devices industry.
*Our forecasts treat driver/restraint impacts as directional, not additive. The impact forecasts reflect baseline growth, mix effects, and variable interactions.
Segment Analysis
By Route of Administration: Transdermal Gains Momentum
The shift toward patches broadens patient access to hormone therapy and vaccines, reflecting users’ preference for painless administration. Inhalation remains essential for asthma and COPD, leveraging rapid pulmonary absorption and avoiding hepatically mediated degradation. Nasal delivery earned fresh awareness when the FDA cleared neffy epinephrine spray in 2024, introducing a needle-free anaphylaxis option.
Injectable routes dominate biologics and account for the bulk of cold-chain logistics. However, autoinjector adoption is cannibalizing vial-and-syringe formats because hidden needles and dose confirmation improve adherence. Ocular implants now reduce injection frequency for retinal diseases from monthly to semiannual, enhancing quality of life. Route selection has become a patient-centric exercise, rewarding device firms that validate real-world adherence benefits. As bioavailability data mature, the drug delivery devices market size linked to transdermal technologies is likely to expand further.


By Device Type: Smart Platforms Outpace Legacy Formats
Payors value adherence evidence, justifying the 20-30% unit premium for connected autoinjectors. Prefilled syringes underpin biologic launches because they ease regulatory filings, although autoinjectors capture share where dose frequency is high. Transdermal patches benefit from microneedle innovation, while drug-eluting stents face competitive pressure from bioresorbable scaffolds with improved long-term outcomes.
Implantable pumps fill ultra-niche needs such as intrathecal baclofen, yet reimbursement remains favorable due to hospitalization savings. Needle-free jet injectors and on-body pumps occupy an “emerging” category and are advancing through pivotal trials. Device-type competition intensifies as pharmaceutical firms debate whether to build in-house capabilities or license turnkey platforms from specialists like SHL Medical. Vertical integration can protect intellectual property but magnifies regulatory exposure. Strategic choices here will recalibrate the drug delivery devices market size associated with each platform.
By End User: Home Healthcare Reshapes Demand
Wearable injectors and subcutaneous pumps shift multi-hour infusions from oncology day wards into living rooms, reducing facility overhead. Ambulatory surgery centers operate as transitional hubs, starting therapy under supervision before patients move home. Device manufacturers now design interfaces for elderly users, with visual cues, audible clicks, and lockout mechanisms that lower training barriers.
Regulators support this transition with new reimbursement codes and streamlined approval pathways. Ypsomed’s YpsoMate incorporates real-time feedback that reassures users about dosing completion. Pharmaceutical sponsors bundle patient support apps, tele-nurse check-ins, and multilingual videos, reducing adverse events tied to misuse. As hybrid-care models flourish, the drug delivery devices market share attached to home settings will keep rising, particularly in value-based payment systems that reward reduced hospital readmissions.
By Therapeutic Area: Diabetes Devices Accelerate
Continuous glucose monitors now auto-populate dosing algorithms, simplifying self-management and lowering hypoglycemic risk. Auto-immune disorders, led by rheumatoid arthritis biologics, also propel autoinjector uptake owing to lifelong therapy requirements.
Cardiovascular applications rely heavily on drug-eluting stents, yet price compression and bundled payments dampen unit economics. Infectious-disease devices revert to steady-state demand post-pandemic, although microneedle flu and RSV patches remain attractive for seasonal campaigns. A broad tail of indications—from osteoporosis to multiple sclerosis—benefit from platform devices originally designed for blockbuster biologics. Cross-indication scalability supports steady expansion of the drug delivery devices market.
Geography Analysis
North America held 41.64% of global revenue in 2025, supported by premium pricing and Medicare policies that routinely expand coverage for connected devices. The FDA Breakthrough Devices Program also accelerates approvals, incentivizing early launches in the region. Canada benefits from U.S. spillover, while Mexican generics producers adopt advanced delivery systems to compete with imports. Growth is moderating as payers impose stricter cost-effectiveness thresholds, but the region remains the profit engine for the drug-delivery devices industry because unit prices are highest there.
Asia-Pacific is the fastest-growing region from 2026-2031, buoyed by China’s localization push and India’s biosimilar prowess. China approved 47 combination products in 2024 and offers tax credits for domestic production. Indian manufacturers collaborate with SHL Medical to develop pen injectors for emerging markets. Japan shifts toward value-based models that pay premiums for adherence data, creating pull for connected systems. Smaller economies such as South Korea and Australia serve as regulatory gateways to Southeast Asia, shortening go-to-market timelines.
Europe grows more slowly because reimbursement is fragmented and the Medical Device Regulation imposes heavy administrative loads. Germany, France, and the United Kingdom jointly contribute 60% of regional sales, with France’s health technology assessment body now demanding real-world evidence before granting premium prices. ESG mandates foster early adoption of polymer syringes, which boosts suppliers that can demonstrate decarbonization. In the Middle East, Gulf Cooperation Council countries buy premium devices backed by oil revenue. Sub-Saharan Africa remains underpenetrated, although Ghana’s microneedle vaccine pilots hint at leapfrog potential. South America is led by Brazil’s public system, which squeezes margins, while Argentina’s economic volatility stalls cold-chain investment. Regulatory harmonization across Mercosur could unlock scale, but timelines remain uncertain.

Competitive Landscape
The drug delivery devices market remains moderately concentrated. Becton Dickinson dominates glass prefilled syringes and safety needles, owning upstream glass capacity that insulates it from supply shocks. Gerresheimer and Stevanato compete in specialty cartridges and small-batch vials for gene therapies, chasing polymer alternatives that resist delamination. Novo Nordisk and Eli Lilly in-house pen injector lines blur drug-device boundaries, while West Pharmaceutical Services safeguards its moat with 23 smart-device patents filed in 2024.
Digital-health startups license sensor packages and analytics dashboards to incumbents, speeding time to market. Enable Injections and Catalent offer turnkey wearable injector services that let mid-tier pharma companies bypass internal device builds. Contract development organizations attract sponsors lacking device expertise, bundling human-factors design, regulatory submission, and supply chain management. Yet scale economies in molding, fill-finish, and quality systems still favor vertically integrated giants. Cyber-security competence now differentiates suppliers, as hospital procurement teams screen for vulnerability disclosures and patch management histories. The competitive chessboard will likely fragment at the periphery while consolidating around high-volume backbone products, sustaining churn within the drug delivery devices market.
Drug Delivery Devices Industry Leaders
Becton, Dickinson and Company
Gerresheimer AG
Medtronic plc
Baxter International Inc.
West Pharmaceutical Services, Inc.
- *Disclaimer: Major Players sorted in no particular order

Recent Industry Developments
- December 2025: Celltrion secured FDA approval for a 300 mg/2 mL prefilled syringe of Omlyclo, a biosimilar to Xolair.
- December 2025: Shilpa Medicare obtained its first European clearance for the Rotigotine transdermal patch.
- November 2025: Alembic Pharmaceuticals received FDA final approval for Sumatriptan Injection in single-dose autoinjector form.
- July 2025: GSK won FDA approval for a prefilled syringe of Shingrix, removing reconstitution steps for clinicians.


Research Methodology Framework and Report Scope
Market Definitions and Key Coverage
Our study defines the global drug delivery devices market as revenue from sales of mechanical, electronic, and smart hardware that place therapeutic substances into the body through injectable, inhalational, transdermal, implantable, ocular, nasal, or oral-mucosal routes. We cover syringes, pens, autoinjectors, infusion pumps, inhalers, nebulizers, transdermal patches, and implantable pumps sold to healthcare providers or directly to patients.
Scope Exclusion: services for drug formulation, wholesale drug trade, and stand-alone adherence apps are outside this boundary.
Segmentation Overview
- By Route of Administration
- Oral
- Injectable
- Inhalation
- Transdermal
- Nasal
- Ocular
- By Device Type
- Prefilled Syringes
- Auto-injectors
- Smart / Connected Devices
- Inhalers & Nebulizers
- Transdermal Patches
- Drug-eluting Stents
- Implantable Pumps
- Others
- By End User
- Hospitals
- Ambulatory Surgery Centers & Clinics
- Home Healthcare Settings
- Others
- By Therapeutic Area
- Oncology
- Diabetes
- Auto-immune Disorders
- Cardiovascular Diseases
- Infectious Diseases
- Others
- By Geography
- North America
- United States
- Canada
- Mexico
- Europe
- Germany
- United Kingdom
- France
- Italy
- Spain
- Rest of Europe
- Asia-Pacific
- China
- Japan
- India
- Australia
- South Korea
- Rest of Asia-Pacific
- Middle East & Africa
- GCC
- South Africa
- Rest of Middle East & Africa
- South America
- Brazil
- Argentina
- Rest of South America
- North America
Detailed Research Methodology and Data Validation
Primary Research
We spoke with device engineers, hospital buyers, endocrinologists, and respiratory therapists across North America, Europe, and Asia. Their insights on home-care hurdles, upgrade cycles, and regional discounts refined assumptions that desk work could not settle.
Desk Research
We began with public datasets from the WHO, UN Comtrade, Eurostat, and US FDA 510(k)/PMA logs that revealed shipment flows, approval timing, and recalls. Mordor analysts then mined Questel patent families, peer-reviewed journals, and 10-Ks to uncover price corridors and unit disclosures. News wires inside Dow Jones Factiva plus health-ministry yearbooks signaled short-term demand shifts. These references illustrate, not exhaust, the material we consulted.
A second pass reconciled import values with capacity announcements and hospital tenders, giving us workable average selling prices before primary outreach.
Market-Sizing & Forecasting
Our model starts top-down with treated patient pools, inhaler prescription counts, insulin shipments, and elective implant volumes, then applies route-specific penetration rates. Supplier roll-ups and sampled ASP × unit checks provide a bottom-up echo; gaps are smoothed iteratively. Key drivers, biologic approvals, home-infusion uptake, battery price curves, and reimbursement shifts feed a multivariate regression that projects value through 2030.
Data Validation & Update Cycle
Outputs are benchmarked against historic trade flows and independent hospital spend trackers; any variance triggers re-checks with earlier respondents. Reports refresh annually, with interim updates after major recalls or approvals.
Why Mordor's Drug Delivery Devices Baseline Earns Trust
Published figures diverge because researchers choose different device mixes, price ladders, and refresh cadences.
Our team fixes scope to hardware revenue, updates variables every twelve months, and converts currencies at spot rates, which keeps drift low. Common gaps elsewhere include bundling formulation turnover, extrapolating Western ASPs, or omitting mechanical devices.
Benchmark comparison
| Market Size | Anonymized source | Primary gap driver |
|---|---|---|
| USD 209.07 Bn (2025) | Mordor Intelligence | N/A |
| USD 432.4 Bn (2024) | Global Consultancy A | Includes formulations & packaging revenue |
| USD 1,888.52 Bn (2024) | Industry Data Firm B | Adds excipient sales; no regional ASP checks |
| USD 46.23 Bn (2024) | Regional Consultancy C | Focuses only on advanced electronic systems |
These contrasts show how our disciplined scope setting and dual-path modeling give decision-makers a balanced, transparent baseline traceable to clear, repeatable variables.


Key Questions Answered in the Report
How large is the drug delivery devices market in 2026?
The drug delivery devices market size is USD 237.94 billion in 2026 and is forecast to grow at a 7.13% CAGR to USD 335.71 billion by 2031.
Which device category is growing fastest?
Smart and connected platforms, including automated insulin pumps and Bluetooth-enabled injectors, are advancing at an 11.36% CAGR between 2026 and 2031.
Why are polymer syringes gaining attention?
Polymer formats reduce delamination risk, lower transport emissions by 30%, and meet new European sustainability mandates, making them attractive alternatives to glass.
What is driving Asia-Pacific growth?
Government incentives for domestic biologics manufacturing, rapid chronic-disease expansion, and rising adoption of self-administration devices push Asia-Pacific toward a 9.73% CAGR through 2031.
How are cyber-security risks being managed?
FDA guidance now requires encryption, software bills of materials, and vulnerability disclosure processes, while hospitals segment networks and suppliers issue over-the-air patches to maintain safety.
Which therapeutic area shows the fastest device demand?
Diabetes leads with a 9.04% CAGR as continuous glucose monitors integrate with automated insulin delivery systems, improving glycemic control and patient convenience.
Page last updated on:


