Market Overview
| Study Period | 2020 - 2031 |
|---|---|
| Forecast Data Period | 2026 - 2031 |
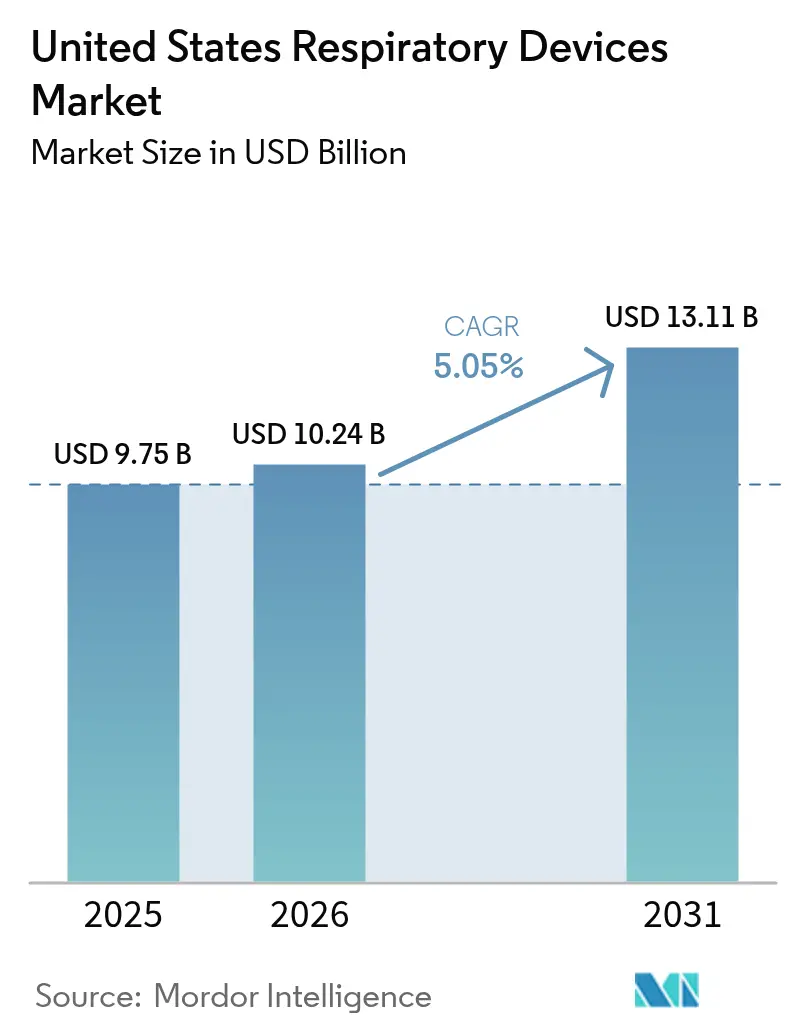
| Base Year Market Size (2025) | USD 9.75 Billion |
| Market Size (2026) | USD 10.24 Billion |
| Market Size (2031) | USD 13.11 Billion |
| Growth Rate (2026 - 2031) | 5.05% CAGR |
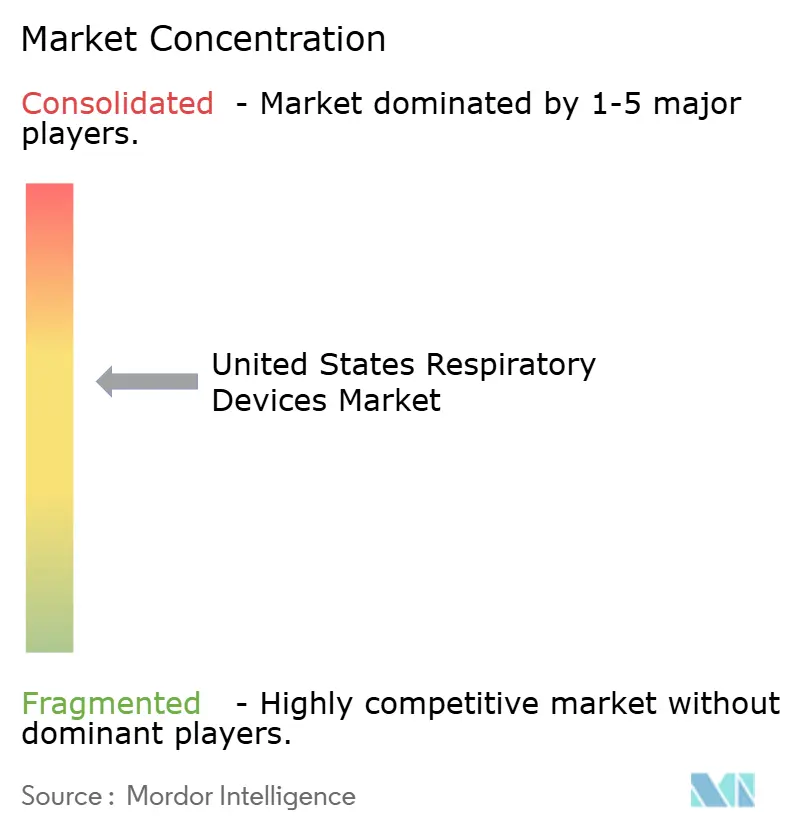
| Market Concentration | Medium |
Major Players *Disclaimer: Major Players sorted in no particular order Image © Mordor Intelligence. Reuse requires attribution under CC BY 4.0. | |
United States Respiratory Devices Market Analysis by Mordor Intelligence
The United States Respiratory Devices Market size was valued at USD 9.75 billion in 2025 and estimated to grow from USD 10.24 billion in 2026 to reach USD 13.11 billion by 2031, at a CAGR of 5.05% during the forecast period (2026-2031). Demand growth follows rising chronic respiratory disease prevalence, an aging population that prefers treatment at home, and the Centers for Medicare & Medicaid Services (CMS) widening reimbursement for home oxygen therapy and non-invasive ventilation. Intensifying wildfire seasons, particularly in western states, elevate consumer interest in air-purifying respiratory products, while artificial-intelligence (AI) algorithms embedded in diagnostic tools speed time-to-care and improve clinical accuracy. Concurrently, recall-driven quality scrutiny compels manufacturers to invest in safer materials and smarter sensors, sharpening the competitive focus on patient safety. Moderate industry consolidation persists as leading brands acquire digital-health start-ups to integrate hardware, software, and data analytics into unified care platforms.[1]Source: ResMed Inc., “Results for the Third Quarter of Fiscal Year 2025,” resmed.com
Key Report Takeaways
- By product type, therapeutic devices captured 46.10% revenue share of the United States respiratory devices market in 2025; diagnostic & monitoring devices are projected to grow at a 6.42% CAGR through 2031.
- By indication, chronic obstructive pulmonary disease (COPD) held 43.80% of the United States respiratory devices market size in 2025, whereas sleep apnea is forecast to expand at an 8.45% CAGR to 2031.
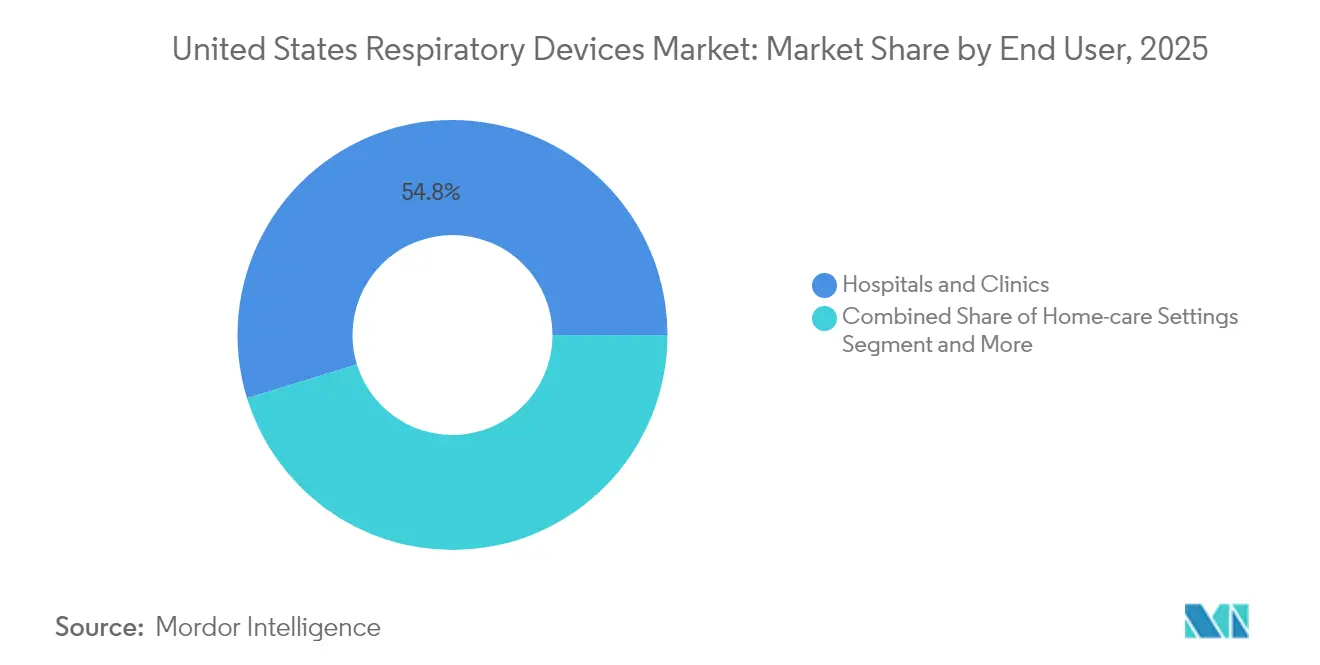
- By end user, hospitals and clinics accounted for 54.75% share of the United States respiratory devices market in 2025, while home-care settings record the fastest 7.45% CAGR through 2031.
- By region, the South commanded 31.95% of the United States respiratory devices market share in 2025; the West leads growth projections at an 7.90% CAGR to 2031.
Note: Market size and forecast figures in this report are generated using Mordor Intelligence’s proprietary estimation framework, updated with the latest available data and insights as of 2026.
United States Respiratory Devices Market Trends and Insights
Drivers Impact Analysis*
| Driver | (~) % Impact on CAGR Forecast | Geographic Relevance | Impact Timeline |
|---|---|---|---|
| Rising COPD & Asthma Prevalence Among U.S. Adults | +1.2% | National, with higher concentration in Southeast and Midwest | Long term (≥ 4 years) |
| Aging Demographics and Home-care Shift | +0.9% | National, with accelerated impact in Northeast and West | Medium term (2-4 years) |
| CMS Reimbursement Expansion for Home Oxygen Therapy & NIV | +0.8% | National, with immediate benefits in rural areas | Short term (≤ 2 years) |
| Uptake of Smart, Connected Respiratory Devices via Tele-health | +0.7% | National, with early adoption in West and Northeast | Medium term (2-4 years) |
| Growth of Ambulatory Surgical Centers Driving Portable Ventilation | +0.5% | National, with concentration in metropolitan areas | Medium term (2-4 years) |
| Wild-fire Smoke Episodes Elevating Home Airway-Care Demand | +0.4% | West and Southwest regions primarily | Short term (≤ 2 years) |
| Source: Mordor Intelligence | |||
Rising COPD & Asthma Prevalence Among U.S. Adults
COPD affects 12.5 million diagnosed adults and asthma affects 26.8 million Americans, with prevalence peaking in southeastern and midwestern counties.[2]Source: Centers for Disease Control and Prevention, “Adults Diagnosed with COPD by County,” cdc.gov State-level COPD rates vary from 3% in Hawaii to 12% in West Virginia, mirroring disparities in environmental exposures and healthcare access. COPD mortality spans 41–171 deaths per 100,000 adults, underscoring the ongoing therapeutic burden. These epidemiologic patterns fuel demand for nebulizers, oxygen concentrators, and digital inhalers capable of predicting exacerbations by monitoring inspiratory flow metrics. Annual direct and indirect asthma costs near USD 80 billion, intensifying payer interest in cost-effective home-based respiratory solutions.
Aging Demographics and Home-care Shift
Nearly one quarter of Americans will be 65 years or older by 2060, prompting a structural shift toward in-home therapy and remote patient monitoring. Medicare beneficiaries recorded over 240k COPD-related hospitalizations in recent times, amplifying the need for portable oxygen concentrators and home ventilators. Remote patient monitoring users already number about 50 million and are expected to double by the end of the decade as reimbursement aligns with value-based care incentives. The Patient-Driven Groupings Model increases operational complexity but rewards providers that demonstrate measurable outcome improvements using connected respiratory platforms. Long-term mechanical ventilation cases more than doubled over two decades, tightening capacity in post-acute facilities and driving investment in home-compatible ventilators.
CMS Reimbursement Expansion for Home Oxygen Therapy & NIV
New Healthcare Common Procedure Coding System (HCPCS) codes for multi-function respiratory devices effective January 2025 expand the eligible equipment roster and shorten payback periods for providers deploying advanced technology. While improper payment rates for CPAP accessories reached 15% in 2023, CMS has paired expanded coverage with stringent documentation audits to curb waste. The 2025 Physician Fee Schedule introduces a 2.93% reduction in average payment but preserves tele-health waivers that allow virtual evaluation of respiratory patients, sustaining hardware demand. Medicare Advantage plans must now include COPD and asthma in medication therapy management criteria, further broadening device access. The Home Health Value-Based Purchasing Model links reimbursement to outcome metrics, stimulating provider adoption of connected monitoring solutions that verify real-world efficacy.
Uptake of Smart, Connected Respiratory Devices via Tele-health
FDA clearance of AI-enabled lung sound analysis systems and home-use spirometers signals regulatory confidence in machine-learning diagnostics. ResMed’s NightOwl home sleep apnea test adds to a digital ecosystem that already serves 151 million patient lives through cloud-connected positive airway pressure (PAP) devices. Smart inhalers fitted with Bluetooth sensors deliver near-real-time adherence data and achieve up to 80% drug-delivery efficiency to the lungs, surpassing traditional inhalers. Wearable acoustic monitors in late-stage development will allow continuous assessment of trapped air and early detection of deterioration, and several have secured preliminary reimbursement codes ahead of full commercial launch. Emergency departments piloting AI scheduling tools report shorter waits for mechanical ventilation, illustrating downstream capacity gains from predictive device data.
Restraints Impact Analysis*
| Restraint | (~) % Impact on CAGR Forecast | Geographic Relevance | Impact Timeline |
|---|---|---|---|
| High Up-front Cost & Hospital Capital Budget Cycles | -0.8% | National, with greater impact in rural and community hospitals | Medium term (2-4 years) |
| Stringent FDA Approval Timelines | -0.6% | National, affecting all device categories | Long term (≥ 4 years) |
| Recalls & Safety Concerns Undermining Brand Trust | -0.5% | National, with concentrated impact on affected manufacturers | Short term (≤ 2 years) |
| Limited Awareness of Early Diagnosis | -0.4% | National, with higher impact in underserved communities | Long term (≥ 4 years) |
| Source: Mordor Intelligence | |||
High Up-front Cost & Hospital Capital Budget Cycles
Most U.S. hospitals allocate major equipment purchases once per fiscal year, extending replacement decisions 12–18 months and deferring acquisition of advanced ventilators and imaging-grade ultrasound devices. A 2.93% payment cut in the 2025 Physician Fee Schedule compresses operating margins, especially in rural facilities with thin cash reserves. Value-based reimbursement requires clear clinical-outcome evidence for capital requests, raising the bar for device makers to supply real-world data. Although COPD’s annual economic toll nears USD 50 billion, the longer payback period for sophisticated diagnostics can slow adoption, particularly where patient volumes are modest.[3]Source: American Lung Association, “National Indicator Report COPD,” lung.org Manufacturers offer leasing and per-use subscription models to mitigate sticker shock, but uptake remains mixed outside large health systems.
Stringent FDA Approval Timelines
Average 510(k) review cycles for complex respiratory devices exceed 180 days, lengthening time-to-market and raising development costs. Breakthrough-device designation offers an expedited path but demands rigorous clinical evidence, a hurdle small innovators may struggle to meet. Post-market surveillance obligations have tightened after high-profile recalls, compelling companies to allocate extra resources to longitudinal safety studies. While stronger oversight improves patient protection, it can delay commercialization of incremental innovations such as AI software updates embedded in existing hardware. Some firms have adopted modular regulatory strategies, securing clearance for core platforms first and layering software features under subsequent supplements.
*Our forecasts treat driver/restraint impacts as directional, not additive. The impact forecasts reflect baseline growth, mix effects, and variable interactions.
Segment Analysis
By Product Type: Therapeutic Dominance Amid Diagnostic Acceleration
Therapeutic devices commanded 46.10% of the 2025 United States respiratory devices market, anchored by positive airway pressure (PAP) systems and home ventilators that address both chronic and acute conditions. The installed base generates high-margin consumables demand, while AI-driven adherence algorithms elevate therapeutic efficacy. Diagnostic & monitoring devices remain the fastest-growing category at a 6.42% CAGR through 2031 as FDA-cleared home-use spirometers and AI auscultation software migrate testing from clinics to living rooms. Disposables retain steady uptake because masks, filters, and breathing circuits require periodic replacement, ensuring recurring revenue.
A key growth inflection stems from vibrating mesh nebulizers that deliver superior deposition in COPD therapy, prompting formulary inclusion by major payers. Portable oxygen concentrators integrate cloud connectivity, allowing clinicians to titrate flow remotely and aligning with home-care trends. Diagnostic smart patches that track respiratory rate and sleep motion shorten sleep–apnea diagnosis cycles. Combined, these factors add incremental value to the United States respiratory devices market size while intensifying competition around data-driven user experiences.


By Indication: COPD Scale Meets Sleep-Apnea Momentum
COPD represented 43.80% of the United States respiratory devices market size in 2025, as 12.5 million adults required ongoing ventilatory support, nebulization, and oxygen therapy. Hospitalizations among Medicare beneficiaries reinforce device turnover in institutional settings and extend demand into skilled nursing facilities. Sleep apnea is accelerating at an 8.45% CAGR to 2031, propelled by insurer acceptance of home sleep tests and strong evidence that CPAP therapy lowers all-cause mortality. Asthma, with an 8.2% prevalence, continues to drive inhaler and peak-flow meter volume, especially for pediatric care.
Infectious respiratory diseases temporarily lifted ventilator utilization during COVID-19 surges, normalizing at higher baseline levels than pre-pandemic as hospitals maintain contingency stock. Other disorders—including bronchiectasis and neuromuscular-related hypoventilation—contribute a niche but stable demand for airway-clearance devices and volume-guaranteed ventilators. Precise segmentation allows suppliers to tailor accessories, such as specialized masks for the pediatric sleep-apnea cohort, thereby expanding the addressable share without cannibalizing core COPD revenue.
By End User: Home-care Momentum Reshapes Distribution
Hospitals and clinics held 54.75% of United States respiratory devices market share in 2025 courtesy of critical-care ventilator fleets, pulmonary function labs, and anesthesia departments. Yet home-care settings register the highest 7.45% CAGR as payers steer chronic-disease management away from costly inpatient environments. Remote patient monitoring platforms feed continuous flow, saturation, and usage data directly into electronic health records, supporting value-based reimbursement triggers. Ambulatory surgical centers prefer compact ventilators that integrate capnography to streamline outpatient sedation workflows, mirroring the broader shift toward minimally invasive procedures.
Long-term-care facilities increase procurement of pressure-support ventilators and suction units as the number of patients needing prolonged respiratory assistance climbs. Emergency and trauma centers diversify inventory with high-flow nasal oxygen systems and portable ECMO readiness kits to buffer against mass-casualty respiratory events. Collectively, these dynamics realign distribution networks, prompting manufacturers to strike partnerships with durable-medical-equipment suppliers to reach patients wherever they receive care
Geography Analysis
The South led with 31.95% of the United States respiratory devices market in 2025, reflecting elevated COPD prevalence that peaks at 12% in West Virginia compared with 3% in Hawaii. High air-conditioning use elevates indoor humidity control needs, influencing the selection of dehumidifying oxygen concentrators. The region’s robust hospital networks and sizable long-term-care footprint underpin replacement cycles for ventilators and suction gear.
The West posts the strongest 7.90% CAGR to 2031 as wildfire smoke drives consumer adoption of HEPA-equipped respiratory devices and as technology-forward health systems embrace AI-enabled home diagnostics. Indoor air-filtration can halve particulate exposure during smoke events, encouraging insurers to underwrite purifiers for high-risk members. Tech hubs in California and Washington foster early trials of connected inhalers and acoustic wearables, accelerating commercial uptake.
The Northeast benefits from higher per-capita healthcare spending and early adoption of digital-health solutions; academic medical centers there often pioneer AI respiratory algorithms. The Midwest balances industrial air-quality challenges with agricultural dust exposure, sustaining steady device replacement demand. Meanwhile, the Southwest faces dust-storm respiratory risks that raise filtration and nebulizer purchases among vulnerable groups. Across all regions, CMS reimbursement for home oxygen and non-invasive ventilation narrows rural–urban gaps, allowing patients in remote counties to access advanced devices without traveling long distances for care.
Competitive Landscape
Industry concentration is moderate. ResMed leads with a cloud-connected PAP ecosystem that delivered USD 1.3 billion in quarterly revenue, reinvested at 7% of sales into R&D. Philips pursues remediation of recall-affected inventory while collaborating with Medtronic on next-generation patient-monitoring technology. Fisher & Paykel Healthcare leverages an expanding patent portfolio around low-pressure nasal interfaces to differentiate on comfort and adherence.
Strategic acquisitions accelerate portfolio diversification: Owens & Minor’s USD 1.36 billion purchase of Rotech Healthcare deepens distribution in the home-respiratory channel. Medtronic’s divestiture of its traditional ventilator line freed capital to double down on sensor-rich monitors that feed predictive analytics dashboards.
Start-ups focusing on AI auscultation and wearable acoustic monitoring secure minority investments from incumbents seeking early-stage optionality. The competitive frontier thus shifts from standalone hardware toward full-stack respiratory-care platforms that combine devices, software, and wrap-around services.
United States Respiratory Devices Industry Leaders
Fisher & Paykel Healthcare Ltd
ResMed
Koninklijke Philips N.V.
Drägerwerk AG
GE HealthCare
- *Disclaimer: Major Players sorted in no particular order

Recent Industry Developments
- January 2025: ResMed announced national availability of its FDA-cleared NightOwl home sleep-apnea test across the United States.
- December 2024: Movano Health secured FDA clearance for the pulse-oximetry feature of its EvieMED smart ring.
- September 2024: The FDA cleared Sleep Rx, the first contactless sleep-apnea diagnostic device using a pneumatic sensor array.
- August 2024: Huxley Medical received 510(k) clearance for SANSA, a chest-worn sleep-apnea diagnostic patch.


United States Respiratory Devices Market Report Scope
As per the scope of the report, Respiratory devices include respiratory diagnostic and monitoring devices, therapeutic devices, and disposables for administering long-term artificial respiration. The United States Respiratory Devices Market is segmented By Type (Diagnostic and Monitoring Devices (Spirometers, Sleep Test Devices, Peak Flow Meters, Pulse Oximeters, Capnographs, Other Diagnostic and Monitoring Devices), Therapeutic Devices (CPAP Devices, BiPAP Devices, Humidifiers, Nebulizers, Oxygen Concentrators, Ventilators, Inhalers, Other Therapeutic Devices), and Disposables (Masks, Breathing Circuits, Other Disposables). The report offers the value (in USD million) for the above segments.
By Product Type
| Diagnostic & Monitoring Devices | Spirometers |
| Sleep Test Devices | |
| Peak Flow Meters | |
| Pulse Oximeters | |
| Capnographs | |
| Other Diagnostic & Monitoring Devices | |
| Therapeutic Devices | CPAP Devices |
| BiPAP Devices | |
| Humidifiers | |
| Nebulizers | |
| Oxygen Concentrators | |
| Ventilators (Invasive, Non-invasive) | |
| Inhalers (MDI, DPI, Soft-Mist) | |
| Other Therapeutic Devices | |
| Disposables | Masks (CPAP, Oxygen, Nebulizer) |
| Breathing Circuits | |
| Filters & Cannulas | |
| Other Disposables |
By Indication
| COPD |
| Asthma |
| Sleep Apnea |
| Infectious Diseases |
| Other Respiratory Disorders |
By End User
| Hospitals & Clinics |
| Home-care Settings |
| Ambulatory Surgical Centers |
| Emergency & Trauma Centers |
| Long-Term Care Facilities |
By Region
| Northeast |
| Midwest |
| Southeast |
| West |
| Southwest |
| By Product Type | Diagnostic & Monitoring Devices | Spirometers |
| Sleep Test Devices | ||
| Peak Flow Meters | ||
| Pulse Oximeters | ||
| Capnographs | ||
| Other Diagnostic & Monitoring Devices | ||
| Therapeutic Devices | CPAP Devices | |
| BiPAP Devices | ||
| Humidifiers | ||
| Nebulizers | ||
| Oxygen Concentrators | ||
| Ventilators (Invasive, Non-invasive) | ||
| Inhalers (MDI, DPI, Soft-Mist) | ||
| Other Therapeutic Devices | ||
| Disposables | Masks (CPAP, Oxygen, Nebulizer) | |
| Breathing Circuits | ||
| Filters & Cannulas | ||
| Other Disposables | ||
| By Indication | COPD | |
| Asthma | ||
| Sleep Apnea | ||
| Infectious Diseases | ||
| Other Respiratory Disorders | ||
| By End User | Hospitals & Clinics | |
| Home-care Settings | ||
| Ambulatory Surgical Centers | ||
| Emergency & Trauma Centers | ||
| Long-Term Care Facilities | ||
| By Region | Northeast | |
| Midwest | ||
| Southeast | ||
| West | ||
| Southwest | ||


Key Questions Answered in the Report
How large is the United States respiratory devices market in 2026?
The United States respiratory devices market size is USD 10.24 billion in 2026 and is projected to reach USD 13.11 billion by 2031.
Which product category generates the most revenue?
Therapeutic devices account for 46.10% of 2025 revenue, led by CPAP and BiPAP systems.
Which indication is growing fastest?
Sleep apnea is expanding at an 8.45% CAGR through 2031 due to greater home-test availability and payer coverage for CPAP therapy.
Why is the West region the fastest-growing geography?
Wildfire-related air-quality events and early adoption of connected health technologies drive an 7.90% CAGR in the West.
What factor most constrains hospital device purchasing?
High up-front capital costs combined with tighter CMS reimbursement slow procurement cycles, especially in rural hospitals.
How are recalls affecting market dynamics?
Large-scale recalls have shifted brand loyalty and prompted providers to scrutinize device safety history before purchase, opening doors for competitors with stronger quality records.
Page last updated on:


