Market Overview
| Study Period | 2019 - 2030 |
|---|---|
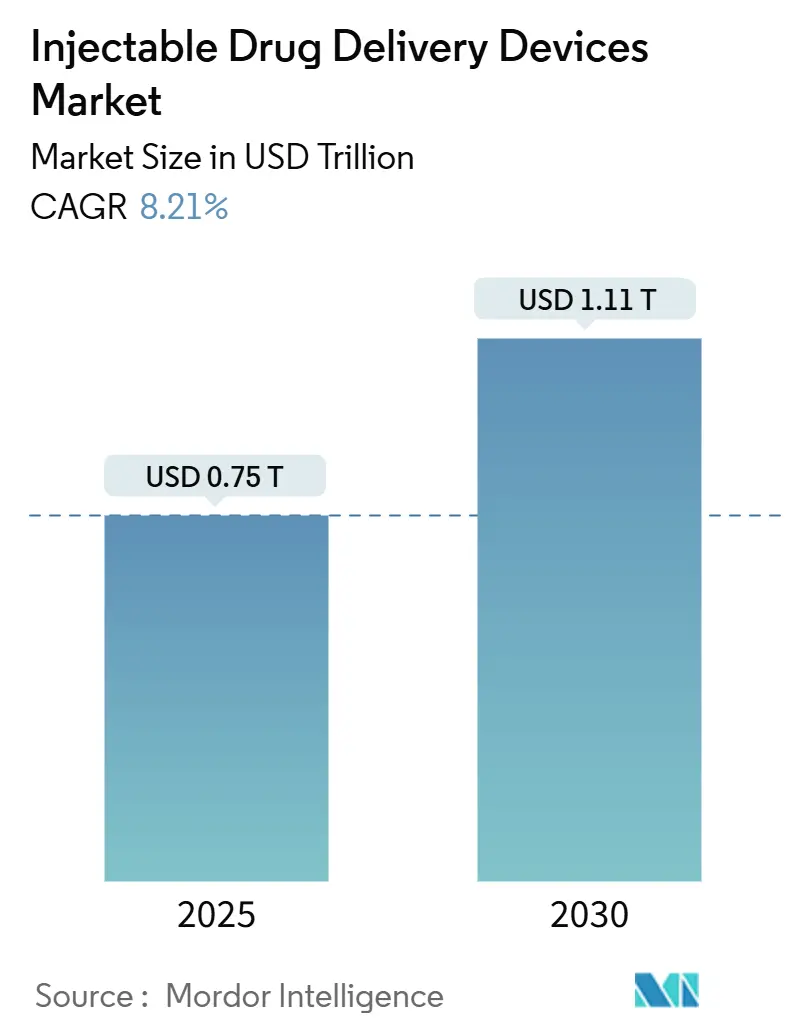
| Market Size (2025) | USD 0.75 Trillion |
| Market Size (2030) | USD 1.11 Trillion |
| Growth Rate (2025 - 2030) | 8.21% CAGR |
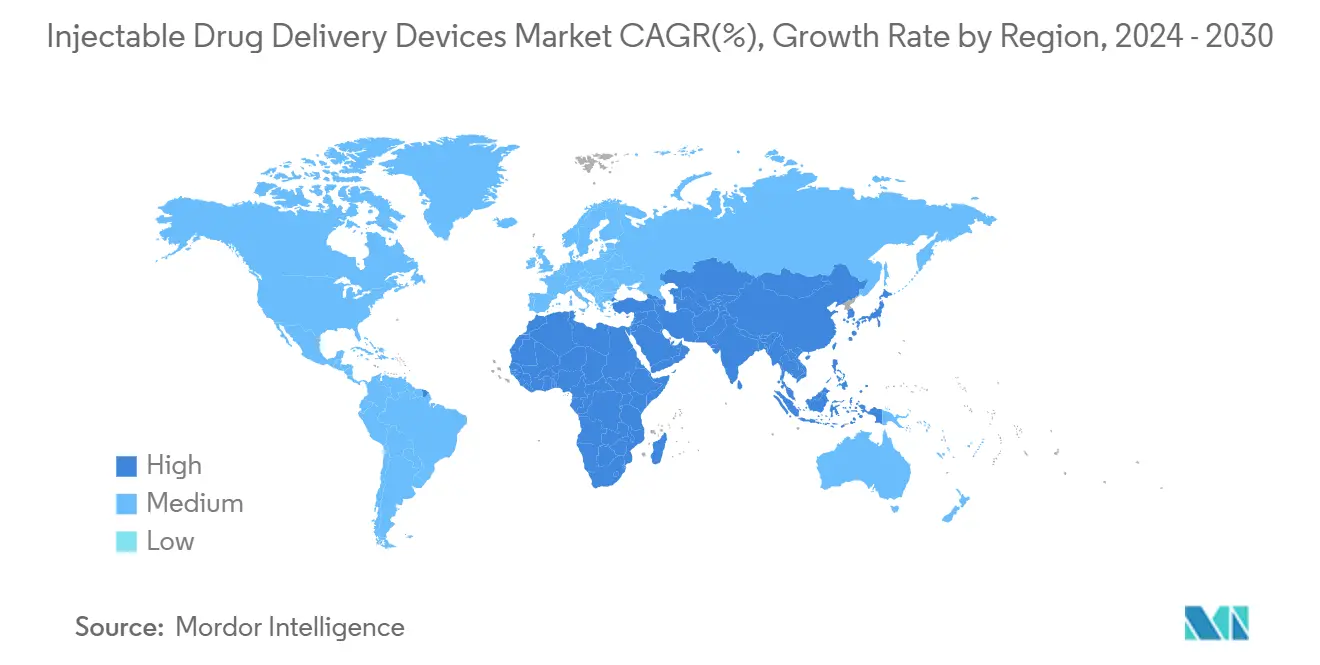
| Fastest Growing Market | Asia Pacific |
| Largest Market | North America |
| Market Concentration | Medium |
Major Players *Disclaimer: Major Players sorted in no particular order Image © Mordor Intelligence. Reuse requires attribution under CC BY 4.0. | |
Injectable Drug Delivery Devices Market Analysis by Mordor Intelligence
The injectable drug delivery devices market is valued at USD 748.99 billion in 2025 and is forecast to expand to USD 1,111.05 billion in 2030, reflecting an 8.21% CAGR. Robust growth comes from three structural shifts: a larger biologics pipeline demanding parenteral formats, a clear move from hospital-based care to self-administration at home, and rapid digitalisation of devices that strengthen adherence and data capture. Pharmaceutical firms now embed delivery planning early in drug development because the correct platform shortens time-to-peak sales and reduces payer friction. Investment in connected injectors is also rising as payers link reimbursement to real-world outcomes. On the competitive front, patent-protected smart wearables, polymer prefilled formats, and device-centric service bundles are creating new barriers to entry while widening collaboration between drug sponsors and specialist device makers.
Key Take Aways
- By device type, prefilled syringes led with 35.90% revenue share in 2024; wearable injectors are projected to advance at an 11.77% CAGR through 2030.
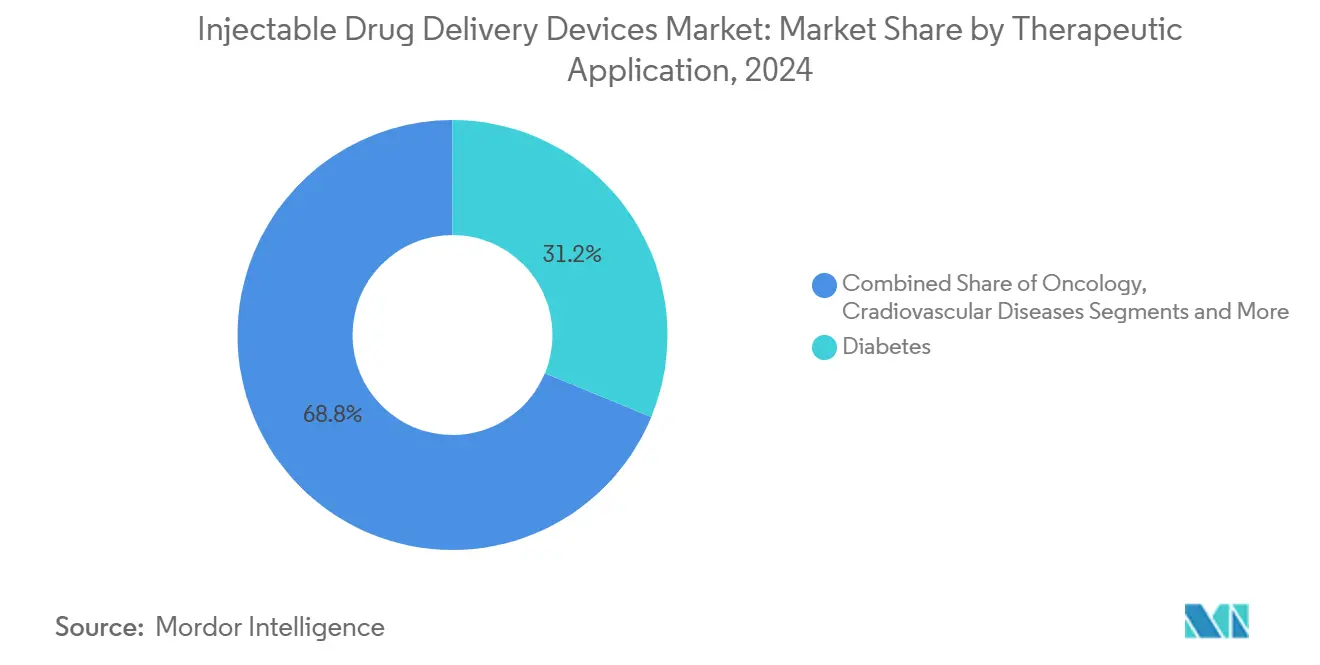
- By therapeutic application, diabetes accounted for 31.23% of the injectable drug delivery devices market share in 2024, whereas oncology is expanding at an 11.47% CAGR to 2030.
- By usability, disposable injectors dominated with 48.56% revenue share in 2024 and are forecast to grow at a 9.23% CAGR through 2030.
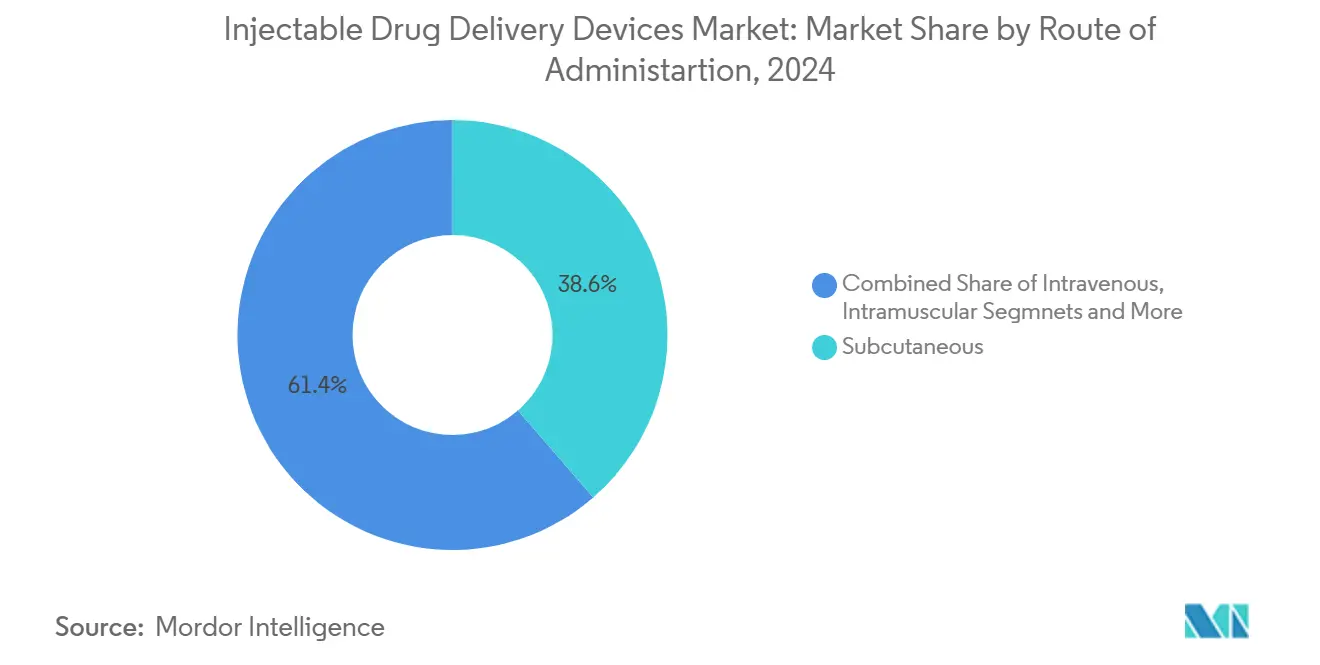
- By route of administration, subcutaneous delivery held 38.64% share in 2024, while intravenous delivery is projected to expand at an 8.78% CAGR through 2030.
- By end user, hospitals and ambulatory surgical centres held 45.07% of the injectable drug delivery devices market size in 2024, while home-care is set to grow fastest at 10.30% CAGR over 2025-2030.
- By geography, North America led with 42.63% share in 2024; Asia-Pacific is forecast to post the highest 9.30% CAGR through 2030.
Global Injectable Drug Delivery Devices Market Trends and Insights
Driver Impact Analysis*
| Driver | (~) % Impact on CAGR Forecast | Geographic Relevance | Impact Timeline |
|---|---|---|---|
| Rising popularity of self-administration supported by digital adherence aids | +2.1% | Global, early uptake in North America and Europe | Medium term (2-4 years) |
| Expansion of large-molecule biologics pipeline requiring parenteral delivery | +1.8% | Global, strongest in developed markets | Long term (≥ 4 years) |
| Shift of care from hospital to home driving demand for wearable injectors | +1.5% | North America, Europe, developed APAC | Medium term (2-4 years) |
| High burden of chronic diseases | +1.7% | Global, amplified in ageing societies | Long term (≥ 4 years) |
| Development of advanced technology injectable devices | +1.2% | North America, Europe, Japan | Medium term (2-4 years) |
| Escalating global vaccination initiatives | +1.1% | Global, larger influence in emerging markets | Short term (≤ 2 years) |
| Source: Mordor Intelligence | |||
Rising popularity of self-administration supported by digital adherence aids
Smart connected injectors now track dosing, push reminders, and sync data with care teams, lifting adherence by up to 32% and cutting clinic visits by 41%. Home use reduces hospitalisation in chronic disease management by as much as 30%, which appeals to payers. Early movers such as Enable Injections have shown that convenient hands-free wearables improve persistence without sacrificing drug stability. Technology costs are falling, broadening uptake beyond premium biologics. As a result, the injectable drug delivery devices market gains incremental volume while shifting revenue mixes toward value-added software and data services.
Expansion of large-molecule biologics pipeline requiring parenteral delivery
Seven of the ten top-selling medicines in 2024 were biologics delivered by injection, and forecasts see nine of ten by 2029 with a combined pipeline value of USD 168 billion. Viscous monoclonal antibodies and antibody-drug conjugates need larger-volume or on-body devices, fuelling innovation in materials and drive mechanisms. Because delivery choice now influences formulary access, drug sponsors are partnering early with device specialists to co-develop turnkey platforms, thereby increasing switching costs for competitors and extending product life cycles.
Shift of care from hospital to home driving demand for wearable injectors
Healthcare systems target cost reductions of 15-30% when therapies migrate to patient homes, and wearable injectors facilitate that transition for oncology and immunology drugs. These devices handle volumes once limited to IV infusions, letting payers avoid chair time and infusion-centre overhead. Patient preference data show higher satisfaction with home dosing, reinforcing uptake trends. Consequently, the injectable drug delivery devices market sees faster volume growth in on-body segment lines and rising aftermarket revenue from disposables and software licences.
High burden of chronic diseases
The International Diabetes Federation counts 588.7 million adults living with diabetes in 2024, trending to 852.5 million by 2050.[1]International Diabetes Federation, “IDF Diabetes Atlas 2025,” idf.orgDiabetes already drives 31.23% of demand, and combined oncology, autoimmune, and lipid disorders expand at 9-11% CAGR, sustaining high device volume. Self-injection platforms lower annual U.S. healthcare costs by USD 12-15 billion through fewer clinic visits.[2]U.S. Food and Drug Administration, “Essential Drug Delivery Outputs for Devices Intended to Deliver Drugs and Biological Products,” fda.gov Device makers respond with combination products that bind a drug franchise to a proprietary injector, keeping value inside the licence term and deterring generic erosion.
Restraint Impact Analysis*
| Restraint | (~) % Impact on CAGR Forecast | Geographic Relevance | Impact Timeline |
|---|---|---|---|
| Risk of infections and other complications for usage | -1.2% | Global, higher in emerging markets | Short term (≤ 2 years) |
| Stringent regulatory requirements | -0.9% | North America and Europe | Medium term (2-4 years) |
| Availability of alternative drug delivery methods | -0.7% | Developed markets | Long term (≥ 4 years) |
| Price volatility and periodic shortages of medical-grade cyclic-olefin polymers and borosilicate glass | -0.8% | Global, stronger where manufacturing capacity is limited | Medium term (2-4 years) |
| Source: Mordor Intelligence | |||
Risk of infections and other complications for usage
Healthcare workers still report 385,000 sharps injuries per year in the United States. Wearable injectors show complication rates of 5-8% owing to skin reactions, prompting regulators to demand post-market surveillance. Device firms now dedicate USD 1.2 billion annually to safety innovation, with antimicrobial coatings and needle-free prototypes aimed at mitigating these risks.
Stringent regulatory requirements
The FDA’s 2024 rule on laboratory-developed tests increases documentation and compliance costs for combination products, extending development timelines by up to 18 months.[3]U.S. Federal Register, “Hospital Outpatient Prospective Payment System Final Rule,” federalregister.gov EU Medical Device Regulation adds divergent demands, pushing global launch costs higher and squeezing smaller innovators. Harmonisation initiatives exist but move slowly, keeping this restraint relevant through the medium term.
*Our forecasts treat driver/restraint impacts as directional, not additive. The impact forecasts reflect baseline growth, mix effects, and variable interactions.
Segment Analysis
By Device Type: Prefilled dominance meets fast-rising wearables
Prefilled formats account for 35.90% of the injectable drug delivery devices market in 2024, driven by versatility across therapy classes and a 60% error-reduction advantage over vial-and-syringe systems. Glass is gradually ceding share to cyclic olefin polymers that resist breakage and minimise silicone-oil interactions, traits valued in oncology and autoimmune biologics. Unit demand flexes upward as biosimilars widen patient access. The shift to polymers also eases manufacturing scale-up due to lower break rates during fill-finish operations. Wearable injectors, though smaller in 2024, are scaling at an 11.77% CAGR. These on-body systems handle high-viscosity formulations and volumes up to 20 mL, allowing subcutaneous dosing of drugs once limited to intravenous infusion. Connectivity modules record time-stamped adherence data, opening pay-for-performance contracts.
The competitive battleground turns on human-factors engineering. Companies showcase intuitive presses, audible clicks, or tactile feedback that confirm dose completion. Smart variants log dosing events and integrate with electronic health records, creating data assets that fortify payer negotiations. Tailored wearables tied to single-drug licences tighten ecosystem control, keeping users inside the original brand and extending life-cycle revenue. Collectively, these dynamics keep the injectable drug delivery devices market expanding even as alternative routes arise.
By Therapeutic Application: Chronic disease anchors, oncology accelerates
Diabetes commands 31.23% of 2024 revenue as injectable insulin and GLP-1 receptor agonists remain core to glycaemic control. Emerging hydrogel depots could reduce injection frequency to quarterly, boosting adherence and broadening global uptake.[4]Stanford University School of Medicine, “Injectable Hydrogel Depot Extends GLP-1 Activity,” stanford.edu Obesity indications further lift volume as semaglutide prescriptions climb. Oncology, registering an 11.47% CAGR, benefits from a swelling pipeline of monoclonal antibodies and antibody-drug conjugates. Subcutaneous reformulations shorten clinic dwell times and improve patient quality of life, reinforcing the growth arc of the injectable drug delivery devices market size in this segment.
Autoimmune conditions such as rheumatoid arthritis follow closely, as injectable biologics shift from hospital to home. Long-acting antivirals like injectable lenacapavir are poised to transform HIV prevention by condensing daily pills into twice-yearly shots. Cardiology’s resurgence pivots on lipid-lowering PCSK9 inhibitors administered every two to four weeks, offering alternatives for statin-intolerant patients. This breadth supports steady device utilisation even as individual therapy areas fluctuate.


By Usability: Disposable convenience faces reusable sustainability
Disposable injectors dominate with 48.56% revenue share in 2024 because they lower infection risk and remove cleaning steps, factors critical in large-scale vaccination and acute care. Mass production has driven unit costs down, establishing a price point acceptable for single-use deployment across chronic conditions. The environmental footprint, however, draws scrutiny: roughly 16 billion disposables enter medical waste streams each year. Regulators and payers in Europe now consider full-life-cycle costs, nudging procurement toward greener options.
Reusable systems gain traction as sustainability mandates tighten. Modern designs feature cartridge autoloading and auto-retract needles, making them as user-friendly as disposables. While upfront capital is higher, long-run per-dose cost falls, which suits chronic therapy regimens. Digital sensors embedded in reusable handles track lifetime use, delivering signals when maintenance or part replacement is due, thus reducing device failure risk. Growing climate commitments suggest reuse will capture an incremental share, supporting diversification of the injectable drug delivery devices market.
By Route of Administration: Subcutaneous shift reshapes delivery
Subcutaneous (SC) delivery steadily outpaces intravenous (IV) alternatives because it combines patient comfort with compatibility for self-administration, holding a 38.64% share in 2024. Reformulation of IV monoclonal antibodies into SC variants eliminates infusion chairs and broadens access in resource-limited locations. Recombinant human hyaluronidase enhances SC absorption and enables larger doses. Needle-free jet technology also shows promise by mitigating pain and sharps waste.
Intramuscular (IM) delivery retains primacy in vaccine programmes owing to predictable absorption and simple technique—attributes reinforced during global COVID-19 campaigns. Innovations such as ultra-thin-wall needles reduce dead space and save up to 20% in vaccine volume per vial. IV delivery remains irreplaceable in emergencies that demand rapid systemic exposure, but its share of the injectable drug delivery devices market is gradually narrowing as alternative routes mature.
By End User: Institutional heft and home-care rise
Hospitals and ambulatory surgical centres secured 45.07% of injectable drug delivery devices market size in 2024 because they manage complex biologics, deliver rapid-response therapies, and satisfy traceability requirements. Value-based payment models encourage shorter inpatient stays, yet institutions remain essential for initiation of high-risk treatments. They also serve as training hubs that prepare patients for home use, thereby sustaining device demand.
Home-care settings, posting a 10.30% CAGR, rise on the back of telehealth, payer incentives, and consumer preference for comfort. Connected injectors allow clinicians to monitor adherence remotely, intervening when deviations appear. Specialty clinics occupy the middle ground, offering disease-focused expertise while adopting advanced injectors that align with outpatient workflows. Together these end users keep device volumes high and diversify revenue streams within the injectable drug delivery devices market.
Geography Analysis
North America holds 42.63% of global revenue in 2024, supported by robust reimbursement, strong device R&D, and the FDA’s approval of 50 novel drugs that mostly require advanced delivery. Recent CMS payment rules add a 2.9% rate increase for eligible devices, further lifting uptake. Investment momentum is visible in Novo Nordisk’s acquisition of three fill-finish plants to secure GLP-1 capacity. These moves confirm sustained leadership in the injectable drug delivery devices market.
Europe sits second by revenue, distinguished by sustainability mandates that accelerate shift toward reusable injectors and low-carbon materials. Implementation of the EU Medical Device Regulation strengthens quality assurance but lengthens launch timelines. The European Medicines Agency will make shortage reporting on its central platform mandatory from February 2025, heightening supply-chain transparency. The United Kingdom and Germany spearhead growth, aided by strong diabetes technology adoption.
Asia-Pacific is the fastest-growing region at 9.30% CAGR through 2030. Prevalence of diabetes and cardiovascular disease escalates with urbanisation and ageing. China and India channel policy incentives into domestic biologics and injector manufacture, shifting the competitive centre of gravity eastward. Japan capitalises on precision engineering to supply premium wearables. Regional private insurance expansion widens patient access to higher-priced connected devices, reinforcing momentum in the injectable drug delivery devices market.

Competitive Landscape
The top ten suppliers capture more than half of revenue, giving the sector a moderate concentration profile. Leaders combine drug-device integration, regulatory depth, and scale production of polymer and glass containers. Mid-tier contenders carve out niches in microneedle patches, needle-free jets, and digital-only adherence platforms. Competitive intensity rises as pharma companies vertically integrate delivery assets to shield biologics franchises; Novo Nordisk’s USD 11 billion purchase of Catalent sites exemplifies this trend
Differentiation now hinges on user-centric design, connectivity, and real-world evidence generation. Firms embed Bluetooth or NFC chips in wearables, creating data pipelines that support outcome-based reimbursement. Intellectual property around drive systems, container closure technologies, and software algorithms presents new layers of defensibility. Mergers and licensing deals accelerate entry into these high-growth zones, illustrated by BD’s tie-up with Ypsomed that marries a high-flow prefillable syringe to an autoinjector able to handle 15 cP biologics.
Cost optimisation remains essential. Manufacturers diversify material supply to counter volatility in cyclic olefin and borosilicate glass markets. Investment in regional fill-finish hubs shortens lead times and meets localisation policies. Collectively, these strategies sustain profit pools even as price pressure mounts in tender markets and as alternative delivery routes emerge, preserving resilience in the injectable drug delivery devices market.
Injectable Drug Delivery Devices Industry Leaders
Becton, Dickinson and Company
Gerresheimer AG
West Pharmaceutical Services Inc.
Terumo Corporation
SHL Medical AG
- *Disclaimer: Major Players sorted in no particular order


Recent Industry Developments
- May 2025: Novo Holdings invested in SCHOTT Poonawalla to expand premium injectable packaging capacity
- May 2025: Amneal Pharmaceuticals partnered with ApiJect Systems to scale BFS-based prefilled injectables at Amneal’s New York site
- May 2025: Zydus Lifesciences obtained FDA approval for Glatiramer Acetate prefilled syringes in 20 mg/mL and 40 mg/mL strengths
- April 2025: B. Braun received FDA clearance for Piperacillin/Tazobactam in its DUPLEX system, with launch plans underway


Research Methodology Framework and Report Scope
Market Definitions and Key Coverage
Our study defines the global injectable drug-delivery devices market as revenue earned from purpose-built hardware, syringes, glass or polymer prefilled systems, pen and auto-injectors, needle-free jets, and on-body wearable injectors that introduce therapeutics via intravenous, intramuscular, or subcutaneous routes. Devices housed in ambulatory infusion pumps are counted only when their primary function is single-patient drug administration.
Scope exclusion: Packaged drug formulations, bulk fill-finish services, and ancillary disposables such as gloves or swabs are kept outside the model.
Segmentation Overview
- By Device Type
- Conventional Drug Delivery Devices
- Syringes and Needles
- Vials and Ampoules
- Advanced Drug Delivery Devices
- Prefilled Syringes
- Glass Barrel
- Polymer Barrel
- Pen Injectors
- Auto-Injectors
- Disposable Auto-Injectors
- Re-usable Auto-Injectors
- Needle-Free Injectors
- Wearable Injectors
- Other Advanced Types
- Prefilled Syringes
- Conventional Drug Delivery Devices
- By Therapeutic Application
- Diabetes
- Oncology
- Auto-Immune Disorders
- Cardiovascular Diseases
- Infectious Diseases (Hepatitis, HIV, etc.)
- Pain Management
- Others (Hormonal disorders, Rare and Orphan Diseases and others)
- By Usability
- Disposable Injectors
- Re-usable Injectors
- By Route of Administration
- Sub-cutaneous
- Intramuscular
- Intravenous
- Others (Intradermal, Intravitreal, etc.)
- By End User
- Hospitals and ASCs
- Home-Care Settings
- Specialty Clinics
- By Geography
- North America
- United States
- Canada
- Mexico
- Europe
- Germany
- United Kingdom
- France
- Italy
- Spain
- Rest of Europe
- Asia-Pacific
- China
- Japan
- India
- South Korea
- Australia
- Rest of Asia-Pacific
- Middle East and Africa
- GCC
- South Africa
- Rest of Middle East and Africa
- South America
- Brazil
- Argentina
- Rest of South America
- North America
Detailed Research Methodology and Data Validation
Primary Research
Our analysts held structured calls with device engineers, hospital procurement managers across North America, Europe, and Asia, plus executives at contract manufacturers. Short web surveys of endocrinologists and oncology nurses validated injector replacement cycles and real-world adherence ratios, closing gaps left by secondary data.
Desk Research
We began by charting the device universe with open datasets from the US FDA 510(k) portal, EUDAMED registrations, UN Comtrade shipment codes, and OECD hospital-discharge files; these sources anchored production and trade flows. Diabetes prevalence tables from the IDF Atlas, biologic approval logs released by the EMA, and Questel patent counts helped our team gauge underlying demand. Company 10-Ks, investor decks, and notes from trade associations such as MedTech Europe then guided average selling-price ranges and new-line capacities. The sources named are illustrative; numerous other public records enriched and cross-checked the evidence base.
Market-Sizing & Forecasting
A top-down production and trade reconstruction set the 2025 baseline and was stress-tested with a targeted bottom-up supplier revenue roll-up. Key variables like installed base of pen injectors, chronic disease incidence, biologic launch cadence, home-infusion visit volumes, and average prefilled-syringe prices feed a multivariate regression that projects demand through 2030. Where disclosures were missing, midpoint estimates were interpolated from three-year trends and moderated by expert feedback.
Data Validation & Update Cycle
Outputs pass a two-step peer review and an automated variance screen against external price and volume benchmarks. Reports refresh annually, with interim updates triggered by major recalls, blockbuster approvals, or notable currency swings before delivery to clients.
Why Our Injectable Drug Delivery Devices Baseline Is Trusted
Published estimates often diverge because some publishers mix formulation revenue with hardware sales, apply list rather than realized prices, or refresh models infrequently. This is where Mordor Intelligence earns confidence; its disciplined scope choices, yearly update, and dual-path modeling give decision-makers a steadier yardstick.
Key drivers of gaps include differing device lists, price assumptions, regional coverage, and refresh cadence.
Benchmark comparison
| Market Size | Anonymized source | Primary gap driver |
|---|---|---|
| USD 748.99 B (2025) | Mordor Intelligence | - |
| USD 690.23 B (2025) | Global Consultancy A | Wearables excluded; prices from catalog quotes |
| USD 499.08 B (2024) | Industry Journal B | Counts only pens and auto-injectors; narrow geography |
| USD 764.26 B (2025) | Regional Consultancy C | Blends device and formulation revenue; five-year update cycle |
Taken together, the comparison shows that our transparent, variable-rich model delivers a balanced, reproducible baseline that boardrooms can rely on.


Key Questions Answered in the Report
What is the current size of the injectable drug delivery devices market?
It stands at USD 748.99 billion in 2025 and is on track to reach USD 1,111.05 billion by 2030.
Which device type holds the largest market share?
Prefilled syringes lead with 35.90% share in 2024, thanks to versatility and error reduction benefits.
Which therapeutic area is the fastest-growing user of injectable devices?
Oncology shows the highest growth at an 11.47% CAGR through 2030 as biologic pipelines expand.
What region is expanding most rapidly?
Asia-Pacific records a 9.30% CAGR, driven by rising chronic disease prevalence and improved healthcare access.
How are digital technologies influencing the market?
Connected injectors boost adherence by up to 32% and create data streams that support value-based care models.
What is the main regulatory hurdle for new devices?
Divergent global rules for combination products extend approval timelines by up to 18 months and raise compliance costs.
Page last updated on:


