
Market Overview
| Study Period | 2020 - 2031 |
|---|---|
| Market Size (2026) | USD 30.20 Billion |
| Market Size (2031) | USD 41.09 Billion |
| Growth Rate (2026 - 2031) | 6.35% CAGR |
| Fastest Growing Market | Asia-Pacific |
| Largest Market | North America |
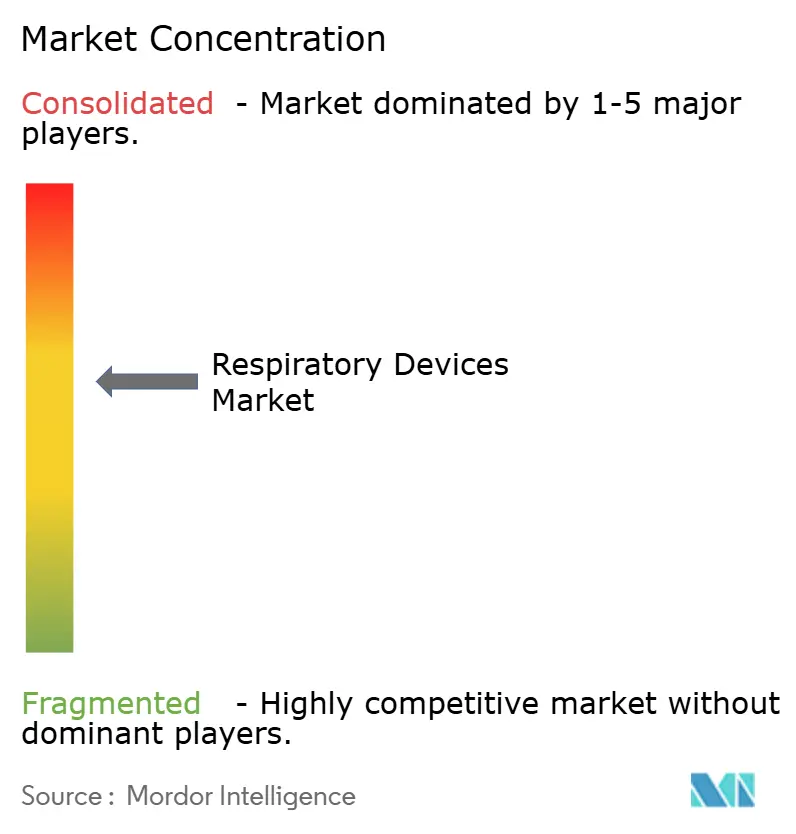
| Market Concentration | Medium |
Major Players *Disclaimer: Major Players sorted in no particular order Image © Mordor Intelligence. Reuse requires attribution under CC BY 4.0. | |
Respiratory Devices Market Analysis by Mordor Intelligence
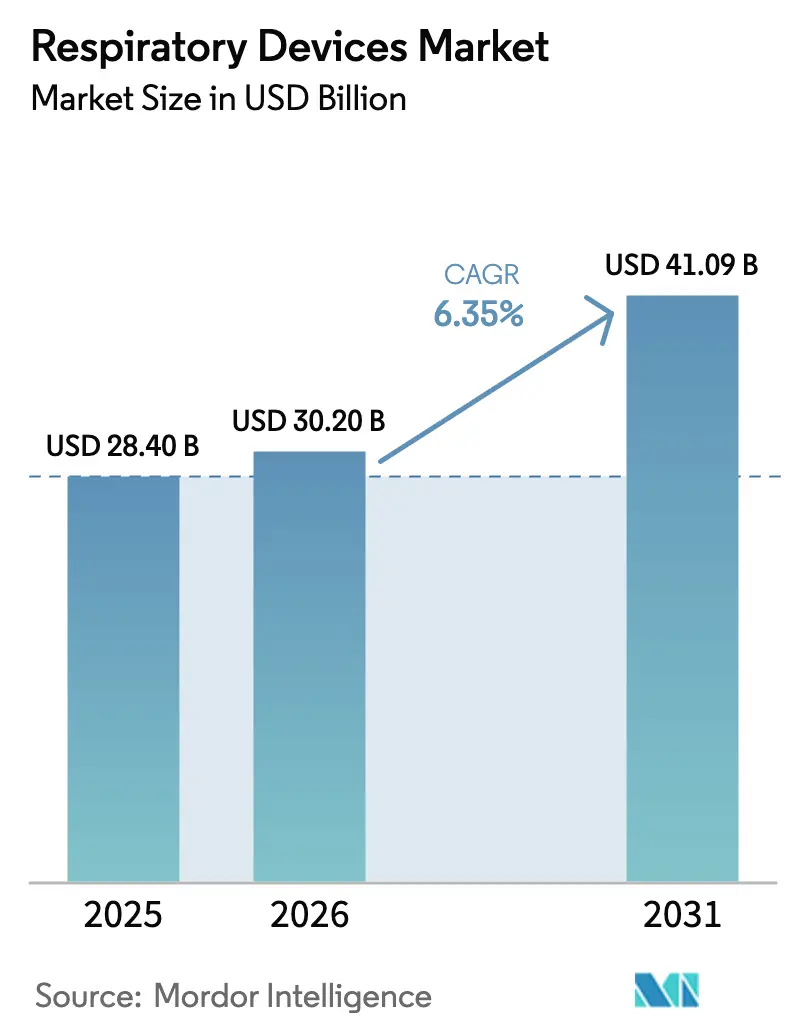
The Respiratory Devices Market size is projected to be USD 28.40 billion in 2025, USD 30.20 billion in 2026, and reach USD 41.09 billion by 2031, growing at a CAGR of 6.35% from 2026 to 2031.
Robust growth flows from three converging forces—population aging in high-income nations, deteriorating air quality in several emerging economies, and mainstream adoption of remote monitoring—which collectively pivot care toward continuous, home-based management. Therapeutic platforms that integrate real-time data exchange now influence formulary decisions, especially under value-based reimbursement contracts in the United States. At the same time, lithium-iron-phosphate batteries lengthen portable oxygen concentrator runtimes, enabling ambulatory use that was not feasible only a few years ago. Device makers are also racing to reduce the regulatory drag imposed by Europe’s CE-MDR backlog and China’s Class III reclassification, often by designing modular platforms that can be re-configured for multiple jurisdictions. These dynamics support a diversified pipeline of products capable of shifting therapy from episodic hospital interventions to continuous home settings, reinforcing the upward trajectory of the respiratory devices market.
Key Report Takeaways
- By device type, Therapeutic Devices commanded 47.56% of the respiratory devices market share in 2025, and their revenue is advancing at an 11.25% CAGR through 2031.
- By indication, Infectious Diseases is expanding at a 10.85% CAGR, the fastest among all clinical segments, while COPD retained 35.53% of 2025 revenue.
- By patient age group, the adult segment accounted for 71.63% of 2025 demand and is scaling at an 8.87% CAGR through 2031.
- By end user, hospitals commanded 56.23% share of the respiratory devices market size in 2025; home settings are expanding at an 11.7% CAGR during 2026-2031.
- By geography, North America led with 39.13% of 2025 sales, whereas Asia-Pacific is pacing the field at a 10.51% CAGR, supported by large-scale reimbursement programs in China and India.
Note: Market size and forecast figures in this report are generated using Mordor Intelligence’s proprietary estimation framework, updated with the latest available data and insights as of January 2026.
Global Respiratory Devices Market Trends and Insights
Drivers Impact Analysis*
| Driver | (~) % Impact on CAGR Forecast | Geographic Relevance | Impact Timeline |
|---|---|---|---|
| Surge in prevalence of respiratory disorders | +1.8% | Global, acute in South Asia and Sub-Saharan Africa | Long term (≥ 4 years) |
| Technological advancements in devices | +1.5% | North America and Europe lead; APAC drives manufacturing | Medium term (2-4 years) |
| Home-healthcare equipment penetration | +1.4% | Core in North America and Western Europe; urban APAC rising | Medium term (2-4 years) |
| Government initiatives and reimbursement | +1.1% | United States, European Union, India | Short term (≤ 2 years) |
| Tele-connected respiratory care platforms | +0.9% | United States, Germany, Australia | Medium term (2-4 years) |
| Demand for ultra-portable oxygen concentrators | +0.7% | Global, highest in aging societies | Short term (≤ 2 years) |
| Source: Mordor Intelligence | |||
Surge in Prevalence of Respiratory Disorders
More than 545 million people live with chronic respiratory diseases, and COPD caused 3.2 million deaths in 2024. Dual-exposure patterns magnify the burden: older adults in wealthy countries experience age-linked lung decline, whereas low-income settings face indoor biomass combustion and severe outdoor particulate pollution. India’s National Health Profile noted a 23% jump in asthma admissions among urban children under 15 during 2025 winter spikes of PM2.5 to 89 µg/m³. In the United States, sleep apnea prevalence reached 38% among adults over 50 in 2025, a trend tied to obesity plateaus and broader use of home sleep tests[1]Centers for Disease Control and Prevention, “Sleep and Sleep Disorders,” cdc.gov. Infectious diseases add to the load: tuberculosis recorded 10.8 million new cases in 2024, many requiring long nebulized regimens. These epidemiological realities keep demand high for diagnostic spirometers and therapeutic systems across the respiratory devices market.
Technological Advancements in Diagnostic & Therapeutic Devices
Miniaturization and connectivity shift sophisticated pulmonary testing from the lab to primary care. In 2025, the FDA cleared 14 AI-enabled spirometry platforms with 91% sensitivity for early COPD detection. Philips launched the DreamStation 3 CPAP in late 2024, integrating leak-compensation algorithms that reduced therapy abandonment by 19%. Mesh nebulizers attained 85% lung-deposit efficiency in 2025 trials, trimming medication waste. Portable oxygen concentrators now run eight hours at 2 l/min on lithium-iron-phosphate power packs. Ventilators featuring closed-loop automation cut ventilator-induced injury 27% in ICU environments, closing the performance gap between hospital and home devices.
Rapid Penetration of Home-Healthcare Respiratory Equipment
Coverage reform, not patient preference, drives the shift to home-based therapy. CMS removed prior authorization for home ventilators in 2025 and raised monthly rental caps to USD 850. Private insurers mirrored the move, linking reimbursement to readmission reduction. Germany approved home CPAP for mild sleep apnea in 2024, citing cardiovascular risk reduction. Japan now subsidizes 70% of device costs for adults over 75, aiming to migrate 120,000 ventilator users to home care by 2028. Fiscal math underpins adoption: home ventilation costs around USD 12,000 annually versus USD 180,000 in hospital settings. Infrastructure gaps in rural regions remain a constraint, but the economic imperative favors continued diffusion.
Government Initiatives & Reimbursement Expansion
Universal health programs increasingly embed respiratory devices to curb downstream acute-care expenditure. India’s Ayushman Bharat added nebulizers and pulse oximeters to its essential list in 2024, subsidizing 80% of costs for 500 million beneficiaries. China instituted provincial reimbursement for home oxygen in 2025, capping 5-liter concentrators at CNY 3,500 (USD 480). Australia’s Therapeutic Goods Administration halved clearance timelines for connected respiratory monitors, enabling faster commercialization. These measures widen access and accelerate revenue capture across the respiratory devices market.
Restraints Impact Analysis*
| Restraint | (~) % Impact on CAGR Forecast | Geographic Relevance | Impact Timeline |
|---|---|---|---|
| High cost of advanced devices | -0.9% | Emerging markets in Asia and Africa | Long term (≥ 4 years) |
| Multi-jurisdiction regulatory clearance | -0.7% | Europe (CE-MDR) and China (NMPA Class III) | Medium term (2-4 years) |
| Lithium-ion battery supply constraints | -0.5% | Global, especially portable oxygen concentrators | Short term (≤ 2 years) |
| Data-privacy concerns for connected devices | -0.4% | United States, Europe, Brazil, India | Medium term (2-4 years) |
| Source: Mordor Intelligence | |||
High Cost of Advanced Devices
A hospital ICU ventilator lists for USD 25,000–50,000, while a home CPAP system ranges from USD 800–2,500—figures far above annual per-capita health budgets in many low-income nations. Only 18% of Indian COPD patients prescribed oxygen therapy actually acquire concentrators, underscoring affordability gaps. Tiered product lines aim to bridge the divide; ResMed’s USD 650 AirMini CPAP omits cellular connectivity to hit cash-pay price points. Pay-per-use leasing via Kenya’s M-TIBA lowers the barrier to USD 3 per day but still reaches less than 5% of potential users.
Stringent Multi-Jurisdiction Regulatory Clearance
Europe’s CE-MDR now mandates clinical investigations for Class IIb respiratory devices, pushing review cycles to 18–24 months and costing roughly USD 380,000 per submission[2]European Commission, “Medical Device Regulation (MDR),” ec.europa.eu . China’s NMPA reclassified connected nebulizers as Class III in 2025, adding 14 months to approvals. Although FDA 510(k) median review times remain near 150 days, software updates that alter clinical claims now require fresh submissions. Larger incumbents manage these burdens, but startups face capital and time hurdles that can slow innovation diffusion within the respiratory devices market.
*Our forecasts treat driver/restraint impacts as directional, not additive. The impact forecasts reflect baseline growth, mix effects, and variable interactions.
Segment Analysis
By Device Type: Therapeutic Devices Extend Their Lead
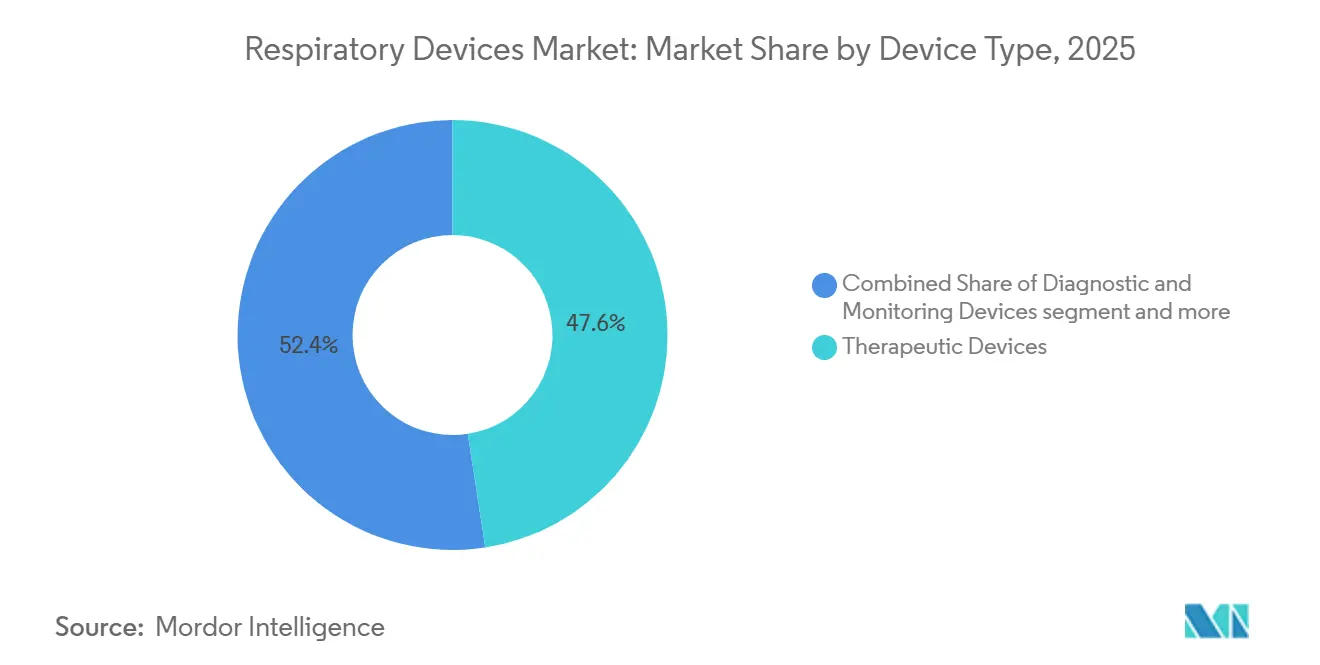
Therapeutic platforms held 47.56% of revenue in 2025, and the segment is projected to grow at an 11.25% CAGR through 2031. The respiratory devices market size attributed to CPAP and BiPAP systems continues to swell on the back of rising obstructive sleep apnea diagnoses among adults over 50. Portable oxygen concentrators, now able to support eight-hour outdoor use, are also expanding access for ambulatory COPD patients. Home ventilators benefit from CMS reimbursement changes, while smart inhalers with Bluetooth dose logging reached 12% penetration in 2025.
Diagnostic and Monitoring systems captured 32% of 2025 revenue with a slower 5.8% CAGR as commoditization pressures margins. The respiratory devices market share for handheld, AI-guided spirometry is increasing, but average selling prices fell for pulse oximeters due to Chinese competition. Consumables such as single-use masks and tubing represented 20.45% of 2025 revenue and will track overall procedure volumes, especially as infection-control protocols remain stringent.



By Indication: Infectious Diseases Gain Momentum
COPD generated 35.53% of 2025 sales, anchored by lifelong oxygen and bronchodilator needs. Yet Infectious Diseases—led by tuberculosis and pandemic preparedness spending—show the fastest 10.85% CAGR, lifting the respiratory devices market size allocated to mesh nebulizers and portable ventilators. Asthma retains a strong 28% share, with adherence-tracking inhalers now a payer focus. Sleep apnea remains significant in developed economies, while Other Respiratory Disorders, including cystic fibrosis, secure steady growth as survival rates improve.
By Patient Age Group: Adults Dominate, Pediatrics Trails
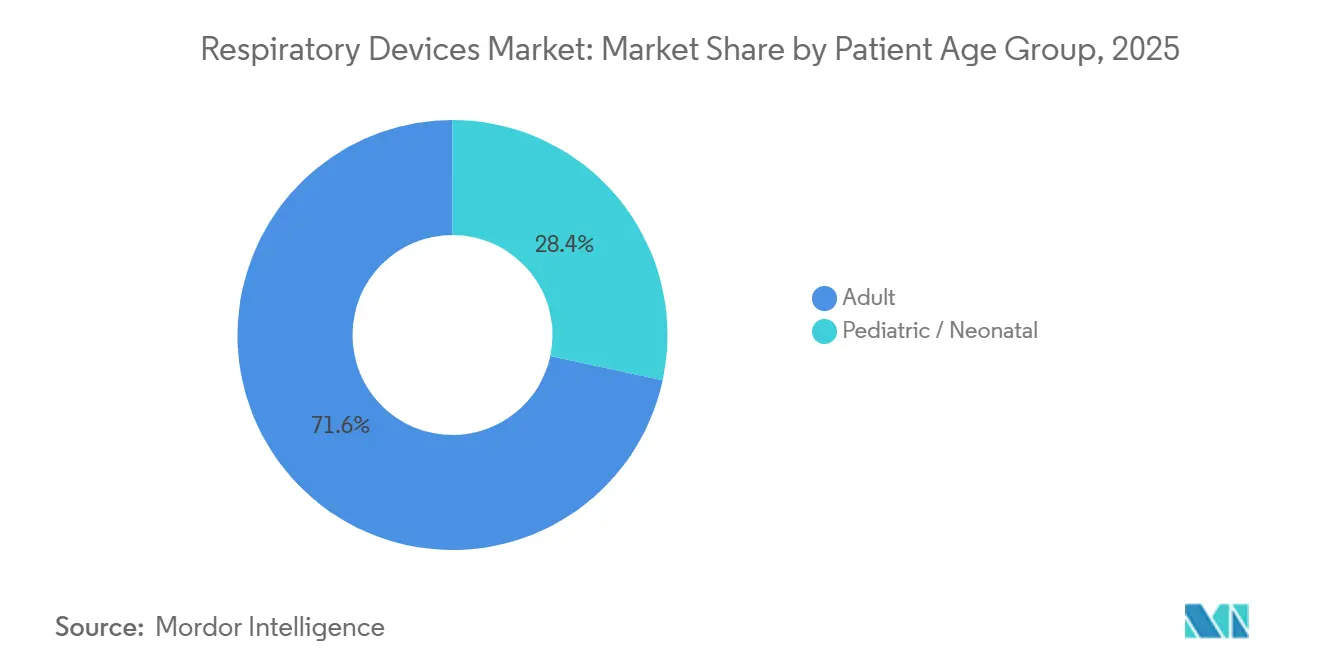
Adults contributed 71.63% of 2025 revenue and will grow at an 8.87% CAGR through 2031 as the global 65-plus population rises. Higher reimbursement ceilings and co-morbid obesity support demand for advanced BiPAP devices. The pediatric and neonatal segments grow more slowly, constrained by declining birth rates in wealthier countries and stricter regulatory pathways. Neonatal ventilators still see incremental volume increases in emerging markets adding NICU beds.
By End User: Home Settings Accelerate
Hospitals retained 56.23% of 2025 sales, but Home Settings are advancing at an 11.7% CAGR on the strength of tele-connected equipment and payer incentives to cut readmissions. Respiratory and sleep clinics remain important for diagnostic throughput, while ambulatory centers grow in tandem with same-day bronchoscopy volumes. Devices conceived for intuitive home use are best positioned to capture the high-growth end-user shift shaping the respiratory devices market.
Geography Analysis
North America generated 39.13% of 2025 revenue, with the United States alone spending USD 9.8 billion on respiratory equipment. Growth moderates to 6.2% as CPAP penetration approaches saturation, but software-enabled upgrades and home ventilator adoption still lift value. Canada’s Assistive Devices Program added portable concentrators, and Mexico’s social security institute widened CPAP coverage, adding incremental volumes.
Asia-Pacific is the fastest-growing region at a 10.51% CAGR. China’s provincial reimbursement for home oxygen aims at 100 million COPD patients, while India’s Ayushman Bharat subsidizes nebulizers for 500 million citizens. Japan’s subsidy covering 70% of device costs for seniors accelerates the move to home ventilation, and South Korea broadened CPAP coverage to mild cases. Australia’s expedited pathway for connected monitors further catalyzes product launches.
Europe accounted for 28% of 2025 revenue but grows at a muted 5.9% as CE-MDR bottlenecks slow new device rollouts. Germany remains the largest national market after approving home CPAP for mild cases. The United Kingdom boosted home respiratory allocations under its NHS Long Term Plan, and France raised monthly reimbursements for home ventilators, improving supplier economics.
Middle East and Africa held 6% of sales, powered by GCC hospital investments and South Africa’s public-sector purchase of concentrators. South America contributed 5.87% as Brazil’s SUS added home CPAP coverage for 1.2 million patients, offering fresh demand in a historically under-penetrated market.


Regulatory Landscape
Respiratory devices face tightening quality-system and conformity assessment requirements across major markets, which increases documentation and lifecycle compliance burdens for connected and therapeutic platforms. In the United States, the FDA implemented the Quality Management System Regulation (QMSR) in February 2026, aligning quality-system expectations more closely with internationally recognized quality management principles and tightening scrutiny on design controls and post-market processes that affect software-enabled respiratory devices.
In Europe, the Medical Device Regulation (MDR) continues to shape launch timing and evidence generation for higher-risk respiratory systems, with additional rulemaking in 2026 aimed at standardizing notified-body operations and targeted clinical-investigation requirements. The European Commission issued Implementing Regulation (EU) 2026/977 in May 2026 to set more uniform quality management and procedural expectations for notified-body conformity assessment activities, and Delegated Regulation (EU) 2026/1451 in March 2026 to amend MDR provisions tied to clinical investigation exemptions for certain implantable and Class III devices. Alongside these changes, regulators such as Health Canada keep medical-device oversight frameworks that emphasize robust quality systems and clinical evidence packages, reinforcing a multi-jurisdiction compliance approach for global respiratory device manufacturers.
Competitive Landscape
The respiratory devices market shows moderate concentration: ResMed, Philips, Medtronic, GE HealthCare, and Fisher & Paykel collectively held a significant percentage of the 2025 revenue. ResMed leverages an installed base of 8 million cloud-connected CPAP users through its myAir platform, giving payers real-time adherence metrics. Philips secures hospital accounts with DreamMapper integration into electronic health records. Mindray and Beijing Aeonmed undercut Western rivals by 30–40% in China’s ventilator tenders, aided by local regulatory momentum.
Software and services differentiate premium offerings. Drägerwerk’s AI-guided SmartPilot View lowered ICU stays by 1.8 days in German trials, while Fisher & Paykel’s Optiflow high-flow nasal system now owns 34% of ICU support after reducing intubations 22%. New entrants such as React Health focus on cloud-native spirometry that bills per test, exploiting gaps in outpatient pulmonary diagnostics. ISO 13485 and IEC 60601 compliance costs continue to discourage smaller firms, reinforcing incumbents’ scale advantages and preserving their slice of the respiratory devices market.
Respiratory Devices Industry Leaders
Koninklijke Philips N.V.
Medtronic plc
GE HealthCare
ResMed
Fisher & Paykel Healthcare Limited.
- *Disclaimer: Major Players sorted in no particular order

Market Opportunities and Future Outlook
Home and acute-care respiratory workflows are moving toward platform standardization, disposable simplification, and software-driven therapy optimization, which creates whitespace for vendors that reduce setup complexity while maintaining clinical performance. A key reference point is March 2026, when LivaNova secured FDA PMA for its aura6000 neuromodulation system for obstructive sleep apnea, expanding interventional options beyond CPAP for selected patients. The approval also points to broader payer and evidence-generation focus as interventional therapies for sleep-disordered breathing incorporate real-world data collection into routine care.
Regulators are also formalizing pathways for novel modalities and decision-support in critical care, which supports wider use of analytics and modular hardware integration. In April 2026, Vapotherm received FDA 510(k) clearance for its All Patient Circuit (APC), enabling a single disposable circuit across neonatal to adult patients on its HVT 2.0 system, supporting hospital efforts to streamline inventory and training. A CMS stakeholder letter to CMS in April 2026 urging clarification of usage criteria reinforces payer-policy engagement as evidence-generation activities expand across home and hospital settings.
Recent Industry Developments
- July 2026: Autonomous Healthcare received FDA De Novo marketing authorization for Syncron-E, an AI-based software that analyzes ventilator waveform data to detect patient-ventilator asynchrony. The authorization created a new FDA device classification for ventilator waveform analysis software, supporting broader adoption of software-led ventilation optimization and integration with ICU monitoring ecosystems.
- March 2026: LivaNova secured FDA PMA for the aura6000 neuromodulation system for obstructive sleep apnea, expanding interventional treatment options beyond CPAP for selected patients. The approval broadens the interventional treatment set for sleep-disordered breathing and signals growing integration of neuromodulation into standard care pathways.
- April 2024: Philips Respironics reached a final consent decree agreement with the US Department of Justice and the FDA covering its US sleep and respiratory business operations. The agreement set a defined regulatory remediation path and reinforced quality-system and compliance requirements that affect supply continuity, service operations, and new product introductions in the company's respiratory portfolio.


Research Methodology Framework and Report Scope
Market Definition and Coverage
This market covers the value of medical devices that help diagnose, monitor, or treat breathing-related conditions in clinical and home-care settings, and it includes major equipment plus the patient-facing interfaces that are typically sold with them.
Scope exclusions: Industrial respiratory protection equipment and anesthesia-only breathing circuit accessories are excluded from this market.
Segmentation Overview
- By Device Type
- Diagnostic & Monitoring Devices
- Spirometers
- Sleep Test Devices
- Peak Flow Meters
- Pulse Oximeters
- Capnographs
- Other Diagnostic & Monitoring Devices
- Therapeutic Devices
- CPAP Devices
- BiPAP Devices
- Humidifiers
- Nebulizers
- Oxygen Concentrators
- Ventilators
- Inhalers
- Other Therapeutic Devices
- Consumables & Disposables
- Masks
- Breathing Circuits & Tubing
- Other Disposables
- Diagnostic & Monitoring Devices
- By Indication
- COPD
- Asthma
- Sleep Apnea
- Infectious Diseases
- Other Respiratory Disorders
- By Patient Age Group
- Adult
- Pediatric / Neonatal
- By End User
- Hospitals
- Respiratory & Sleep Clinics
- Ambulatory Surgical & Emergency Centers
- Home Settings
- By Geography
- North America
- United States
- Canada
- Mexico
- Europe
- Germany
- United Kingdom
- France
- Italy
- Spain
- Rest of Europe
- Asia-Pacific
- China
- India
- Japan
- Australia
- South Korea
- Rest of Asia-Pacific
- Middle East and Africa
- GCC
- South Africa
- Rest of Middle East and Africa
- South America
- Brazil
- Argentina
- Rest of South America
- North America
Data Sources, Market Sizing, and Validation
Desk Research
Desk research starts by fixing the market perimeter and building a clean demand map by device use setting and patient pathway. We use public, non-paywalled references such as the World Health Organization, the US Centers for Disease Control and Prevention, the US FDA product and recall databases, the European Commission medical device guidance (MDR), and the OECD health statistics to understand disease burden, care access, and policy signals.
To translate demand signals into a value model, we also review company annual reports, investor presentations, reputable medical journals on respiratory care adoption, and association or health-system publications that describe usage patterns for ventilatory support, oxygen therapy, and sleep-disordered breathing. Where needed, paid subscription access for company financials and a patent database are used to cross-check revenue exposure and product-cycle timing. These examples are not exhaustive, and many other public sources are also used for data collection, validation, and clarification.
Primary Interviews and Surveys
Primary work is used to pressure-test the desk view and fill gaps around pricing, replacement cycles, channel margins, and how demand shifts between hospital and home-care. We speak with manufacturers, distributors, clinicians, and procurement or home-care operators across major regions, so assumptions can be confirmed and then adjusted once a consistent pattern shows up.
Distribution of primary research fieldwork respondents
| Company type | Respondent position | Region |
|---|---|---|
| Top tier: 39% | CXOs: 20% | APAC: 41% |
| Mid tier: 40% | Functional/Unit leaders: 36% | EMEA: 32% |
| Smaller Players: 21% | Managers: 44% | Americas: 27% |
Market-Sizing & Forecasting
Sizing starts with a top-down build where epidemiology and treated-patient pools are converted into device demand by care setting, then shaped by replacement rates and utilization in respiratory wards, sleep clinics, and home-care programs. Since not every patient converts into device use, we apply penetration rates anchored to guideline-driven therapy uptake and reimbursement access, and then convert units into value using typical average selling price ranges observed through channel checks.
Key inputs that repeatedly influence the totals include COPD and asthma prevalence trends, sleep apnea diagnosis rates, oxygen therapy eligibility, hospital and home-care infrastructure, and the mix shift between invasive and non-invasive ventilation. We also track tender activity and regulatory or recall events as practical indicators that pricing and shipment timing can move.
For forecasting, scenario analysis is used so adoption and pricing can be flexed separately under base, conservative, and higher-uptake cases that were reviewed with interviewees. Results are corroborated with selective bottom-up approximations, such as sampling major product lines to estimate units times ASP and checking that the implied revenue intensity matches public financial disclosures. When a bottom-up view is incomplete for smaller channels, the gap is handled through distribution markups and regional adoption benchmarks rather than assuming full supplier roll-ups are available.
Data Validation & Update Cycle
Validation is done through multiple checks that look for obvious mismatches before sign-off, such as comparing implied device volumes to patient pools, installed base behavior, and regional spending direction. If an output deviates from these external signals, we re-check the assumptions driving the variance and, when needed, re-contact sources to resolve conflicts.
A second analyst reviews the model logic, and a final review confirms that definitions and unit economics stay consistent across regions and years. Reports are refreshed annually, with interim updates when material events occur, and a last-minute review is done before delivery so clients receive the most current view.
Mordor Intelligence's Global Respiratory Device Market Market Sizing Compared With Other Published Estimates
Published estimates for respiratory devices do not always match because the market label is used differently across studies, and the year selected for the base can also change the reported value. Differences often come from how companies treat consumables, patient interfaces, and adjacent hospital equipment, and from whether values are captured at manufacturer level or after channel markups.
Anesthesia-only breathing circuit accessories sit outside Mordor Intelligence's scope for this study, which removes adjacent revenue that some broader respiratory care tallies may still include. The spread can also be explained by how fast ASPs are assumed to normalize after supply shocks, how home-care adoption is projected for PAP and oxygen concentrators, and whether the study refreshes assumptions when policy or recall events shift demand in-year.
Benchmark comparison
| Source | Market Size | Gaps in Research Methodology |
|---|---|---|
| Mordor Intelligence | USD 30.20 B (2026) | |
| Global Consultancy A | USD 25.33 B (2024) | Uses an earlier base year and appears to include a wider set of consumables and accessories, which can shift the total when channel margins are treated differently. |
| Industry Publisher B | USD 26.87 B (2024) | Anchors growth on a faster adoption path through 2034 and does not clearly separate device equipment from non-device respiratory care items, which can inflate value when scope is broader. |
Taken together, the comparison shows that the biggest swings come from scope edges, base-year timing, and how pricing and channel markups are applied. By tying the totals back to treated-patient demand, setting-specific utilization, and repeatable ASP logic, the estimate stays traceable and easier to reconcile when new evidence emerges.


Key Questions Answered in the Report
How large is the respiratory devices market in 2026?
The respiratory devices market size stood at USD 30.20 billion in 2026 and is projected to reach USD 41.09 billion by 2031.
Which segment is expanding the fastest?
Therapeutic Devices are growing at an 11.25% CAGR, the highest among all product categories.
What drives Asia-Pacific demand?
Expanded public reimbursement in China and India plus aging demographics in Japan propel Asia-Pacific growth at a 10.51% CAGR.
How is home care affecting device demand?
Payer incentives and tele-monitoring systems are shifting therapy toward home settings, which are scaling at an 11.7% CAGR.
What regulatory changes are most impactful?
Europe's CE-MDR and China's Class III reclassification lengthen approval timelines and raise compliance costs, influencing product launch strategies.
Page last updated on:






