Market Overview
| Study Period | 2020 - 2031 |
|---|---|
| Forecast Data Period | 2026 - 2031 |
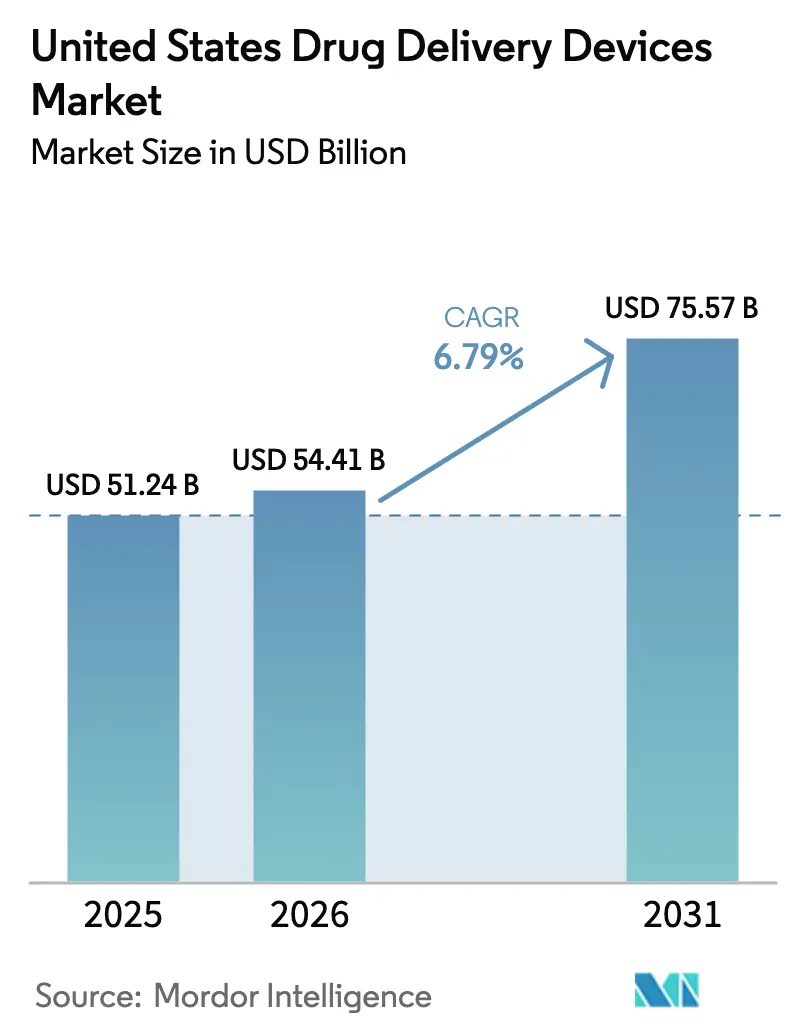
| Base Year Market Size (2025) | USD 51.24 Billion |
| Market Size (2026) | USD 54.41 Billion |
| Market Size (2031) | USD 75.57 Billion |
| Growth Rate (2026 - 2031) | 6.79% CAGR |
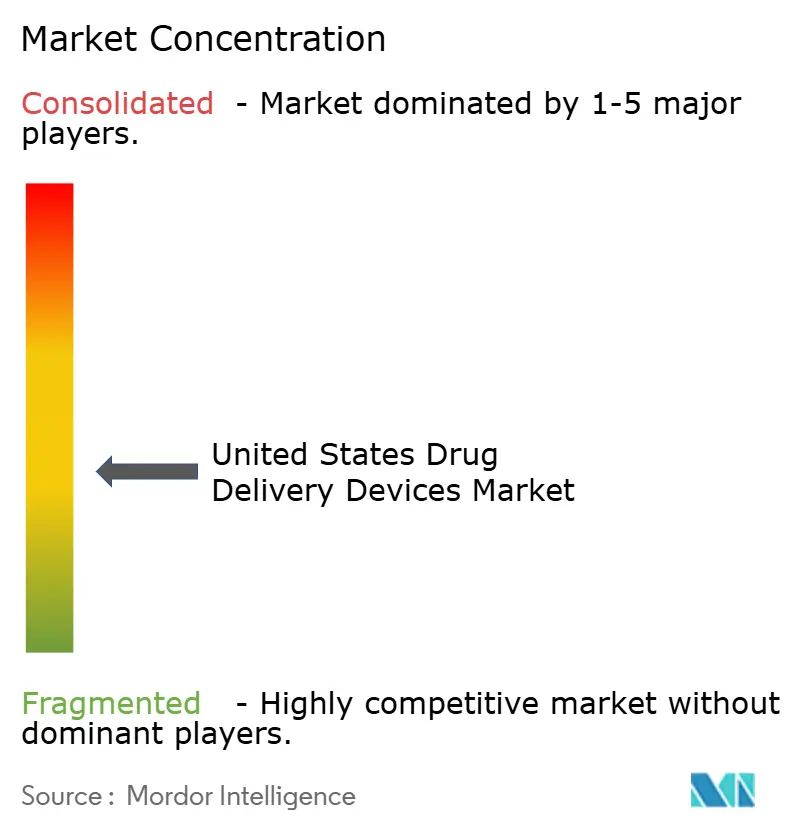
| Market Concentration | Medium |
Major Players *Disclaimer: Major Players sorted in no particular order Image © Mordor Intelligence. Reuse requires attribution under CC BY 4.0. | |
United States Drug Delivery Devices Market Analysis by Mordor Intelligence
The United States Drug Delivery Devices Market size is expected to increase from USD 51.24 billion in 2025 to USD 54.41 billion in 2026 and reach USD 75.57 billion by 2031, growing at a CAGR of 6.79% over 2026-2031.
Investment announcements exceeding USD 150 billion for biologics manufacturing capacity during 2024-2025 are converting fill-finish demand into immediate orders for prefilled syringes, autoinjectors, and large-volume wearable injectors, while connected-device mandates are steering capital toward platforms that capture real-time adherence data. Subcutaneous administration is gaining momentum, with a 7.69% CAGR, as large-volume patch pumps from BD, Ypsomed, and Enable Injections deliver 5-50 mL biologic doses at home, thereby reducing infusion-center visits. Hospitals accounted for 49.28% of end-user spending in 2025, yet home healthcare settings are advancing at an 8.78% CAGR after CMS began reimbursing home infusion therapy at near-parity with outpatient departments on 1 January 2025.
Key Report Takeaways
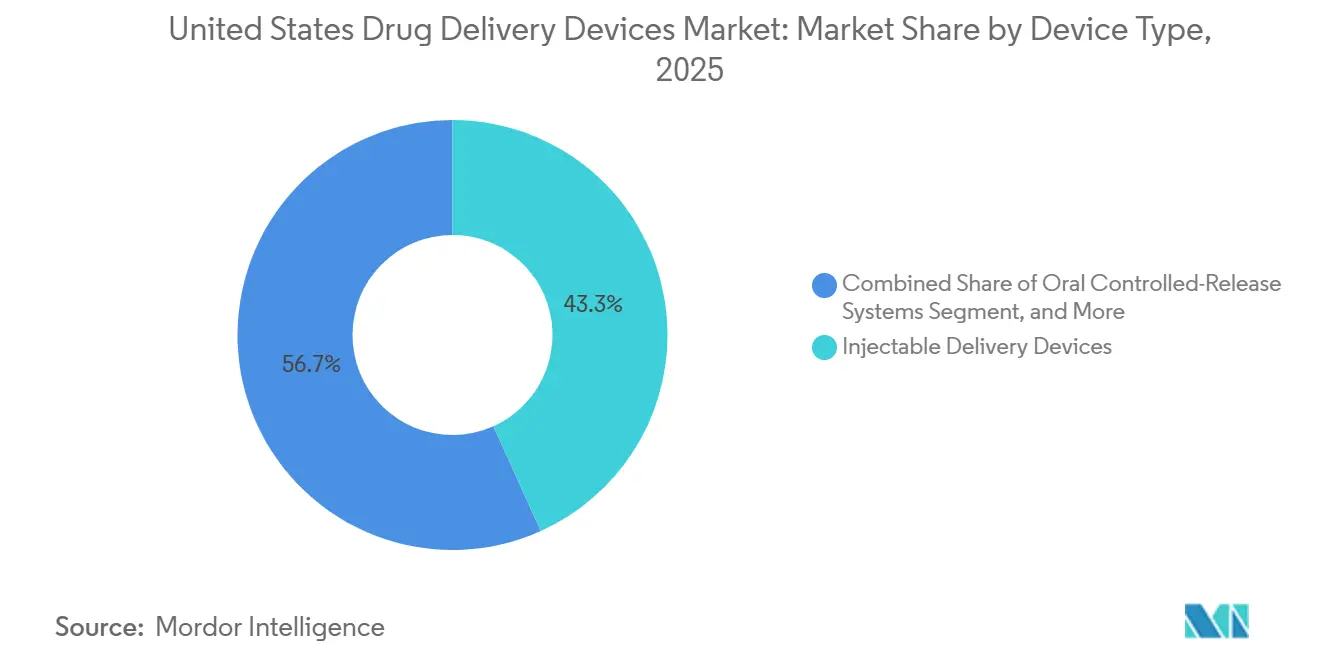
- By device type, injectable platforms held 43.27% of the United States drug delivery devices market share in 2025, whereas oral controlled-release systems are forecast to expand at a 7.32% CAGR through 2031.
- By route of administration, intravenous formats accounted for 36.83% of revenue share in 2025, while subcutaneous delivery is projected to grow fastest at a 7.69% CAGR over 2026-2031.
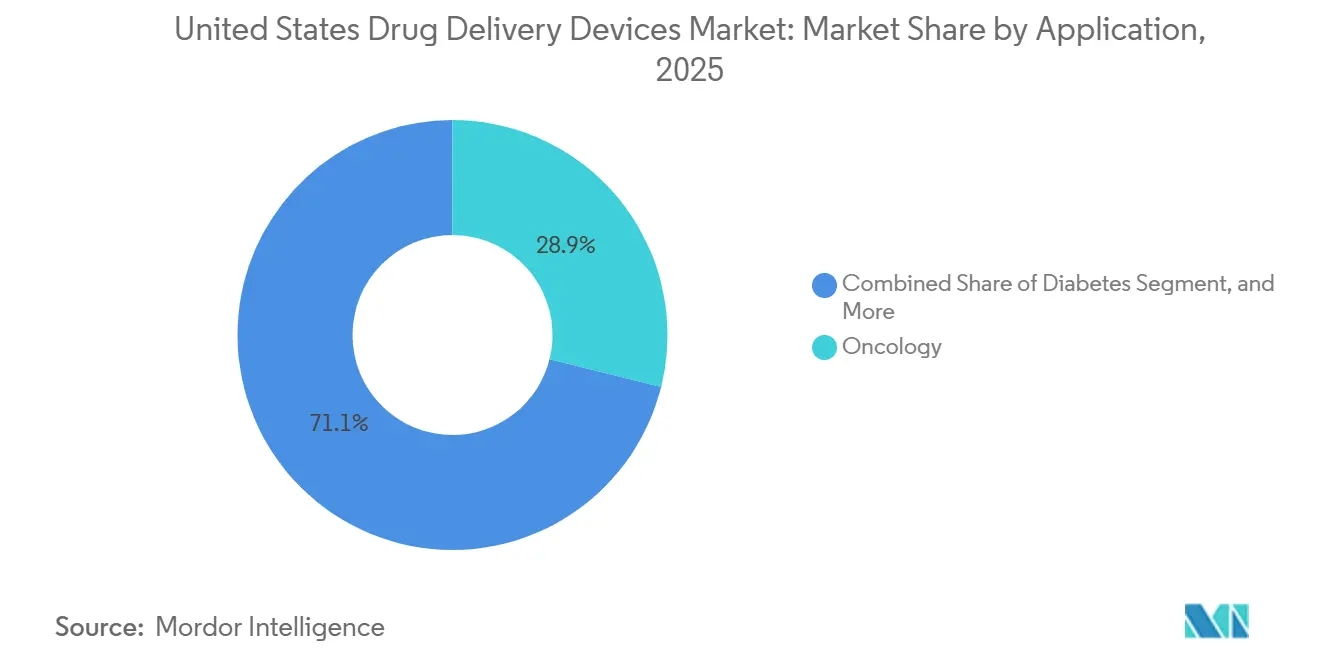
- By therapeutic area, oncology dominated the United States drug delivery devices market with a 28.88% share in 2025, yet diabetes devices are poised to grow at a 9.01% CAGR through 2031.
- By end user, hospitals accounted for 49.28% of 2025 spending, but the home healthcare segment is forecast to lead growth at an 8.78% CAGR through the outlook period.
Note: Market size and forecast figures in this report are generated using Mordor Intelligence’s proprietary estimation framework, updated with the latest available data and insights as of January 2026.
United States Drug Delivery Devices Market Trends and Insights
Drivers Impact Analysis*
| Driver | (~) % Impact on CAGR Forecast | Geographic Relevance | Impact Timeline |
|---|---|---|---|
| Rising Prevalence of Chronic Diseases | +1.2% | Global, concentrated in aging U.S. demographics | Long term (≥ 4 years) |
| Growing Preference for Self-Administration & Home Healthcare | +1.5% | National, accelerated in metropolitan areas with telehealth infrastructure | Medium term (2-4 years) |
| Connected Smart Devices Improve Adherence & Outcomes | +1.1% | National, early gains in diabetes and respiratory segments | Medium term (2-4 years) |
| Biologics Capacity Boom Drives Demand for Advanced Containers | +1.8% | National, spillover to contract manufacturing hubs in North Carolina, Indiana | Short term (≤ 2 years) |
| Value-Based Care Models Favor Long-Acting Implants | +0.9% | National, Medicare Advantage penetration highest in Florida, California | Long term (≥ 4 years) |
| Expanding Biologics Pipeline Necessitating Advanced Parenteral Delivery Platforms | +1.3% | National, concentrated in oncology and autoimmune therapeutic areas | Medium term (2-4 years) |
| Source: Mordor Intelligence | |||
Rising Prevalence of Chronic Diseases
Nearly 38.4 million Americans lived with diagnosed diabetes in 2024, and the CDC projects one in three adults will carry the diagnosis by 2050, intensifying long-term demand for continuous glucose monitors, insulin pumps, and GLP-1 autoinjectors.[1]Centers for Disease Control and Prevention, “National Diabetes Statistics Report 2024,” cdc.gov Cancer incidence surpassed 2 million new cases in 2024, sustaining high utilisation of port-a-cath systems and ambulatory infusion pumps for chemotherapy. Cardiovascular disease affects 127 million adults, prompting increased use of anticoagulant pens and drug-eluting stents that mitigate hospital readmissions. Chronic respiratory conditions and a growing autoimmune population are driving the United States drug delivery devices market toward durable, patient-managed formats. The cumulative effect is a multiyear lift in baseline procedure volumes, supporting predictable unit shipments well beyond the forecast horizon.
Growing Preference for Self-Administration & Home Healthcare
CMS introduced stand-alone reimbursement codes for home infusion therapy in 2025, neutralising historical payment penalties and giving providers an economic incentive to discharge stable patients with wearable injectors and connected pumps.[2]Centers for Medicare & Medicaid Services, “Home Infusion Therapy Payment Rule 2025,” cms.gov Medicare Advantage enrollment crossed 33 million members the same year, and plans rapidly bundled device supplies with telehealth monitoring to cut emergency-department visits. The American Nurses Association forecasts 78,000 unfilled RN positions by 2026, further encouraging technologies that shift dosing responsibility to patients. Device makers answered with user-centred autoinjectors featuring needle-retraction windows and audible cues that reduce error rates among seniors. Collectively, these trends pivot the United States drug delivery devices market toward home-centric care pathways that reward simplicity and remote visibility.
Connected Smart Devices Improve Adherence & Outcomes
Dexcom’s G7 CGM seamlessly links with Tandem’s Mobi pump, automatically modulating basal rates and reducing severe hypoglycemia events by 40% in a real-world cohort.[3]Dexcom Inc., “G7 Clinical Outcomes Presentation 2025,” dexcom.com Propeller Health inhaler sensors transmit timestamped actuations and GPS data so pulmonologists can intervene before an asthma crisis, yet only connected devices with demonstrated clinical benefit are gaining broad reimbursement. Payers such as UnitedHealthcare now require documentation that closed-loop systems outperform manual therapy, forcing lagging device platforms to retrofit connectivity or risk exclusion. The FDA cybersecurity guidance issued in 2024 embedded SBOM submission as a premarket requirement, adding compliance costs but also establishing trust that data-rich devices will not expose networks. The net effect is a premium on platforms that transform raw data into actionable dosing logic, reinforcing digital moats around incumbents.
Biologics Capacity Boom Drives Demand for Advanced Containers
Manufacturers announced USD 150 billion in new U.S. biologics facilities between 2024-2025, with capacity to be concentrated in North Carolina, Indiana, and Ohio. Each monoclonal antibody batch requires cyclic olefin polymer syringes, elastomeric stoppers, and safety-engineered needles that comply with ISO 11608, propelling component backlogs beyond 18 months. West Pharmaceutical reported 24-month lead times for coated plungers in 2025, compelling drug sponsors to lock multiyear contracts early. Wearable injectors capable of handling 10-50 mL viscous formulations are simultaneously replacing IV infusion lines, shifting revenue from acute-care equipment into ambulatory patches. In the United States drug delivery devices market, container shortages have quietly become a rate-limiting step for therapy launches, advantaging vertically integrated suppliers.
Restraints Impact Analysis*
| Restraint | (~) % Impact on CAGR Forecast | Geographic Relevance | Impact Timeline |
|---|---|---|---|
| Stringent FDA Regulatory Requirements | -0.8% | National, affecting all device classes | Long term (≥ 4 years) |
| Recalls & Device Malfunctions Undermine Confidence | -1.1% | National, concentrated in insulin pump and autoinjector users | Short term (≤ 2 years) |
| Raw-Material Bottlenecks in Medical-Grade Polymers | -0.5% | National, supply-chain dependencies on Asian resin producers | Medium term (2-4 years) |
| Rising Needlestick Injury Litigation Elevating Liability Insurance Premiums | -0.4% | National, acute in hospital and ambulatory settings | Medium term (2-4 years) |
| Source: Mordor Intelligence | |||
Stringent FDA Regulatory Requirements
Cybersecurity guidance released in 2024 makes an SBOM and threat-modeling dossier a condition of clearance for any wireless device, extending development cycles 6-12 months and adding USD 2-5 million per platform. Combination product reviews now require human factors validation even when predicate devices exist, and post-market surveillance reporting is mandatory within 30 days of serious incidents. Smaller innovators struggle with the staffing and documentation load, slowing pipeline velocity and nudging the United States drug delivery devices industry toward consolidation. Real-world evidence is also becoming increasingly important; products must demonstrate performance in routine practice within 24 months, which escalates launch costs.
Recalls & Device Malfunctions Undermine Confidence
Medtronic’s Class I recall of over 2 million MiniMed pumps in 2024 shook patient trust and inflated liability premiums by 22% for all pump makers. Tandem and Insulet faced software-related recalls that year, and BD withdrew syringe lots due to particulate contamination alarms. Endocrinologists reported a 15% uptick in requests to switch back to manual injections during recall peaks, a behavioural drag on automated-device adoption. Class-action litigation raised out-of-pocket settlement costs and spurred payers to insist on longer warranty terms, trimming gross margins. The episode underscores how a single high-visibility failure can ripple across the broader United States drug delivery devices market for several quarters.
*Our forecasts treat driver/restraint impacts as directional, not additive. The impact forecasts reflect baseline growth, mix effects, and variable interactions.
Segment Analysis
By Device Type: Injectable Platforms Dominate, Oral Systems Accelerate
Injectable platforms generated 43.27% revenue in 2025, anchoring the United States drug delivery devices market share with 8.2 billion units shipped. Wearable injectors such as BD Libertas and Enable enFuse now handle 5-50 mL biologics, opening subcutaneous routes for therapies once limited to infusion chairs. Oral controlled-release systems, although only 18% of 2025 revenue, will outpace all categories at 7.32% CAGR to 2031 because Rybelsus proved peptides can survive GI transit when paired with absorption enhancers.
The historical CAGR for injectables averaged 5.8% during 2019-2025, but steps up slightly over 2026-2031 as biosimilar launches and GLP-1 demand intensify. Smart sensors improved adherence, but adoption lags pending uniform payer coverage. Transdermal and ocular devices together remain below 10% share but win premium pricing where they reduce clinic visits, exemplified by Genentech’s twice-yearly Susvimo refills for AMD.


By Route of Administration: Intravenous Leads, Subcutaneous Surges
Intravenous delivery captured 36.83% of the 2025 value, primarily through hospital chemotherapy and TPN volumes, yet its forecast CAGR tails at 5.2% as payers reroute suitable biologics to the home. Subcutaneous delivery will grow 7.69% annually, driven by the scaling of large-volume patch pumps reimbursed under new home-infusion codes. Intradermal remains niche, though microneedle vaccine patches secured Breakthrough Device status in 2024. Oral routes hold a stable base, while pulmonary and transdermal routes serve targeted populations like COPD and chronic pain, sustaining mid-single-digit growth.
By Application: Oncology Dominates, Diabetes Accelerates
Oncology retained 28.88% of 2025 spend thanks to infusion hardware, but diabetes devices will post the strongest 9.01% CAGR through 2031 as closed-loop ecosystems penetrate both Medicare and commercial formularies. Respiratory, cardiovascular, and autoimmune segments follow with steady growth tied to uptake of biologics or smart inhalers. Other categories, including rare-disease gene therapies, remain small in dollars but command ultra-high device ASPs due to cryogenic handling needs.
By End User: Hospitals Lead, Home-Healthcare Gains Ground
Hospitals consumed 49.28% of 2025 expenditures, yet growth slowed to 4.9% as staffing shortages and value-based penalties encouraged earlier discharge. Home healthcare grows 8.78% annually after reimbursement parity, with ambulatory surgical centers and specialty clinics filling the mid-acuity gap. Devices that seamlessly transition across sites now enjoy procurement preference, meaning a single SKU must satisfy both institutional and home-care safety protocols.
Geography Analysis
Regional demand in the United States drug delivery devices market aligns with payer mix and manufacturing footprints. North Carolina, Indiana, and Ohio host multibillion-dollar expansions in biologics production by Novo Nordisk, Eli Lilly, and Amgen, stimulating local supply chains for prefilled syringes and elastomeric seals. California and Massachusetts lead in clinical trials, driving the adoption of prototype devices among academic centres. Sun Belt states show the fastest unit growth as Medicare Advantage penetration tops 50% and diabetes prevalence rises. Rural broadband gaps still slow connected-device uptake in Mountain West counties; federal infrastructure funding should close most of that divide by 2028. State Medicaid policies create patchwork access: Texas expanded CGM coverage in 2025, boosting shipments 22%, whereas non-expansion states lag.
Competitive Landscape
The five largest suppliers, BD, Medtronic, Insulet, Dexcom, and Tandem, held a significant share of the combined 2025 revenue, signalling moderate concentration. Novo Holdings’ USD 16.5 billion buyout of Catalent underscored a shift toward vertical integration, pressuring pure-play component makers. Enable Injections, Ypsomed, and West Pharmaceutical gained share by specialising in large-volume subcutaneous systems or advanced packaging. Software prowess is now a key differentiator; platforms unable to furnish secure cloud data risk exclusion from integrated delivery network formularies. Liability costs post-recall highlight the importance of rigorous validation, favouring incumbents with deep quality budgets.
United States Drug Delivery Devices Industry Leaders
Becton, Dickinson and Company
Johnson & Johnson
Medtronic plc
West Pharmaceutical Services, Inc.
3M
- *Disclaimer: Major Players sorted in no particular order

Recent Industry Developments
- May 2025: Regeneron and Roche commit over USD 53 billion to expand US biologics manufacturing, adding capacity for gene therapy vectors and continuous glucose monitors.
- May 2025: Amneal and Apiject partner to scale BFS-based injectables at Amneal’s Brookhaven site, broadening sterile dosage capability.
- May 2025: Eli Lilly pledges up to USD 250 million with Purdue University to accelerate pharmaceutical innovation.
- April 2025: FDA clears a prefilled efgartigimod syringe for at-home use and authorizes Epiminder’s implanted EEG monitor, signifying continued momentum in self-administered neurology devices.


Research Methodology Framework and Report Scope
Market Definitions and Key Coverage
Our study defines the United States drug delivery devices market as every finished, FDA-cleared mechanical or electromechanical device that enables dose-controlled administration of a therapeutic molecule, prescription or biologic, into or onto the human body, spanning injectables, inhalation systems, transdermal patches, infusion pumps, implants, topical applicators, and connected wearables.
Scope exclusion: single-use ancillary disposables such as conventional syringes, tubing sets, and vial stoppers are outside the frame.
Segmentation Overview
- Device Type
- Injectable Delivery Devices
- Inhalation Delivery Devices
- Transdermal Delivery Devices
- Ocular Delivery Devices
- Oral Controlled-Release Systems
- Other Device Types (Implantable Drug Delivery Devices, Nasal Delivery Devices, etc.)
- Route of Administration
- Intravenous
- Subcutaneous
- Intradermal
- Oral
- Others (Pulmonary, Transdermal, etc.)
- Application / Therapeutic Area
- Oncology
- Diabetes
- Respiratory Diseases
- Cardiovascular Diseases
- Auto-immune Diseases
- Other Applications (Infectious Diseases, CNS Disorders, etc.)
- End User
- Hospitals
- Ambulatory Surgical Centers
- Home-Healthcare Settings
- Specialty Clinics
Detailed Research Methodology and Data Validation
Primary Research
We interview device engineers, supply-chain managers, hospital pharmacy buyers, and chronic-care clinicians across the Sunbelt, Great Lakes, and Pacific regions. Their insights on real-world utilization rates, warranty swap-out ratios, and payer pressures fill data gaps and calibrate forecast assumptions.
Desk Research
Mordor analysts comb public datasets from tier-1 agencies such as the CDC, CMS, and the FDA's 510(k)/PMA databases, along with trade bodies like PhRMA and the Advanced Medical Technology Association, to size disease pools and device clearances. We layer that with customs imports (USITC), patent volumes via Questel, and shipment trends in Bestsellingcarsblog-style retail trackers for diabetes pumps and inhalers. Company 10-Ks, investor decks, peer-reviewed journals, and reputable press articles provide pricing corridors and technology-adoption clues. Subscription resources, D&B Hoovers for revenue splits, Dow Jones Factiva for deal flow, and WSTS for semiconductor input costs, anchor manufacturer economics and help us benchmark ASPs. The sources listed here are illustrative; many additional references inform data collection and validation.
Market-Sizing & Forecasting
Our core model begins with a top-down reconstruction of demand using therapy prevalence, treatment eligibility, and device utilization coefficients, which are then validated by select bottom-up supplier roll-ups and sampled ASP × volume checks. Key variables include the insulin-using diabetes population, COPD and severe asthma incidence, oncology biologic infusion sessions, average wearable-injector adoption in home-care settings, and FDA 510(k) clearances for smart inhalers. Multivariate regression, vetted through expert consensus, projects each driver; scenario analysis captures reimbursement or regulatory shifts. Where bottom-up estimates lack granularity, say, private-label patch makers, we interpolate using capacity utilization and material input ratios before reconciling totals.
Data Validation & Update Cycle
Outputs pass variance checks against historical spend, import balances, and quarterly earnings. Senior analysts re-review anomalies, and models refresh annually; interim updates trigger if material recalls, guideline changes, or blockbuster approvals occur. A last-mile validation is completed before every client delivery.
Why Mordor's United States Drug Delivery Devices Baseline Commands Reliability
Published U.S. estimates diverge widely because firms pick different device mixes, pricing ladders, and refresh cadences.
Key gap drivers include narrower or broader scope definitions, assumption of hospital procurement spend as a proxy for patient consumption, and varying treatment of legacy disposables versus smart connected formats. Our approach anchors on patient-level demand, applies transparent ASP scaffolding, and refreshes every twelve months, yielding a balanced, decision-ready baseline.
Benchmark comparison
| Market Size | Anonymized source | Primary gap driver |
|---|---|---|
| USD 51.24 B (2025) | Mordor Intelligence | |
| USD 111.63 B (2024) | Regional Consultancy A | Includes OTC devices and consumer inhalers, expanding scope |
| USD 141.47 B (2025) | Industry Journal B | Uses hospital procurement spend, double-counting consumables |
| USD 22.60 B (2024) | Global Consultancy C | Tracks only smart injectors, excluding traditional segments |
These contrasts show that when scope, variables, and validation rigor differ, numbers swing dramatically. Mordor's disciplined patient-centred build and annual refresh give stakeholders a dependable, transparent starting point.


Key Questions Answered in the Report
How large is the United States drug delivery devices market in 2026?
It is estimated at USD 54.41 billion in 2026, up from USD 51.24 billion in 2025.
Which device type grows fastest to 2031?
Oral controlled-release systems are forecast to rise at 7.32% CAGR through 2031 as peptide tablets gain traction.
Why is subcutaneous delivery gaining share?
Large-volume wearable injectors approved in 2024 enable 5-50 mL biologics to be moved from infusion centers to home use, saving payers facility fees.
What segment drives future revenue growth?
Diabetes devices lead with a projected 9.01% CAGR, driven by the adoption of closed-loop insulin delivery and the expansion of CGM coverage.
How is regulation affecting new product launches?
FDA cybersecurity and human-factors mandates add 6-12 months and USD 2-5 million to each connected-device development cycle.
Which regions see fastest demand expansion?
Sun Belt states with high Medicare Advantage penetration post the quickest unit growth as home-infusion incentives align.
Page last updated on:


