UI/UX Market Size and Share
Market Overview
| Study Period | 2020 - 2031 |
|---|---|
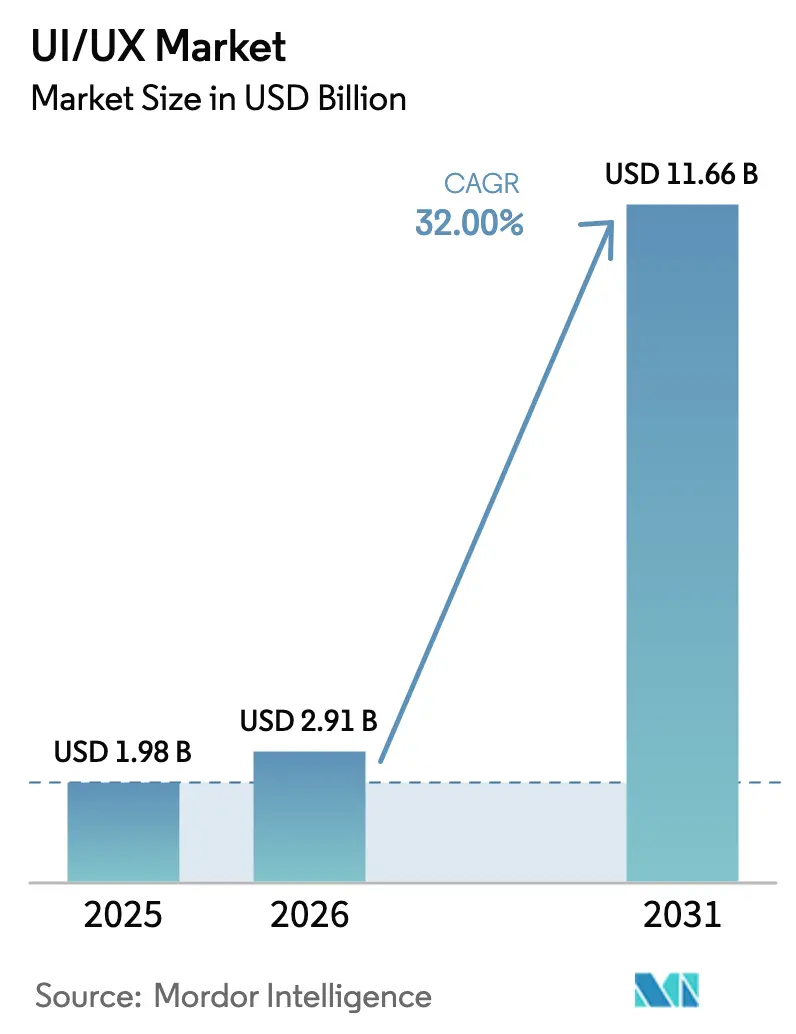
| Market Size (2026) | USD 2.91 Billion |
| Market Size (2031) | USD 11.66 Billion |
| Growth Rate (2026 - 2031) | 32.00% CAGR |
| Fastest Growing Market | Asia Pacific |
| Largest Market | North America |
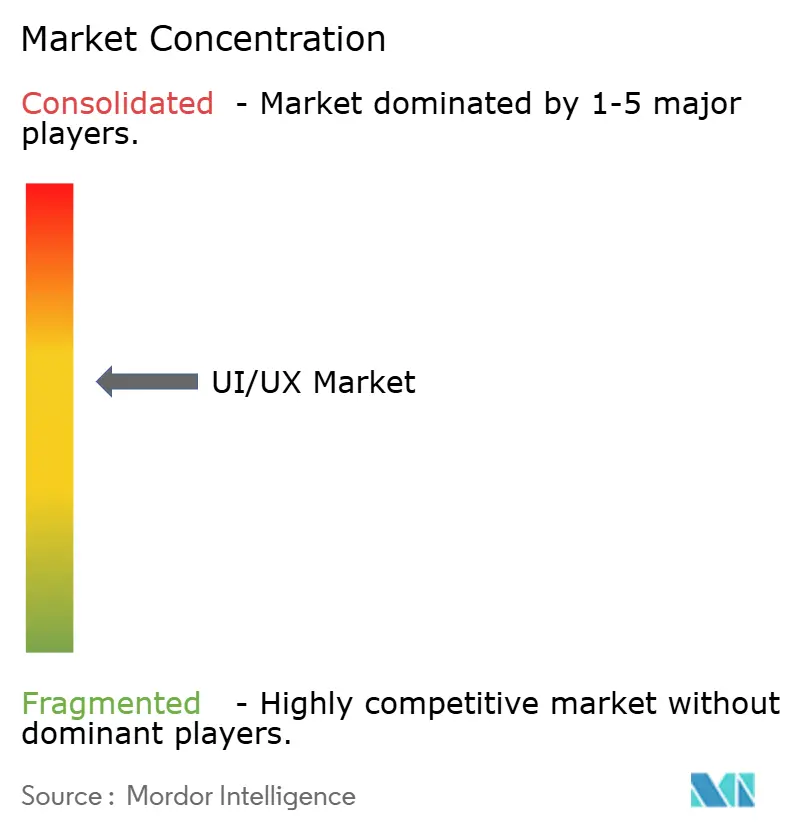
| Market Concentration | Medium |
Major Players *Disclaimer: Major Players sorted in no particular order Image © Mordor Intelligence. Reuse requires attribution under CC BY 4.0. | |
UI/UX Market Analysis by Mordor Intelligence
The UI/UX market size is projected to be USD 1.98 billion in 2025, USD 2.91 billion in 2026, and reach USD 11.66 billion by 2031, growing at a CAGR of 32% from 2026 to 2031. Enterprise leaders elevated design tooling from a downstream task to a board-level growth lever, redirecting budgets away from legacy maintenance and toward experience-layer investments. Spending on digital transformation rose to 7.5% of revenue in 2025 as executives linked interface quality to customer lifetime value. Cloud deployment became the default because distributed teams demanded real-time collaboration, while accessibility mandates and multi-brand design-token frameworks pushed organizations to modernize front-end stacks. Edge-rendered interfaces for low-latency devices, together with the rise of AR and VR design surfaces, revealed critical gaps in traditional on-premises software and accelerated migration to cloud-native platforms.
Key Report Takeaways
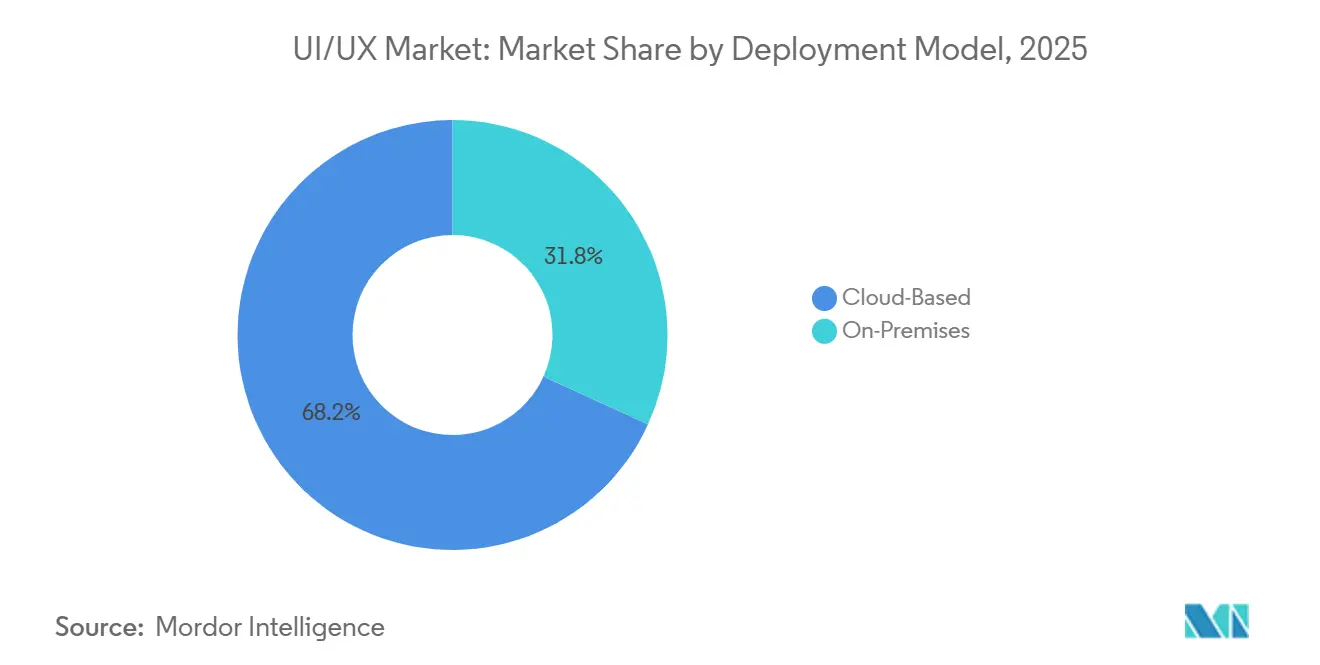
- By deployment model, Cloud-Based solutions led with 68.19% of UI/UX market share in 2025 and are expanding at a 32.98% CAGR through 2031.
- By organization size, Large Enterprises captured 44.33% revenue in 2025, while Small and Micro Enterprises are advancing at a 32.56% CAGR through 2031.
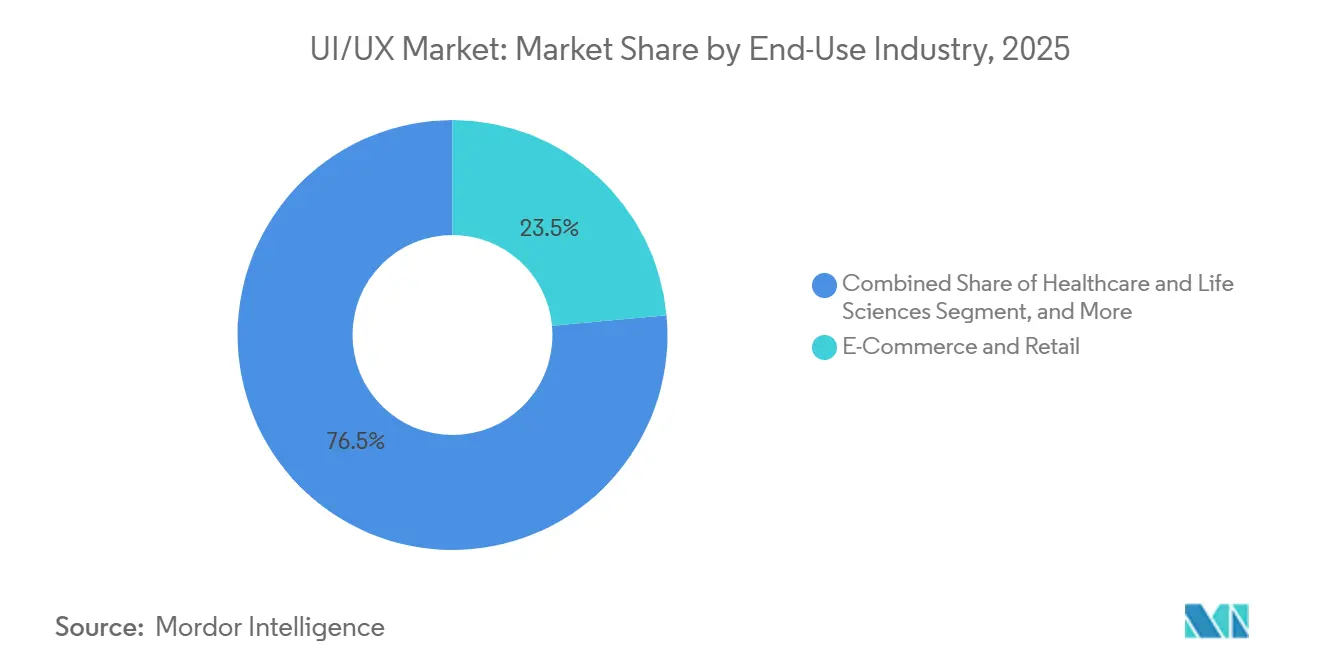
- By end-use industry, E-Commerce and Retail held 23.53% revenue in 2025; Healthcare and Life Sciences is growing fastest at a 32.73% CAGR to 2031.
- By platform, Mobile Applications represented 39.57% of UI/UX market size in 2025, whereas AR/VR and Spatial Interfaces are increasing at a 32.78% CAGR to 2031.
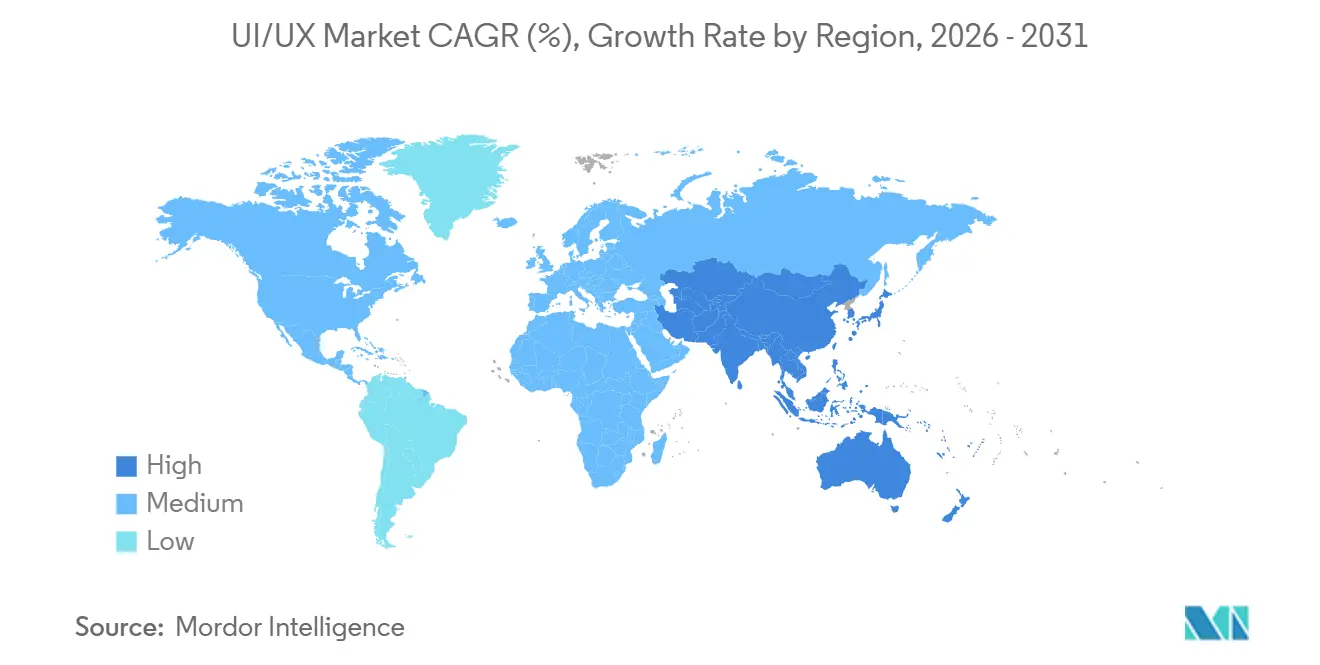
- By geography, North America generated 38.98% of 2025 revenue, and Asia-Pacific is advancing at a 33.01% CAGR over 2026-2031.
Note: Market size and forecast figures in this report are generated using Mordor Intelligence’s proprietary estimation framework, updated with the latest available data and insights as of 2026.
Global UI/UX Market Trends and Insights
Drivers Impact Analysis*
| Driver | (~) % Impact on CAGR Forecast | Geographic Relevance | Impact Timeline |
|---|---|---|---|
| Proliferation of Digital-Transformation Programs | +9.20% | Global, with North America and Europe leading enterprise adoption | Medium term (2-4 years) |
| Surge in Mobile-Commerce Adoption | +7.80% | Asia-Pacific core, spill-over to Middle East and Africa | Short term (≤ 2 years) |
| Enterprise Focus on CX KPIs and NPS | +6.50% | Global, particularly North America and Europe | Medium term (2-4 years) |
| Accessibility Legislation (WCAG 3.0) Redesign Mandates | +4.30% | North America and Europe, expanding to Asia-Pacific | Long term (≥ 4 years) |
| Design Tokens Standardization for Multi-Brand Scalability | +2.10% | Global, with early adoption in North America | Long term (≥ 4 years) |
| Edge-Rendered UI for Low-Latency Devices | +1.80% | Asia-Pacific and North America, IoT-heavy deployments | Long term (≥ 4 years) |
| Source: Mordor Intelligence | |||
Proliferation of Digital-Transformation Programs
Digital-transformation budgets climbed to 7.5% of revenue in 2025, a level Deloitte identified as the breakpoint between CX leaders and laggards.[1]Deloitte, “Digital Transformation Budget Benchmarks,” deloitte.com Technology outlays grew 4.6% that year, and 91% of enterprises intend to raise digital spending in 2026, according to Forrester.[2]Forrester, “2026 Global Digital Business Survey,” forrester.com UI/UX platforms have therefore shifted from discretionary purchases to essential line items locked into multi-year roadmaps. Firms delaying investment risk fragmented web, mobile, and voice journeys that erode customer value gains.
Surge in Mobile-Commerce Adoption
Southeast Asia’s e-commerce gross merchandise value reached USD 185 billion in 2025, with video commerce delivering 25% of transactions and average order values near USD 6-7.[3]Temasek, Google, and Bain and Company, “e-Conomy SEA 2025,” bain.com Mobile-first consumers drove 70% year-over-year growth in visual search, and 62% reported that AI recommendations shaped purchasing choices. Design teams now optimize thumb-zone navigation and conversational checkouts rather than resizing desktop layouts, turning mobile UX into the primary revenue interface.
Enterprise Focus on CX KPIs and NPS
KPMG’s survey of 80,594 consumers across 2,684 brands showed that integrity and personalization explain nearly 39% of NPS variance.[4]KPMG, “Global Customer Experience Excellence 2026,” kpmg.com IDC found that 60% of Global 2000 CMOs will be measured on customer-value outcomes by 2027. As a result, UI/UX budgets align directly with retention metrics instead of qualitative usability scores, making experience teams accountable for growth alongside sales and product units.
Accessibility Legislation (WCAG 3.0) Redesign Mandates
W3C’s WCAG 3.0 draft introduced a maturity model that evaluates cognitive and motor accessibility dimensions. EqualWeb warned that non-compliant sites face legal exposure under ADA and EU rules. Accessibility is moving upstream into component libraries and design tokens, saving enterprises the cost of retrofits and protecting brand reputation.
Restraints Impact Analysis*
| Restraint | (~) % Impact on CAGR Forecast | Geographic Relevance | Impact Timeline |
|---|---|---|---|
| Shortage of Skilled UI/UX Talent | -5.40% | Global, acute in Europe and North America | Short term (≤ 2 years) |
| High Subscription Cost of Premium Tool Suites | -3.20% | Global, particularly impacting small and mid-sized enterprises | Medium term (2-4 years) |
| Algorithmic Bias Risks in AI-Generated UX | -1.80% | Global, with heightened scrutiny in Europe and North America | Medium term (2-4 years) |
| Interoperability Gaps Across AR/VR and Classic Tooling | -1.30% | Global, concentrated in early-adopter segments | Long term (≥ 4 years) |
| Source: Mordor Intelligence | |||
Shortage of Skilled UI/UX Talent
Experis UK reported that 76% of firms struggled to fill UI/UX roles in 2025, and Germany’s gap jumped from 28% to 61% in one year. Autodesk noted a parallel rise in talent scarcity, with 58% of companies citing the shortage as a growth barrier. The mismatch between academic curricula and industry demand forces enterprises to poach scarce specialists or retrain adjacent staff, delaying design-system rollouts and slowing the UI/UX market.
High Subscription Cost of Premium Tool Suites
Integrated cloud toolsets can exceed USD 100 per user each month, a threshold that SMBs find prohibitive. Cost-sensitive firms either rely on limited open-source tools or postpone systematic design investment, leading to inconsistent experiences that undermine brand equity. Emerging-market buyers feel the pain most acutely because USD pricing erodes purchasing power.
*Our forecasts treat driver/restraint impacts as directional, not additive. The impact forecasts reflect baseline growth, mix effects, and variable interactions.
Segment Analysis
By Deployment Model: Cloud Dominance Reshapes Collaboration
Cloud solutions commanded 68.19% UI/UX market share in 2025 and are growing at 32.98% through 2031. Figma recorded 93% adoption at Ramp, a fintech firm, demonstrating that synchronous editing and instant developer handoff drive preference for browser-based platforms. On-premises systems persist in defense, healthcare, and regulated finance, yet hybrid approaches that sync local storage with cloud collaboration are stepping-stones to full migration.
API-enabled design tokens and automated accessibility checks shorten release cycles, while desktop tools require manual file transfers that introduce errors. Vendors are phasing out perpetual licenses in favour of cloud subscriptions, and regulators now accept certified cloud security, eroding the remaining on-premises foothold. Enterprises staying offline face slower iteration and diminished competitiveness, a reality reshaping procurement policy across the UI/UX market.


By Organization Size: SMBs Accelerate as Barriers Fall
Large Enterprises held 44.33% revenue in 2025, leveraging dedicated design-ops teams and volume discounts. Small and Micro Enterprises, however, are set to grow 32.56% annually thanks to no-code builders that remove front-end coding hurdles. The U.S. Chamber of Commerce found that 58% of small businesses used generative AI in 2025, while Canada’s CFIB reported 44% AI adoption among SMBs.
Mid-Sized Enterprises face a pricing squeeze: big enough to need advanced features yet too small for enterprise rates. The UK Digital Adoption Taskforce highlighted cost, skills, and integration as central barriers. Vendors offering tiered plans that align to maturity stages can win across the spectrum, whereas flat enterprise pricing risks ceding the fast-growing SMB slice of the UI/UX market.
By End-Use Industry: Healthcare Overtakes Retail in Growth
E-Commerce and Retail captured 23.53% of 2025 revenue, powered by video commerce and AI recommendations that raised conversion velocity. Healthcare and Life Sciences, though smaller, is expanding 32.73% per year as portals and telemedicine apps move into production. IQVIA linked poor UX to appointment no-shows and medication lapses, making interface quality a care metric rather than a cosmetic feature.
Banking and insurance firms rebuild legacy screens to harmonize security and ease of use, while government portals adopt WCAG-aligned patterns. Education investments cooled after the pandemic boom but continue around adaptive interfaces. The ascent of healthcare signals that clinical outcomes and reimbursement rates now hinge on design quality, raising UI/UX market size relevance across hospital systems.

By Platform: Spatial Interfaces Disrupt 2D Dominance
Mobile Applications owned 39.57% of platform revenue in 2025, reflecting smartphone primacy and thumb-zone ergonomics. Web Applications remain critical for desktop workflows, and Desktop Software persists for heavy compute tasks such as CAD. Voice agents accounted for 22% of Y Combinator’s latest cohort as GPT-4o pricing dropped sharply, enlivening conversational UX experimentation.
AR/VR and Spatial Interfaces will grow 32.78% annually to 2031. Deloitte projects spatial computing at 18.2% annual growth to 2033, and Gartner expects 20% of people to spend at least one hour a day in immersive environments by 2028. A Frontiers review showed users prefer gesture, gaze, and voice inputs to controllers. Designers focused solely on 2D risk obsolescence as spatial UX skill sets become essential in the broader UI/UX industry.
Geography Analysis
North America generated 38.98% of 2025 revenue, anchored by early design-ops adoption, WCAG-driven budgets, and venture funding that clusters around Silicon Valley and New York. Ninety-one percent of enterprises plan higher digital budgets in 2026, ranking CX among the top three priorities. State mandates in California and New York effectively set nationwide accessibility benchmarks, prompting widespread redesign.
Asia-Pacific is expanding at a 33.01% CAGR through 2031, buoyed by a USD 300 billion digital economy and a workforce with 79% AI skill penetration. Regional funding reached USD 8 billion in H1 2025, and data-center capacity is set to rise 180%, supporting AI-heavy design workflows. Country-specific drivers China’s domestic tool ecosystem, Japan’s automotive HMI focus, India’s export-oriented IT services require vendors to localize language, pricing, and cloud integration to capture UI/UX market opportunities.
Europe’s strict privacy and accessibility rules push companies toward localized design systems that bake in GDPR compliance. Germany, France, the UK, Italy, and Spain head spending, while the Nordics and Benelux see fast SMB uptake of no-code tools for government portals. South America, the Middle East, and Africa remain early-stage but are adding pilots in fintech, smart cities, and mobile money. As infrastructure improves, these regions will edge up in total UI/UX market share, although North America and Europe will retain innovation leadership.

Competitive Landscape
The UI/UX market shows moderate fragmentation. Figma, Adobe XD, and Sketch vie for cloud seats, but none dominate every sub-category. Adobe leverages Creative Cloud ties, Microsoft bundles design tools within Office 365, and open-source Penpot appeals to privacy-sensitive buyers. Strategy revolves around plugin ecosystems, API links to CI pipelines, and AI assistants that automate layout or accessibility checks.
Startups use generative AI to skip wireframes and produce code from text prompts. Incumbents counter with embedded AI Adobe Firefly, Figma’s layout suggestions yet risk being unbundled by speed-first newcomers. Interoperability remains a pain point; spatial-design exports rarely fit web or mobile pipelines, so teams juggle parallel workflows. Vendors that standardize design tokens across platforms can lock in de facto standards before formal consortia act.
White space lies in verticalized tooling. Healthcare demands HIPAA-ready component libraries, automotive teams need glanceable in-car patterns, and industrial metaverse builders rely on physics-accurate 3D templates. The breadth of specialized needs ensures continued fragmentation and fuels venture investment, maintaining vigorous competition across the UI/UX market.
UI/UX Industry Leaders
Adobe Inc.
Figma, Inc.
Meta Platforms, Inc.
Designit A/S
Sketch B.V.
- *Disclaimer: Major Players sorted in no particular order

Recent Industry Developments
- January 2026: Microsoft integrated AI design assistants into Power Platform, letting users create responsive interfaces from natural-language prompts, cutting prototype time by 60%.
- December 2026: Adobe launched Firefly 3.0 with real-time generative mockups that observe WCAG 3.0 scores and brand tokens.
- January 2025: Oracle confirmed the Redwood UI transition timeline across Cloud HCM modules, with classic and responsive UIs slated for retirement in release 25C.
- December 2024: AEA Investors merged Huge with Hero Digital, forming a large independent experience-transformation business.


Global UI/UX Market Report Scope
The UI/UX Market Report is Segmented by Deployment Model (Cloud-Based, On-Premises), Organization Size (Large Enterprises, Mid-Sized Enterprises, Small and Micro Enterprises), End-Use Industry (E-Commerce and Retail, Healthcare and Life Sciences, Banking Financial Services and Insurance, Education and EdTech, IT and Telecom, Media and Entertainment, Government and Public Sector, Other End-Use Industries), Platform (Mobile Applications, Web Applications, Desktop Software, Voice and Conversational Interfaces, AR/VR and Spatial Interfaces, Automotive and IoT Displays), and Geography. The Market Forecasts are Provided in Terms of Value (USD).
| Cloud-Based |
| On-Premises |
| Large Enterprises |
| Mid-Sized Enterprises |
| Small and Micro Enterprises |
| E-Commerce and Retail |
| Healthcare and Life Sciences |
| Banking, Financial Services and Insurance |
| Education and EdTech |
| IT and Telecom |
| Media and Entertainment |
| Government and Public Sector |
| Other End-Use Industries |
| Mobile Applications |
| Web Applications |
| Desktop Software |
| Voice and Conversational Interfaces |
| AR/VR and Spatial Interfaces |
| Automotive and IoT Displays |
| North America | United States |
| Canada | |
| Mexico | |
| South America | Brazil |
| Argentina | |
| Chile | |
| Rest of South America | |
| Europe | Germany |
| France | |
| United Kingdom | |
| Russia | |
| Italy | |
| Spain | |
| Rest of Europe | |
| Asia-Pacific | China |
| Japan | |
| India | |
| South Korea | |
| Australia and New Zealand | |
| Rest of Asia-Pacific | |
| Middle East | Saudi Arabia |
| United Arab Emirates | |
| Turkey | |
| Rest of Middle East | |
| Africa | South Africa |
| Nigeria | |
| Kenya | |
| Rest of Africa |
| By Deployment Model | Cloud-Based | |
| On-Premises | ||
| By Organization Size | Large Enterprises | |
| Mid-Sized Enterprises | ||
| Small and Micro Enterprises | ||
| By End-Use Industry | E-Commerce and Retail | |
| Healthcare and Life Sciences | ||
| Banking, Financial Services and Insurance | ||
| Education and EdTech | ||
| IT and Telecom | ||
| Media and Entertainment | ||
| Government and Public Sector | ||
| Other End-Use Industries | ||
| By Platform | Mobile Applications | |
| Web Applications | ||
| Desktop Software | ||
| Voice and Conversational Interfaces | ||
| AR/VR and Spatial Interfaces | ||
| Automotive and IoT Displays | ||
| By Geography | North America | United States |
| Canada | ||
| Mexico | ||
| South America | Brazil | |
| Argentina | ||
| Chile | ||
| Rest of South America | ||
| Europe | Germany | |
| France | ||
| United Kingdom | ||
| Russia | ||
| Italy | ||
| Spain | ||
| Rest of Europe | ||
| Asia-Pacific | China | |
| Japan | ||
| India | ||
| South Korea | ||
| Australia and New Zealand | ||
| Rest of Asia-Pacific | ||
| Middle East | Saudi Arabia | |
| United Arab Emirates | ||
| Turkey | ||
| Rest of Middle East | ||
| Africa | South Africa | |
| Nigeria | ||
| Kenya | ||
| Rest of Africa | ||


Key Questions Answered in the Report
How fast will spending on UI and UX tools grow through 2031?
UI/UX market size is projected to rise from USD 2.91 billion in 2026 to USD 11.66 billion by 2031, reflecting a 32% CAGR during the forecast period.
Which deployment option leads revenue today?
Cloud-Based platforms captured 68.19% UI/UX market share in 2025 because real-time collaboration and version control are essential for distributed teams.
Which end-use sector will expand quickest?
Healthcare and Life Sciences interfaces are forecast to advance at a 32.73% CAGR to 2031 as patient portals and telemedicine shift from pilot to production scale.
Why is Asia-Pacific the fastest growing region?
The region's USD 300 billion digital economy, high smartphone penetration, and large AI-skilled workforce drive a 33.01% CAGR for Asia-Pacific through 2031.
What limits adoption for small firms?
Premium subscription fees over USD 100 per seat per month and scarce in-house designers make full-featured suites difficult for SMBs to justify.
How will spatial computing affect UI/UX teams?
AR/VR and Spatial Interfaces are set to grow 32.78% annually, so teams must learn 3D interaction paradigms or risk falling behind emerging design requirements.
Page last updated on:


