Digital Human Market Size and Share
Market Overview
| Study Period | 2020 - 2031 |
|---|---|
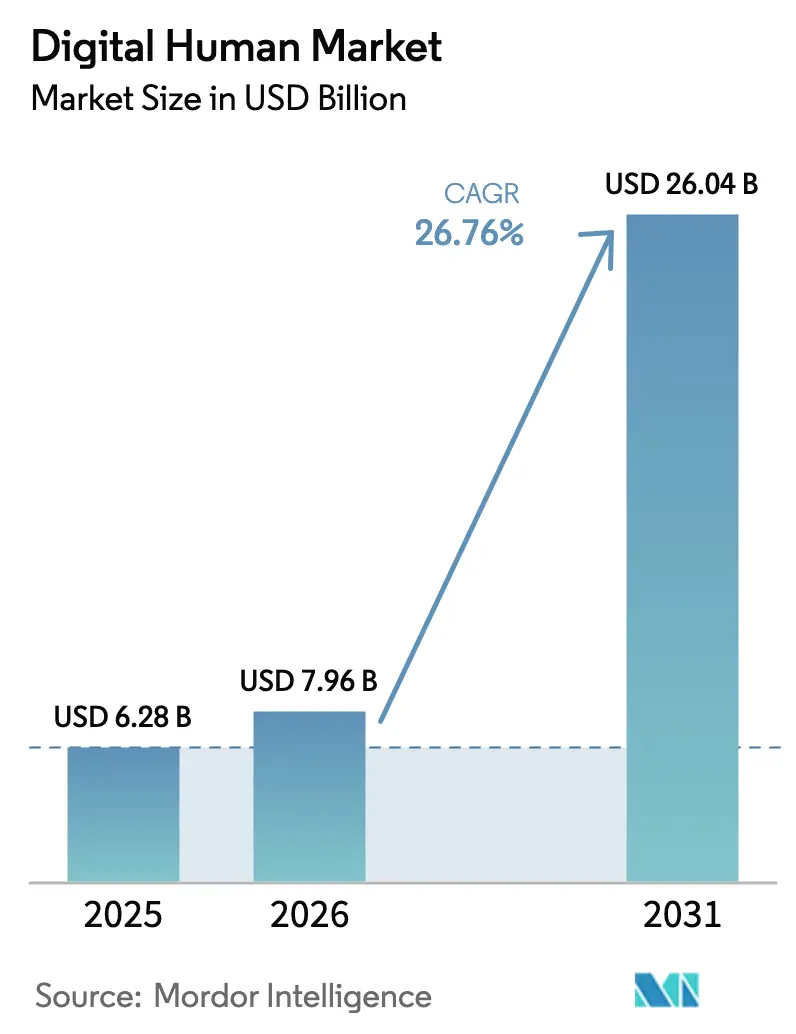
| Market Size (2026) | USD 7.96 Billion |
| Market Size (2031) | USD 26.04 Billion |
| Growth Rate (2026 - 2031) | 26.76% CAGR |
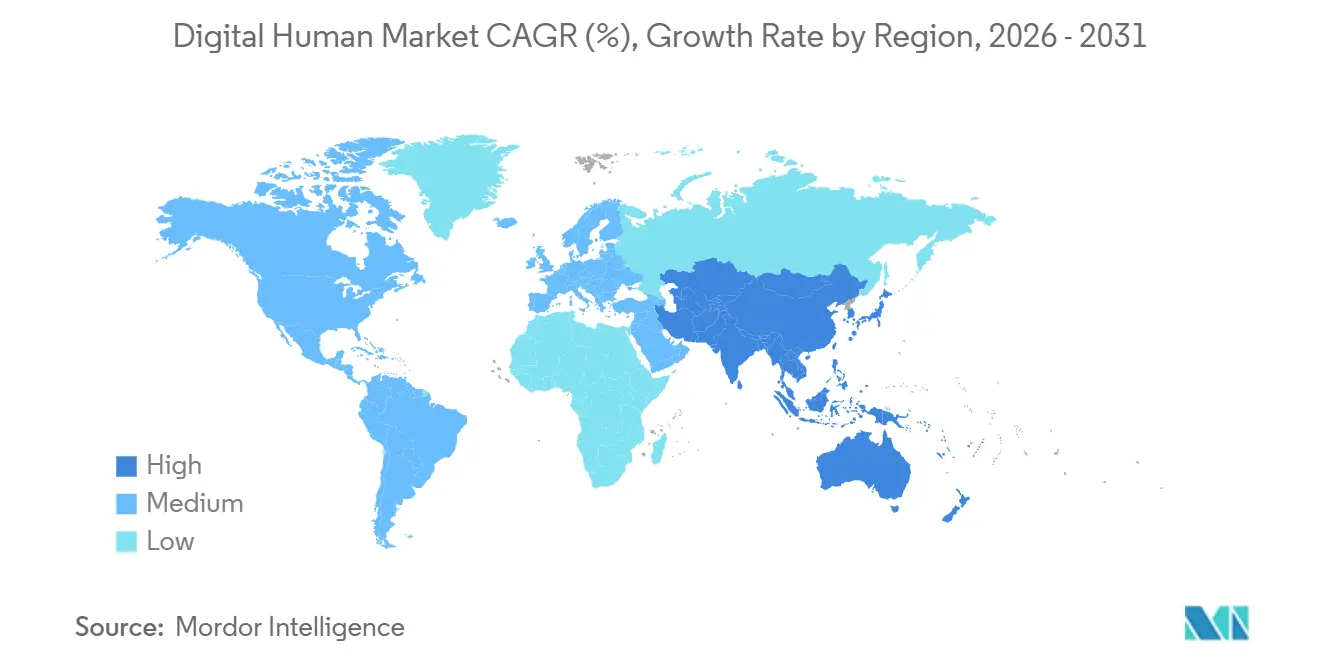
| Fastest Growing Market | Asia Pacific |
| Largest Market | North America |
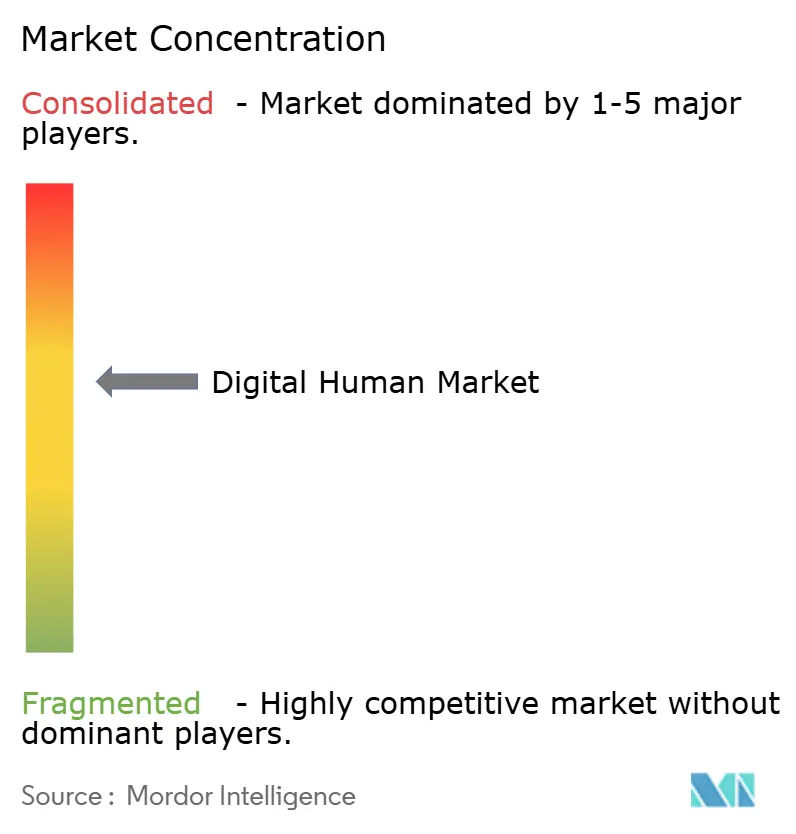
| Market Concentration | Medium |
Major Players*Disclaimer: Major Players sorted in no particular order Image © Mordor Intelligence. Reuse requires attribution under CC BY 4.0. | |
Digital Human Market Analysis by Mordor Intelligence
The Digital Human Market size is expected to increase from USD 6.28 billion in 2025 to USD 7.96 billion in 2026 and reach USD 26.04 billion by 2031, growing at a CAGR of 26.76% over 2026-2031. This rapid climb is driven by enterprises shifting from rule-based chatbots to photorealistic conversational avatars that automate high-touch service interactions. Uptake is further supported by falling GPU inference costs, maturing volumetric-capture pipelines, and rising consumer familiarity with immersive interfaces across gaming, commerce, and telehealth. Strategic bundling of avatar creation tools inside wider AI platforms is compressing deployment timelines, while new regulatory clarity on synthetic media is easing board-level adoption in highly regulated sectors. Competition is intensifying as hyperscalers, game-engine vendors, and niche studios race to secure intellectual property around real-time neural rendering and voice cloning. At the same time, enterprises seek measurable ROI, steering demand toward interactive digital humans that reduce call-center escalations, lift conversion rates, and unlock new subscription revenue.
Key Report Takeaways
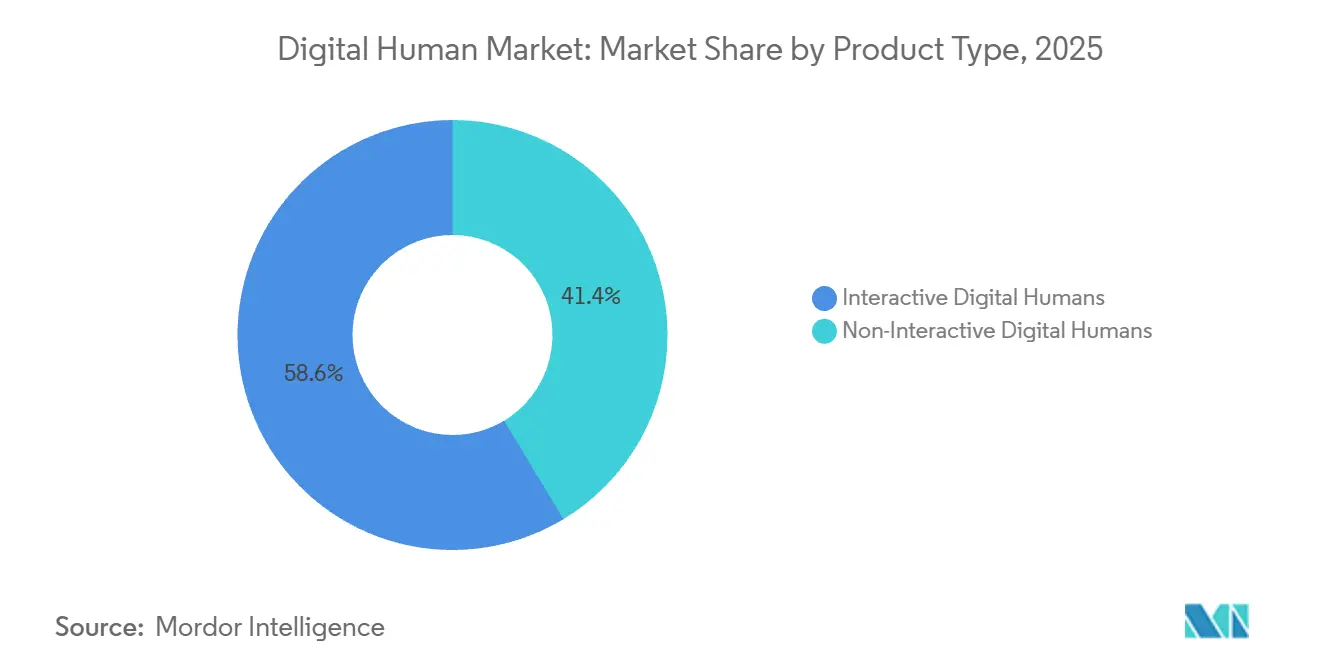
- By product type, interactive avatars led with 58.63% revenue share in 2025, while the same cohort is forecast to advance at a 27.21% CAGR through 2031.
- By component, software platforms accounted for 64.36% of 2025 revenue, whereas services represent the fastest growing component at a 28.51% CAGR to 2031.
- By deployment mode, cloud installations captured 71.12% share in 2025; hybrid models record the highest projected CAGR at 27.18% through 2031.
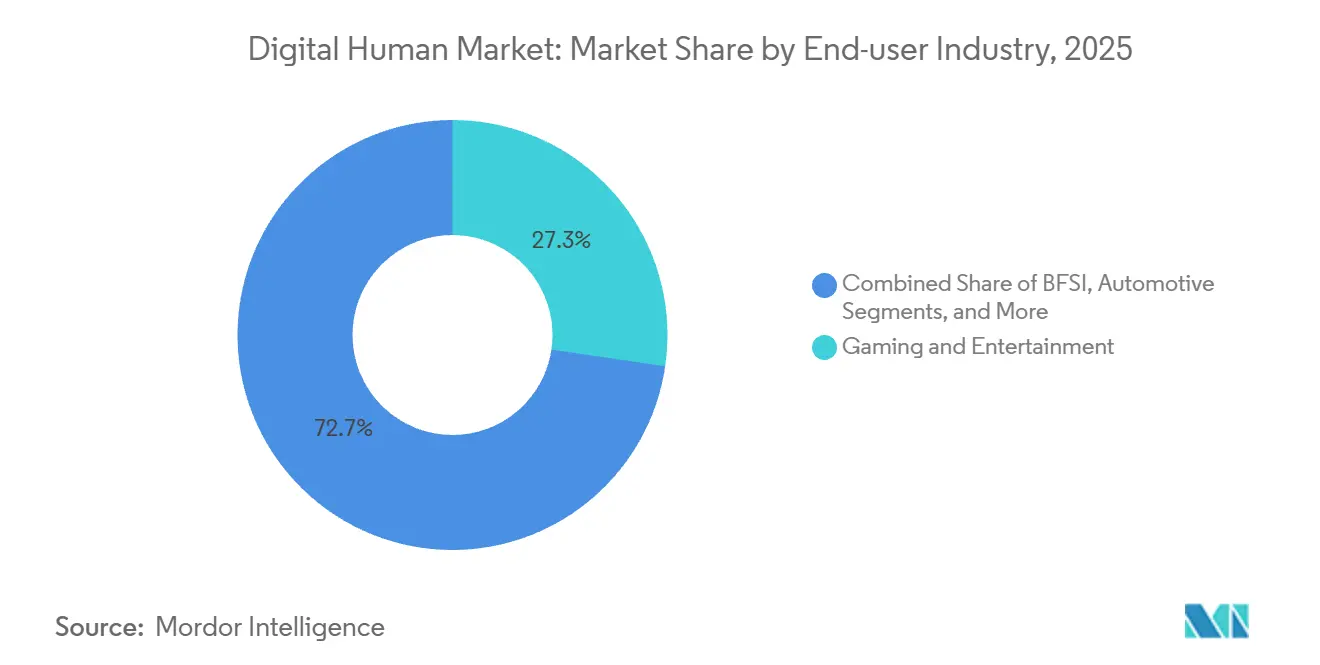
- By end-user industry, gaming and entertainment held 27.33% of 2025 revenue, yet healthcare and life sciences display the steepest CAGR at 29.39% to 2031.
- By technology, generative-AI systems secured 46.41% of 2025 share and are poised to climb at a 27.56% CAGR into 2031.
- By geography, North America dominated with 43.12% of the 2025 base, while Asia-Pacific is on track for the fastest expansion, registering a 28.34% CAGR during the outlook period.
Note: Market size and forecast figures in this report are generated using Mordor Intelligence’s proprietary estimation framework, updated with the latest available data and insights as of January 2026.
Global Digital Human Market Trends and Insights
Driver Impact Analyis*
| Driver | (~) % Impact on CAGR Forecast | Geographic Relevance | Impact Timeline |
|---|---|---|---|
| Rapid Advances in AI, ML, and NLP | +4.8% | Global, concentrated in North America and Asia-Pacific | Medium term (2-4 years) |
| Surge in E-Learning Platform Adoption | +3.2% | Global, strong in Asia-Pacific and Europe | Short term (≤ 2 years) |
| Metaverse-Led Demand for Immersive Engagement | +3.9% | North America and Asia-Pacific core, spillover to Middle East | Medium term (2-4 years) |
| Personalised Digital Customer-Experience Boom | +4.1% | Global, led by North America and Europe | Short term (≤ 2 years) |
| Agentic AI Enabling Autonomous Journeys | +5.3% | North America and Europe, early Asia-Pacific adoption | Medium term (2-4 years) |
| Spatial-Computing and Volumetric Capture | +2.7% | North America and Europe, emerging in Asia-Pacific | Long term (≥ 4 years) |
| Source: Mordor Intelligence | |||
Rapid Advances in AI, ML, and NLP
Transformer and diffusion architectures reduced inference latency below the 200 millisecond threshold that users perceive as real time, unlocking enterprise budgets beyond premium concierge scenarios. Real-time speech-to-animation engines such as Audio2Face compress production cycles from 12 weeks to 72 hours, allowing banks, retailers, and airlines to roll out avatar assistants at network scale. Intent recognition accuracy climbed from 78% to 94% in multi-turn dialogs, cutting call-center escalations by 23% among early adopters in telecommunications. The performance gain directly correlates with lower total cost of ownership, reinforcing the growth trajectory of the digital human market.
Surge in E-Learning Platform Adoption
Online degree enrollment stabilizing at 37% of tertiary intake in 2025 is propelling demand for avatar tutors that replicate face-to-face engagement.[1]UNESCO Institute for Statistics, “Global Education Trends 2025,” uis.unesco.org Universities across India and Southeast Asia now rely on vernacular-language digital humans to bridge faculty shortages, while corporate academies deploy scenario-based avatars for compliance training. Contract values surpass USD 150,000 per deployment, compared with USD 40,000 for generic chatbots, underscoring the monetization potential of verticalized avatars. This accelerates platform revenue and strengthens the service layer of the digital human market.
Metaverse-Led Demand for Immersive Engagement
The installed base of spatial-computing headsets topped 8 million by late 2025, giving brands a critical mass of users for persistent avatar storefronts in virtual worlds. Luxury pilots show avatar-guided sessions converting at 19% versus 11% for standard e-commerce, attributing uplift to social proof and real-time personalization. Gaming studios integrate digital humans as memory-driven NPCs, heightening user retention and in-game spending. Rising acceptance scores from 62% in 2024 to 81% in 2025 indicate diminishing uncanny-valley concerns, further boosting the digital human market’s adoption curve.
Agentic AI Enabling Autonomous Customer Journeys
Agentic architectures empower avatars to rebook flights, file insurance claims, and schedule follow-ups without human escalation, lifting autonomous resolution rates to 67% in travel and hospitality pilots. Labor savings reach USD 2.8 million annually for a mid-sized airline, illustrating tangible ROI. Regulatory frameworks now clarify oversight requirements, prompting wider experimentation in healthcare and banking where decision autonomy demands auditable guardrails. These capabilities accelerate enterprise migration toward interactive deployments, amplifying the digital human market size.
Restraint Impact Analysis*
| Restraint | (~) % Impact on CAGR Forecast | Geographic Relevance | Impact Timeline |
|---|---|---|---|
| High Development and Real-Time Rendering Costs | -3.4% | Global, acute in Latin America and Africa | Short term (≤ 2 years) |
| Regulatory Uncertainty on Deepfake Rights | -2.1% | North America, Europe, emerging in Asia-Pacific | Medium term (2-4 years) |
| Talent Shortage in Real-Time 3D Skills | -1.8% | Europe, Latin America, Middle East and Africa | Medium term (2-4 years) |
| Uncanny-Valley and Consumer-Trust Issues | -1.3% | Global, pronounced in older demographics | Short term (≤ 2 years) |
| Source: Mordor Intelligence | |||
High Development and Real-Time Rendering Costs
Production-grade avatars require motion-capture hardware, GPU clusters, and specialized talent, pushing upfront investment to USD 250,000-USD 800,000 per engagement. Cloud rendering lowers capex yet introduces recurring fees of USD 4-USD 12 per avatar-hour on hyperscale platforms, limiting feasibility for high-traffic consumer use cases. The supply constraint on H100 GPUs, priced near USD 30,000, compounds cost pressure and dampens near-term uptake, particularly in Latin America and Africa.
Regulatory Uncertainty on Deep-Fake, Replica Rights
The EU AI Act mandates watermarking of synthetic media, while California’s AB 2602 criminalizes unauthorized voice cloning, generating compliance overhead for provenance tracking and consent management. Ambiguities around derivative likeness slow advertising and entertainment deployments. Multinationals face legal fragmentation as data trained in permissive jurisdictions may breach stricter regimes upon cross-border use, tempering growth in the digital human market share across sensitive applications.[2]Federal Trade Commission, “Guidance on AI Endorsements,” ftc.gov
*Our forecasts treat driver/restraint impacts as directional, not additive. The impact forecasts reflect baseline growth, mix effects, and variable interactions.
Segment Analysis
By Product Type: Interactive Avatars Drive Enterprise Adoption
Interactive avatars led the digital human market share at 58.63% in 2025 and are expected to grow at a 27.21% CAGR through 2031. Banking pilots show branch-level wealth advisors resolving account tasks via natural voice commands, while retailers record 17% higher conversion when shoppers engage avatars for at least 90 seconds. Early cost gaps between interactive and scripted video avatars are narrowing as generative tooling automates lip-sync and emotion mapping. Enterprises value continuous learning, sentiment-aware comportment, and application integration that interactive avatars provide, extending deployments into healthcare triage and airline disruption recovery. Non-interactive formats still serve seasonal marketing campaigns where pristine visuals and storyline control outweigh real-time interaction, but their addressable share is contracting as the digital human market scales interactive use cases.
Interactive avatars require real-time synthesis for voice, facial micro-expressions, and gesture alignment, demanding GPU acceleration and robust conversational stacks. Service-level agreements guarantee sub-300 millisecond response to sustain immersion, pushing vendors toward edge-rendering architectures in high-traffic geographies. Privacy-centric industries adopt hybrid pipelines that keep biometric inference on-premises while offloading volumetric animation to cloud GPUs. Over the forecast horizon, interactive avatars will anchor platform roadmaps, reinforcing their status as the revenue and growth engine of the digital human market.


By Component: Services Surge as Customization Complexity Rises
Software platforms accounted for 64.36% of revenue in 2025, encompassing engine licenses, model hosting, and analytics dashboards. Yet services are tracking the highest CAGR at 28.51% as enterprises contract specialists to localize avatars, fine-tune emotion engines, and align domain lexicons with compliance codebooks. The rise of generative-AI frameworks accelerates demand for prompt engineering, ethical testing, and model retraining, which are sold as premium professional services. Small and medium enterprises procure template avatars on a subscription basis, but regulated verticals continue to solicit bespoke projects, elevating average deal sizes.
Skill shortages in real-time rigging and shader programming fuel the service upswing. Studios bundle human-in-the-loop animation review alongside synthetic-data generation, reinforcing service attachment rates above 45% per software sale. Hardware revenues remain modest yet stable, driven by niche on-premises demands in defense, healthcare, and automotive infotainment. Over the forecast horizon, the interplay of platform and service revenues will determine vendor profitability, but services will likely outpace software topline, cementing their strategic role in the digital human market.
By Deployment Mode: Hybrid Models Balance Latency and Compliance
Cloud deployments held a commanding 71.12% share in 2025 thanks to elastic GPU provisioning and turnkey integration with enterprise identity providers. However, the digital human market size for hybrid architectures is forecast to expand at a 27.18% CAGR, reflecting regulatory pushback against off-sovereign data flows. European banks now process biometrics on private clusters while streaming avatar frames from public clouds, thereby satisfying GDPR mandates without sacrificing visual fidelity.
Latency-sensitive scenarios such as in-vehicle assistants favor edge inference, where Qualcomm and NVIDIA embedded AI accelerators in automotive head units to execute speech and gesture recognition locally. Defense and healthcare continue to pilot air-gapped installations that keep inference, rendering, and data storage behind zero-trust perimeters. The deployment spectrum is thus diversifying, with workload partitioning becoming a competitive differentiator among platform vendors seeking to capture a larger slice of the digital human market.
By End-User Industry: Healthcare Overtakes Gaming in Growth Velocity
Gaming and entertainment supplied 27.33% of 2025 revenue, leveraging decades-old real-time rendering pipelines and player familiarity with character-driven storytelling. Yet healthcare and life sciences, at a 29.39% CAGR, are set to outstrip all other verticals, pushed by telemedicine reimbursement and FDA clarity on AI-driven decision support.[3]U.S. Food and Drug Administration, “AI/ML-Enabled Medical Devices List,” fda.gov Emergency departments deploying triage avatars report 22% nurse workload reduction, validating clinical ROI.
Retail and e-commerce adopt digital stylists to reduce return rates, while banking introduces avatar advisors for mass-affluent portfolios. Education leverages vernacular tutors to extend STEM content to underserved regions, and automotive brands integrate in-car avatars as part of next-generation infotainment. The digital human market size is therefore diversifying across use cases, but healthcare’s outsized forecast growth positions it as the primary demand catalyst over the next five years.

By Technology: Generative-AI Platforms Eclipse Rule-Based Systems
Generative-AI engines captured 46.41% of 2025 revenue and are scaling at a 27.56% CAGR. Enterprises gravitate toward avatars that interpret open-ended queries and synthesize empathetic responses without exhaustive scripting. Large language models, vision encoders, and speech synthesizers merge into multimodal stacks that deliver contextually rich interactions in more than 100 languages.
Rule-based avatars retain importance where deterministic outputs, audit trails, and hardcoded compliance are mandated, such as pharmaceutical counseling. High-fidelity real-time renderers remain indispensable in advertising and film, where visual excellence supersedes conversational intelligence. Hybrid systems now combine generative cognition with rule-bound guardrails and cinematic rendering, broadening the total addressable digital human market.
Geography Analysis
North America held 43.12% of the 2025 base, underpinned by the heavy capital expenditure of hyperscalers on AI infrastructure and a relatively clear regulatory environment following California’s voice-cloning statute and FTC guidance on synthetic endorsements. Canada emerged as a volumetric-capture hub, servicing Hollywood and enterprise content creators seeking tax incentives and diverse talent pools. Mexico’s nearshoring wave attracted avatar studios offering Spanish-language localization at cost advantages, deepening North American ecosystem integration.
Asia-Pacific is the fastest growing region, projected at a 28.34% CAGR through 2031. China’s 14th Five-Year Plan lists digital humans as a strategic pillar, channeling subsidies toward domestic platforms and volumetric-capture facilities.[4]Ministry of Industry and Information Technology, “14th Five-Year Plan Digital Human Inclusion,” miit.gov.cn Japanese prefectures subsidize elder-care companion avatars to mitigate caregiver shortages, while South Korean entertainment giants deploy virtual influencers across global fan platforms. India’s edtech boom leverages avatar tutors to deliver vernacular STEM lessons, especially in rural states with low English proficiency. The regional mix of consumer scale, sovereign AI funding, and demographic imperatives positions Asia-Pacific as a pivotal growth engine for the digital human market.
Europe, the Middle East, and Africa collectively contribute 35-40% of current revenue but present heterogeneous adoption patterns. The EU AI Act imposes transparency labelling, increasing compliance costs yet offering regulatory certainty that favors long-term enterprise investment. Germany’s automotive sector pioneers in-car avatar assistants; France and the United Kingdom see BFSI pilots that blend avatars into omnichannel client journeys. Gulf Cooperation Council states invest in multilingual tourism ambassadors to realize Vision 2030 diversification goals, whereas sub-Saharan Africa experiments with agricultural advisory avatars funded by development agencies. Infrastructure constraints and GPU scarcity temper immediate adoption in low-income economies, but strategic donor support and mobile-first deployment models may unlock latent demand over the forecast horizon.

Competitive Landscape
The digital human market exhibits moderate fragmentation, with the top 10 vendors accounting for roughly 55-60% of total revenue, leaving ample room for regional and vertical specialists. Hyperscalers integrate avatar capabilities within broader AI portfolios, leveraging scale advantages in GPU procurement and model training. Microsoft couples GPT-4 Turbo, Speech, and Vision APIs with its Digital Human SDK, spurring 34% year-over-year growth in Azure AI billings during 2025. NVIDIA marries RTX GPUs and Omniverse software, underscoring hardware-software co-optimization that rivals find challenging to replicate.
Specialists differentiate through domain depth and compliance tooling. Soul Machines, UneeQ, and Synthesia embed industry lexicons, audit logging, and sentiment calibration tailored to finance, healthcare, and education. Patent filings underscore strategic intent: NVIDIA secured 47 real-time neural rendering patents in 2025, while Meta Platforms lodged 38 covering codec avatars and volumetric compression at the U.S. Patent and Trademark Office.
White-space opportunities persist among mid-market firms that require turnkey avatars yet are unwilling to fund bespoke builds. No-code builders such as Hour One and DeepBrain AI offer subscription models starting at USD 500 per month, democratizing access. Mergers and acquisitions are expected as hyperscalers acquire niche studios to accelerate go-to-market velocity and close talent gaps, echoing Microsoft’s 2024 purchase of speech-synthesis innovator Lobe AI. Over the forecast window, strategic control of generative language stacks, real-time rendering pipelines, and compliance infrastructure will delineate market leaders and influence consolidation patterns within the digital human market.
Digital Human Industry Leaders
Microsoft Corporation
Nvidia Corporation
Meta Platforms, Inc.
Samsung Electronics Co., Ltd.
Tencent Holdings Ltd.
- *Disclaimer: Major Players sorted in no particular order

Recent Industry Developments
- October 2025: NVIDIA launched ACE, an integrated avatar cloud engine combining Audio2Face, Riva speech AI, and Omniverse rendering, shortening production timelines from weeks to hours. Early customers span telecommunications and retail.
- September 2025: Meta released Codec Avatars 2.0, capturing facial micro-expressions and fabric dynamics in real time while cutting bandwidth by 65% over 5G networks.
- August 2025: Synthesia secured USD 90 million Series C funding to expand its AI video platform to 140 languages and enterprise-grade features.
- July 2025: Microsoft integrated Azure OpenAI Service with its Digital Human SDK, offering GPT-4 Turbo powered avatars pre-wired to Dynamics 365 and Teams.


Research Methodology Framework and Report Scope
Market Definitions and Key Coverage
Our study defines the digital human market as all software-driven, life-like avatars that blend 3-D modeling, real-time rendering, speech synthesis, computer vision, and conversational AI to let users see, hear, and interact with a virtual person in commercial settings such as customer support, gaming, retail, and training. According to Mordor Intelligence, revenue is booked at the platform or module creator level, covering license fees, recurring SaaS subscriptions, and avatar-specific implementation services.
Scope exclusion: only text-based chatbots and generic game characters without AI-enabled facial or speech animation sit outside this assessment.
Segmentation Overview
- By Product Type
- Interactive Digital Humans
- Non-Interactive Digital Humans
- By Component
- Software Platforms
- Services
- Hardware Modules
- By Deployment Mode
- Cloud-Based
- On-Premises
- Hybrid
- By End-User Industry
- Retail and E-Commerce
- Gaming and Entertainment
- BFSI
- Education and E-Learning
- Automotive
- Healthcare and Life Sciences
- Travel and Hospitality
- Telecom and Media
- Other End-User Industries
- By Technology
- Generative-AI Digital Humans
- Rule-Based / NLP-Driven Digital Humans
- Real-Time Rendering Engine Digital Humans
- By Geography
- North America
- United States
- Canada
- Mexico
- South America
- Brazil
- Argentina
- Rest of South America
- Europe
- United Kingdom
- Germany
- France
- Spain
- Italy
- Rest of Europe
- Asia-Pacific
- China
- India
- Japan
- Australia
- South Korea
- Rest of Asia-Pacific
- Middle East
- Saudi Arabia
- United Arab Emirates
- Turkey
- Rest of Middle East
- Africa
- South Africa
- Kenya
- Rest of Africa
- North America
Detailed Research Methodology and Data Validation
Primary Research
Interviews and structured surveys with avatar platform founders, CGI studio leads, enterprise buyers in retail, healthcare, and telecom, plus regional AI regulators supplied firsthand inputs on average selling price ranges, deployment volumes, and roadmap constraints. This allowed us to tighten desk-based assumptions and close data gaps across North America, Europe, and Asia-Pacific.
Desk Research
We began with open datasets that map the digital experience stack, such as the US Bureau of Labor Statistics software employment files, World Bank ICT adoption indicators, and OECD Broadband Portal bandwidth series, to anchor our user and spending pools. Analyst teams next mined trade sources like the VR/AR Association white papers, Khronos Group engine adoption metrics, WIPO patent counts on avatar animation, and filings in the SEC EDGAR and SEDAR portals to gauge vendor scale and pricing moves. Paid libraries from D&B Hoovers and Dow Jones Factiva helped us cross-check company revenues and flag outliers in fast-growing private players. The sources cited here are illustrative; many additional public and subscription sets fed our desk analysis.
Market-Sizing & Forecasting
A top-down build starts with worldwide software spending that is filtered by immersive media share, then by avatar penetration rates gathered during primary work. The resulting value pool is tested through selective bottom-up roll-ups of leading supplier revenues and sampled contract sizes. Key variables feeding the model include GPU shipment trends, 3-D engine license counts, average SaaS price per avatar seat, number of conversational AI deployments, and regulatory approvals for synthetic likeness use. Forecasts run on a multivariate regression that links those drivers to adoption curves, and scenario analysis adjusts for GPU supply shocks or sudden policy shifts. When bottom-up evidence diverges by over ten percent, we reconcile using weighted averages aligned to verified invoices or audited statements.
Data Validation & Update Cycle
Before sign-off, outputs pass variance checks against external indices, peer review by a senior analyst, and reconfirmation calls with two industry experts. We refresh each model annually and trigger interim updates if funding spikes, landmark regulations, or M&A events alter baseline assumptions.
Why Mordor's Digital Human Baseline Commands Reliability
Published estimates often vary because publishers pick different revenue layers, technology mixes, and update cadences.
We anchor on a narrowly defined, license-level scope and an annually refreshed driver set, which keeps our 2025 market value grounded and reproducible for decision makers.
Benchmark comparison
| Market Size | Anonymized source | Primary gap driver |
|---|---|---|
| USD 6.27 B (2025) | Mordor Intelligence | - |
| USD 23.93 B (2024) | Regional Consultancy A | Adds VR hardware and engine royalties beyond avatar software |
| USD 31.50 B (2024) | Global Consultancy B | Blends synthetic voice platforms and consumer game spend, double counting portions |
| USD 50.26 B (2025) | Trade Journal C | Relies on shipment conversion factors without primary validation and folds in maintenance services |
The comparison shows that larger figures stem from broader scopes or unvetted multipliers, whereas Mordor's disciplined mix of desk evidence, on-ground interviews, and reconciliation steps yields a balanced, transparent baseline that clients can trace back to clear variables and repeatable logic.


Key Questions Answered in the Report
What is the projected value of the digital human market in 2031?
The digital human market is forecast to reach USD 26.04 billion by 2031 at a 26.76% CAGR.
Which region is expected to grow fastest?
Asia-Pacific shows the highest growth trajectory, posting a 28.34% CAGR through 2031 on the back of sovereign AI mandates and aging-care programs.
Which end-user segment will expand most rapidly?
Healthcare and life sciences lead with a 29.39% CAGR, fueled by telemedicine reimbursement and FDA guidance on AI clinical support.
Why are interactive avatars preferred over non-interactive formats?
Interactive avatars enable two-way, real-time engagement that cuts call-center escalations, lifts conversion rates, and supports autonomous task completion.
What are the key cost impediments to adoption?
High expenses for motion-capture hardware, GPU clusters, and specialized talent push initial investment up to USD 800,000 for enterprise-grade deployments.
How are regulations influencing market adoption?
Frameworks like the EU AI Act and California’s AB 2602 require transparency and consent, adding compliance overhead but also providing clearer guardrails for long-term investment.
Page last updated on:


