User Experience Market Size and Share
Market Overview
| Study Period | 2020 - 2031 |
|---|---|
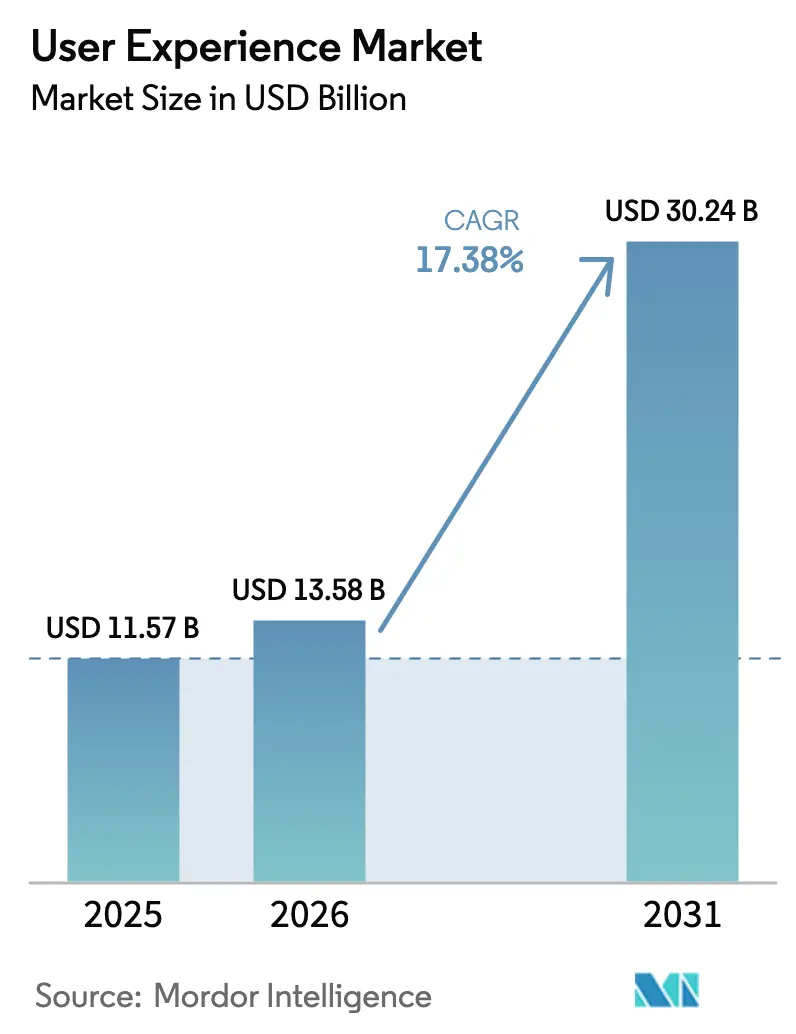
| Market Size (2026) | USD 13.58 Billion |
| Market Size (2031) | USD 30.24 Billion |
| Growth Rate (2026 - 2031) | 17.38% CAGR |
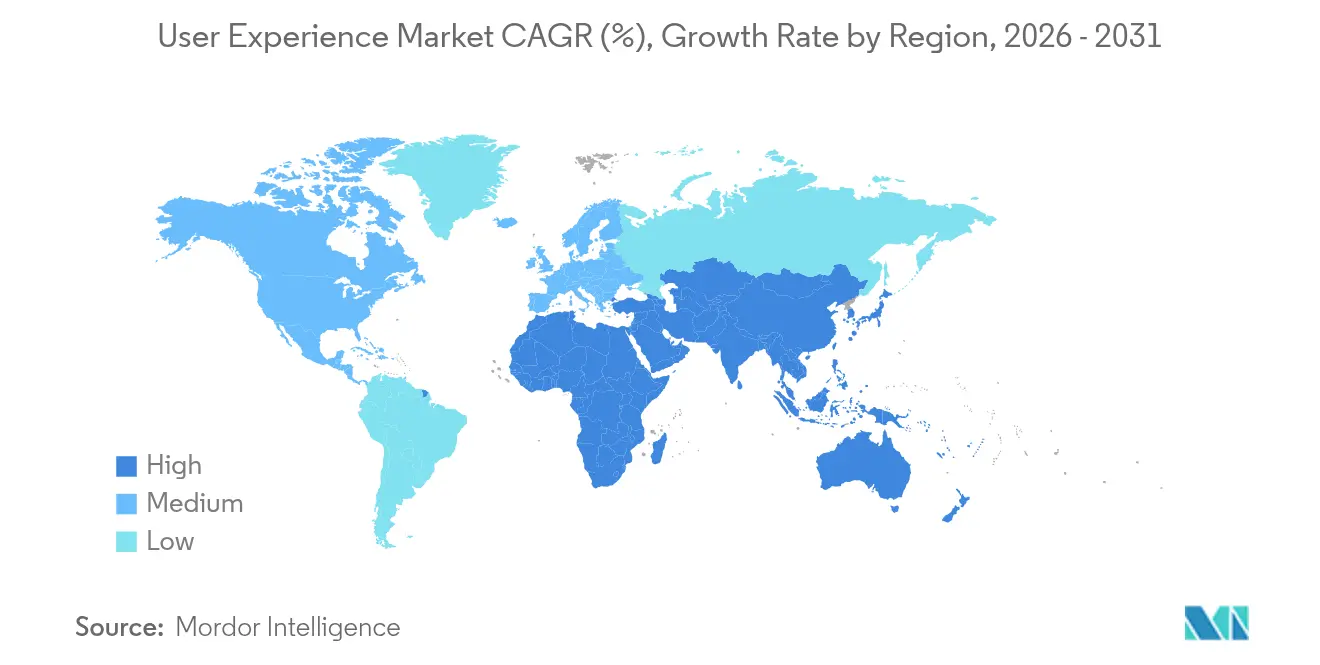
| Fastest Growing Market | Asia Pacific |
| Largest Market | North America |
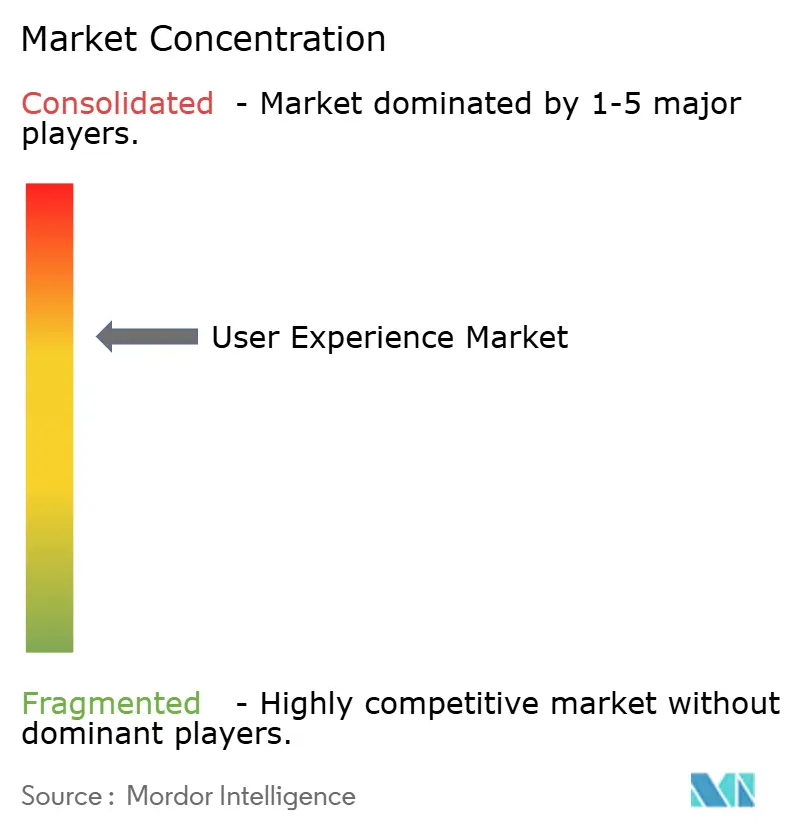
| Market Concentration | Medium |
Major Players *Disclaimer: Major Players sorted in no particular order Image © Mordor Intelligence. Reuse requires attribution under CC BY 4.0. | |
User Experience Market Analysis by Mordor Intelligence
User experience market size in 2026 is estimated at USD 13.58 billion, growing from 2025 value of USD 11.57 billion with 2031 projections showing USD 30.24 billion, growing at 17.38% CAGR over 2026-2031. Strong growth reflects the board-level acceptance that user-centric design is a revenue driver, as digital-first models become the standard. Mandatory accessibility rules, rapid adoption of generative AI in design workflows, and the rise of Total Experience programmes that merge customer and employee budgets are expanding addressable demand. Cloud deployment dominates because distributed teams need real-time collaboration, while capability-building engagements gain traction as enterprises internalise UX skills. Regionally, North America leads, but Asia-Pacific’s mobile-centric boom is closing the gap. Intensifying competition is fragmenting margins, even as IT services majors buy specialist studios to build full-stack experience offerings.
Key Report Takeaways
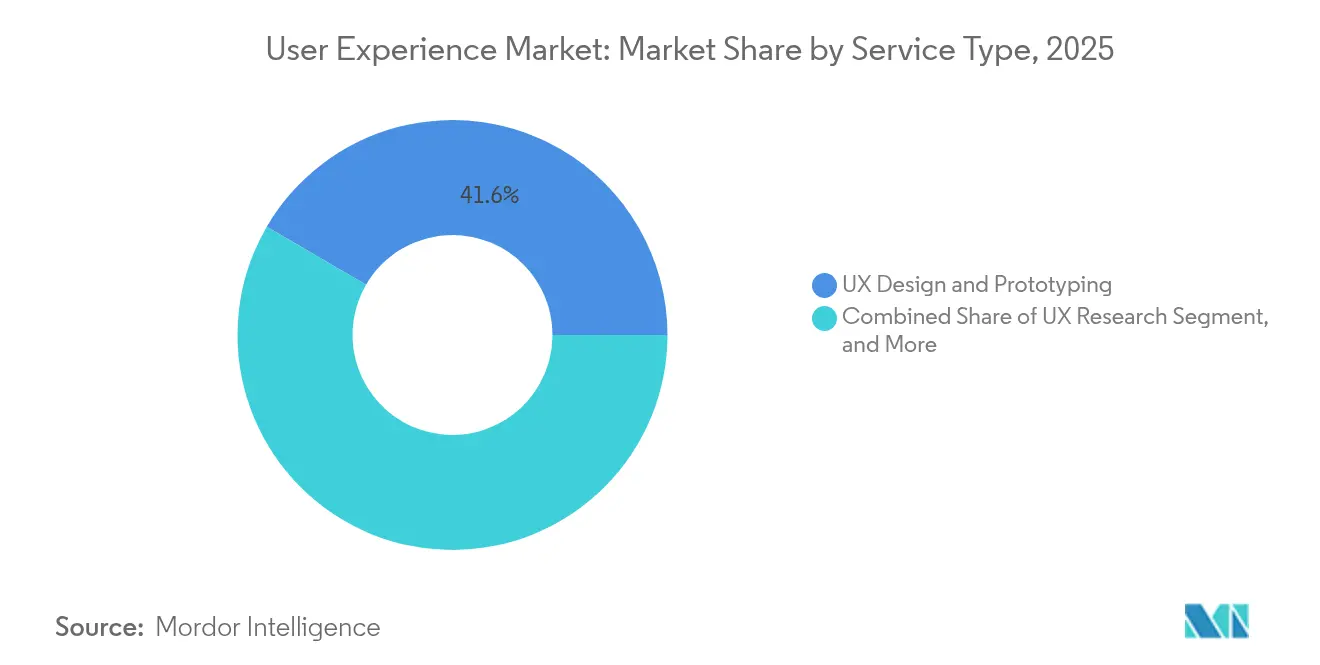
- By service type, UX design and prototyping led the user experience market with a 41.60% share in 2025; UX Training and upskilling are projected to expand at 17.95% CAGR through 2031.
- By deployment, the cloud-based segment accounted for a 62.30% share of the user experience market size in 2025 and is projected to advance at a 17.60% CAGR through 2031.
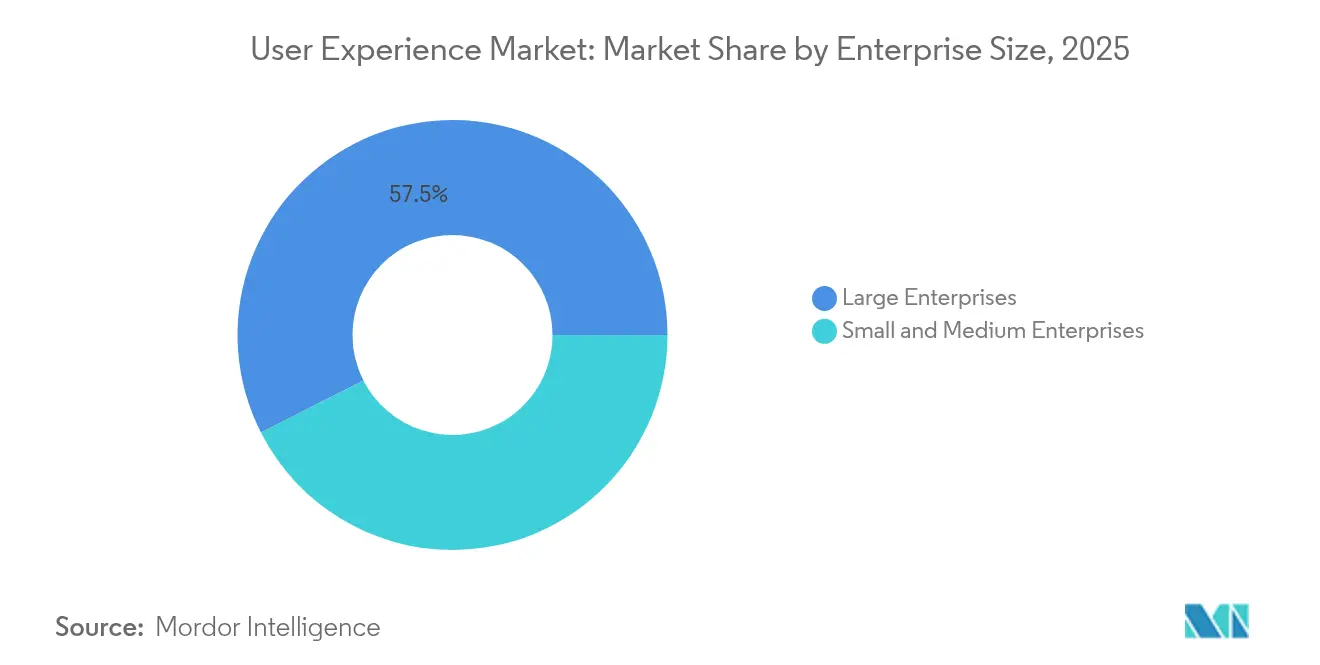
- By enterprise size, large enterprises held 57.50% of the user experience market share in 2025, while SMEs recorded the fastest CAGR at 18.06% to 2031.
- By industry vertical, retail and e-commerce captured 25.70% of the user experience market size in 2025; healthcare and life sciences are projected to grow at 18.75% CAGR between 2026 and 2031.
- By geography, North America commanded a 37.60% revenue share in 2025, while the Asia-Pacific region showed the highest regional CAGR of 19.10% over the forecast period.
Note: Market size and forecast figures in this report are generated using Mordor Intelligence’s proprietary estimation framework, updated with the latest available data and insights as of 2026.
Global User Experience Market Trends and Insights
Drivers Impact Analysis*
| Driver | (~) % Impact on CAGR Forecast | Geographic Relevance | Impact Timeline |
|---|---|---|---|
| Digital-first enterprise reinvention programmes | +4.20% | Global, with concentration in North America and Europe | Medium term (2-4 years) |
| Smartphone and mobile-app ubiquity | +3.80% | APAC core, spill-over to MEA and Latin America | Short term (≤ 2 years) |
| Mandatory accessibility compliance (WCAG 2.2+) | +2.90% | North America and EU regulatory zones | Medium term (2-4 years) |
| Generative-AI design automation adoption | +3.10% | Global, early adoption in North America | Short term (≤ 2 years) |
| Total-Experience (TX) convergence budgets | +2.40% | Global enterprise markets | Long term (≥ 4 years) |
| Rising UX tooling ROI visibility (ResearchOps) | +1.80% | North America and Europe mature markets | Medium term (2-4 years) |
| Source: Mordor Intelligence | |||
Digital-first Enterprise Reinvention Programmes
Long-range digital transformation is shifting UX engagements from one-off projects to multi-year partnerships embedded in core operations. Apparel brand Hanesbrands deepened work with Wipro to optimise customer touchpoints and operations. The IRS Direct File programme shows how iterative design inside government can make tax filing markedly easier for citizens. Total Experience budgets blend customer and employee initiatives, enlarging deal sizes and aligning UX with enterprise KPI suites. [1]Wipro Ltd., “Hanesbrands & Wipro: Advancing Digital Transformation Services,” wipro.com
Smartphone and Mobile-app Ubiquity
Mobile-first traffic dominates in Asia-Pacific, driving demand for interfaces that perform across device and bandwidth constraints. Goodpatch’s Tokyo studio enlarged its internship intake to hone mobile UX skills for culturally localised apps. Clients seek cross-platform design systems spanning iOS, Android, and PWAs to assure consistency.
Mandatory Accessibility Compliance (WCAG 2.2+)
Regulations such as the European Accessibility Act force organisations to bake inclusive design into every sprint. HCLTech highlights accessibility as one of five technology megatrends shaping 2025. U.S. Digital Response secured a USD 1 million Google.org grant to build AI-powered language-access tools, signalling non-discretionary spend on accessible interfaces.
Generative-AI Design Automation Adoption
AI tools are moving from pilot to production. Kaizen Platform relaunched its portfolio around AI-driven “Magical UX” with performance-based pricing to lower entry costs. Practitioner uptake of AI in research rose from 20% to 56% in a single year, reshaping workflows.
Restraints Impact Analysis*
| Restraint | (~) % Impact on CAGR Forecast | Geographic Relevance | Impact Timeline |
|---|---|---|---|
| SME budget compression and price sensitivity | -2.10% | Global, particularly acute in emerging markets | Short term (≤ 2 years) |
| Scarcity of senior UX talent in Tier-2 cities | -1.70% | North America and Europe secondary markets | Medium term (2-4 years) |
| Ethical / privacy push-back on data-driven UX | -0.90% | EU and privacy-conscious regions | Long term (≥ 4 years) |
| Algorithmic bias risk in AI-generated UX | -0.60% | Global regulatory environments | Medium term (2-4 years) |
| Source: Mordor Intelligence | |||
SME Budget Compression and Price Sensitivity
SaaS inflation lifted software cost per employee to USD 9,100 in 2025, forcing smaller firms to stretch funds. Vendors are responding with modular, performance-linked contracts and AI-assisted delivery to keep UX within reach of budget-pressed clients. [2]Vertice, “SaaS Inflation Index Report,” vertice.one
Scarcity of Senior UX Talent in Tier-2 Cities
Layoffs and geographic clustering of experts push rates higher outside tech hubs. Providers are scaling remote-first models and mentoring programmes to bridge capability gaps while leveraging AI tools that amplify junior output.
*Our forecasts treat driver/restraint impacts as directional, not additive. The impact forecasts reflect baseline growth, mix effects, and variable interactions.
Segment Analysis
By Service Type: Design and Prototyping Dominance Faces Training Disruption
UX Design and Prototyping held 41.60% of the user experience market share in 2025 as enterprises favour deliverables that pass directly to engineering teams. Yet the training segment’s 17.95% CAGR shows organisations investing in in-house skills. Members Co., Ltd. launched the “nu. Design Company” studio to furnish end-to-end design support and coaching. This shift signals a long-term shift from transactional outsourcing to capability-building engagements that underpin continuous improvement of the customer experience.
Enterprises also continue to invest in UX Research, as well as audits and testing to validate designs against data and compliance goals. Strategy and Consulting remains a high-margin niche where senior practitioners map UX to revenue impact. Together, these offerings anchor multi-year frameworks rather than isolated redesigns, deepening vendor–client lock-in.


By Deployment: Cloud Supremacy Accelerates Digital Transformation
Cloud-based delivery represented 62.30% of the user experience market size in 2025 and is expected to grow at a 17.60% CAGR. Remote collaboration norms, real-time co-design, and centrally managed design systems make the cloud the default. Government agencies adopting a cloud-first modernization approach achieved productivity gains and tighter security, as demonstrated in a fleet-management revamp led by Guidehouse. On-premises solutions persist in highly regulated sectors but are steadily ceding share as hybrid models mature.
Cloud-native UX platforms bundle design, research, and project management in a unified workspace. Providers that offer platform-plus-services propositions capture recurring revenue and deepen data integration, giving them an edge over tool-agnostic competitors.
By Enterprise Size: Large Enterprise Stability Versus SME Growth Acceleration
Large enterprises retained a 57.50% market share of the user experience market in 2025, driven by the rollout of multi-region Total Experience initiatives. Their budgets support integrated roadmaps across web, mobile, contact centre, and employee portals. SME demand, however, is set to rise fastest, at a 18.06% CAGR, as AI lowers tool costs and vendors pioneer outcome-based contracts. Japan’s Ministry of Economy, Trade, and Industry underscores the leadership’s role in SME digital transformation, expanding the addressable base for UX partners.
Distinct buying criteria split the segments; enterprises require deep governance and vendor co-innovation, while SMEs prioritise quick wins and predictable spend. Providers who tailor their engagement and pricing models to each cohort will unlock above-average growth.
By Industry Vertical: Retail Leadership Challenged by Healthcare Acceleration
Retail and e-commerce drove 25.70% of the user experience market size in 2025 as omni-channel competition hinged on frictionless journeys and hyper-personalisation. The healthcare and life sciences sectors are accelerating at a 18.75% CAGR due to the optimisation of telehealth and patient-experience regulations. Hospital groups that redesigned appointment flows posted measurable satisfaction gains, validating ROI.
BFSI sustains investment in merging legacy systems with digital self-service, while IT and telecom firms utilize UX to simplify 5G and cloud-network offerings. Government adoption is climbing via citizen-experience portals, reinforced by official design-system guidelines from Japan’s digital agency. Media and entertainment companies are reworking their interfaces to retain streaming subscribers, fueling demand for cross-vertical services.
Geography Analysis
North America’s 37.60% share stems from mature digital infrastructure and strict accessibility regulations. The IRS Direct File project showed how usability improvements lift public-service KPIs.
Yet, the Asia-Pacific will post the fastest 19.10% CAGR through 2031, thanks to the ubiquity of smartphones and government digitization drives. Indian UI/UX revenues are heading toward USD 18.5 billion as cost-efficient studios specialise in mobile user journeys.
Europe is growing steadily under the European Accessibility Act, with privacy-centric design gaining increasing importance. Middle East smart-city initiatives also champion UX; GCC countries already record 81% digital-government satisfaction, well above global averages. Providers must strike a balance between global scale and local empathy to capitalize on these diverse opportunities.

Competitive Landscape
Competition is fragmented but tightening. IT services majors are bundling UX into transformation deals, exemplified by Accenture’s USD 81 billion in bookings that fund GenAI capability purchases. HCLTech, named the fastest-growing IT brand after a 17% value jump, credits GenAI-infused UX delivery for differentiation. Wipro’s planned USD 40 million acquisition of Applied Value Technologies underscores a race to fuse operational excellence with design consulting.
Specialist agencies respond by automating commoditised tasks and pivoting toward strategic work. Kaizen Platform’s AI-centred, performance-priced “Magical UX” product typifies this shift. ResearchOps maturation offers a white-space niche; firms that systematise insights and quantify ROI can command premium retainers. Meanwhile, AI-native entrants use low-overhead models to undercut incumbents on cost, pushing the market toward outcome-based billing.
Overall, providers that combine human creativity, domain expertise, and platform-level automation appear best positioned to win large, multi-year contracts while sustaining acceptable margins.
User Experience Industry Leaders
Accenture plc
IBM iX (IBM Corp.)
Cognizant Technology Solutions Corp.
Deloitte Digital
Capgemini SE (frog)
- *Disclaimer: Major Players sorted in no particular order

Recent Industry Developments
- January 2025: HCLTech emerged as the world’s fastest-growing IT services brand with 17% brand-value growth to USD 8.9 billion, attributing momentum to GenAI-enhanced UX delivery.
- January 2025: HCLTech and Microsoft deepened partnership to apply generative AI and cloud tooling in contact-centre modernisation, strengthening multi-industry experience capabilities
- December 2024: Wipro extended the completion date for its USD 40 million acquisition of Applied Value Technologies to Jan 31, 2025, amid regulatory procedures.
- October 2024: HCLTech secured USD 2.2 billion in Q2 deals focused on data and AI, digital engineering, and SAP migration, bolstering GenAI-driven UX offerings.


Global User Experience Market Report Scope
User experience encompasses all the interactions a user has with a product or service. It is the personal, internal experience that customers undergo when using a product's interface. It encompasses all aspects of the end-user's interaction with the company, its services, and its products.
User Experience Market Segmented by Service Type (UX Research, UX Design and Prototyping, UX Audit and Testing, UX Strategy and Consulting, and UX Training and Upskilling), Deployment (Cloud-Based, and On-Premises), Enterprise Size (Large Enterprises, SMEs), Industry Vertical (BFSI, Retail and E-Commerce, Healthcare and Life Sciences, IT and Telecommunications, Government and Public Sector, and Media and Entertainment), and Geography (North America, Europe, Asia-Pacific, South America, the Middle East, and Africa). The market sizes and forecasts are provided in terms of value (USD) for all the above segments.
| UX Research |
| UX Design and Prototyping |
| UX Audit and Testing |
| UX Strategy and Consulting |
| UX Training and Upskilling |
| Cloud-based |
| On-premises / Self-hosted |
| Large Enterprises ( ≥1000 FTE) |
| Small and Medium Enterprises ( <1000 FTE) |
| BFSI |
| Retail and E-commerce |
| Healthcare and Life Sciences |
| IT and Telecommunications |
| Government and Public Sector |
| Media and Entertainment |
| North America | United States |
| Canada | |
| Mexico | |
| Europe | United Kingdom |
| Germany | |
| France | |
| Italy | |
| Rest of Europe | |
| Asia-Pacific | China |
| Japan | |
| India | |
| South Korea | |
| Rest of Asia-Pacific | |
| Middle East | Israel |
| Saudi Arabia | |
| United Arab Emirates | |
| Turkey | |
| Rest of Middle East | |
| Africa | South Africa |
| Egypt | |
| Rest of Africa | |
| South America | Brazil |
| Argentina | |
| Rest of South America |
| By Service Type | UX Research | |
| UX Design and Prototyping | ||
| UX Audit and Testing | ||
| UX Strategy and Consulting | ||
| UX Training and Upskilling | ||
| By Deployment | Cloud-based | |
| On-premises / Self-hosted | ||
| By Enterprise Size | Large Enterprises ( ≥1000 FTE) | |
| Small and Medium Enterprises ( <1000 FTE) | ||
| By Industry Vertical | BFSI | |
| Retail and E-commerce | ||
| Healthcare and Life Sciences | ||
| IT and Telecommunications | ||
| Government and Public Sector | ||
| Media and Entertainment | ||
| By Geography | North America | United States |
| Canada | ||
| Mexico | ||
| Europe | United Kingdom | |
| Germany | ||
| France | ||
| Italy | ||
| Rest of Europe | ||
| Asia-Pacific | China | |
| Japan | ||
| India | ||
| South Korea | ||
| Rest of Asia-Pacific | ||
| Middle East | Israel | |
| Saudi Arabia | ||
| United Arab Emirates | ||
| Turkey | ||
| Rest of Middle East | ||
| Africa | South Africa | |
| Egypt | ||
| Rest of Africa | ||
| South America | Brazil | |
| Argentina | ||
| Rest of South America | ||


Key Questions Answered in the Report
What is the current size of the User Experience Services Market?
The market is valued at USD 13.58 billion in 2026 and is projected to reach USD 30.24 billion by 2031.
Which service segment is growing fastest?
UX Training and Upskilling records the highest CAGR at 17.95% as enterprises build internal design capabilities.
How dominant is cloud-based deployment?
Cloud deployment held 62.30% of User Experience Services market share in 2025 and is set to grow at a 17.60% CAGR.
Which region will expand most rapidly?
Asia-Pacific shows the highest regional CAGR of 19.10% through 2031, propelled by mobile-first demand and digitisation mandates.
Why are accessibility regulations important for UX spending?
Mandates like WCAG 2.2+ create non-discretionary budgets for inclusive design, ensuring steady demand even during economic slowdowns.
How is AI reshaping the User Experience Services industry?
Generative-AI tools are automating research and design tasks, lowering delivery costs and prompting providers to shift toward strategic, value-added consulting.
Page last updated on:


