Generative Design Market Size and Share
Market Overview
| Study Period | 2020 - 2031 |
|---|---|
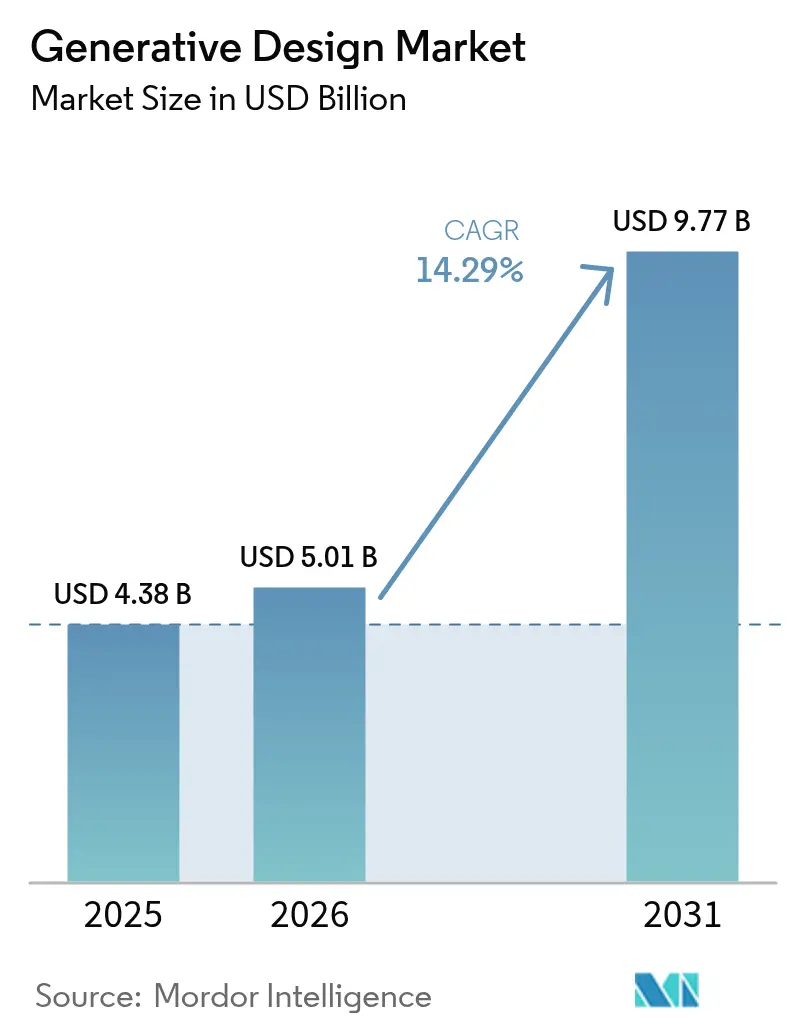
| Market Size (2026) | USD 5.01 Billion |
| Market Size (2031) | USD 9.77 Billion |
| Growth Rate (2026 - 2031) | 14.29% CAGR |
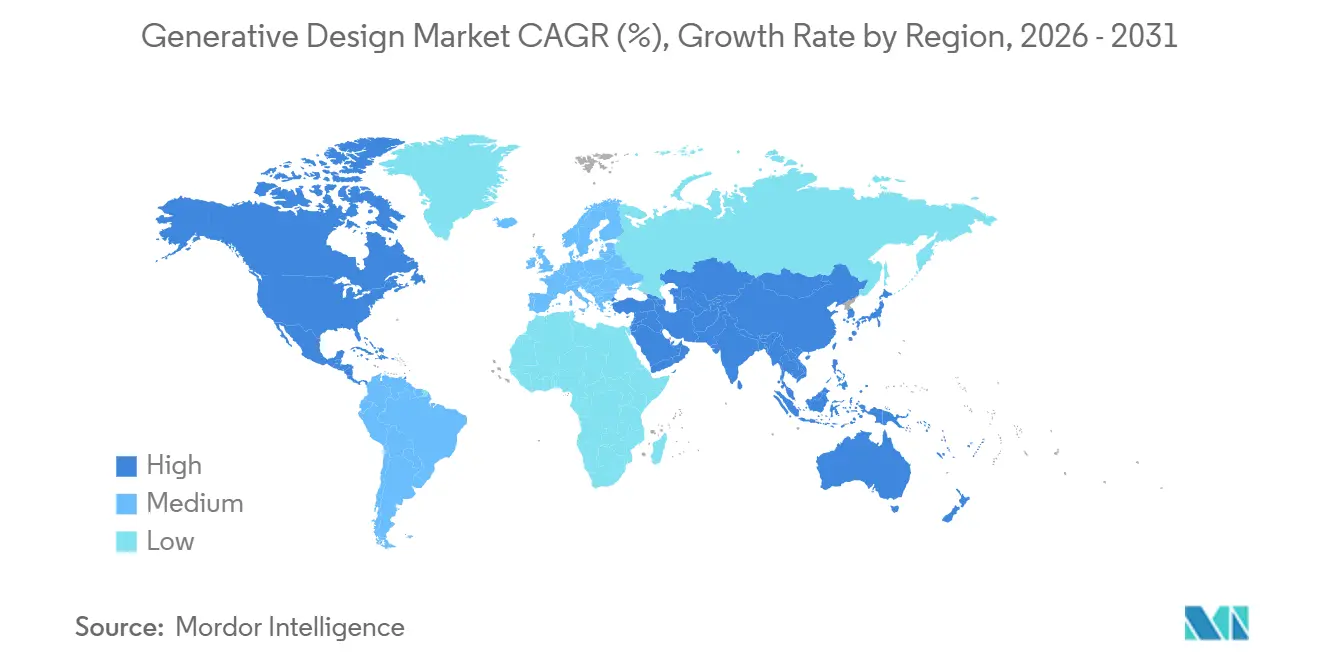
| Fastest Growing Market | Asia Pacific |
| Largest Market | North America |
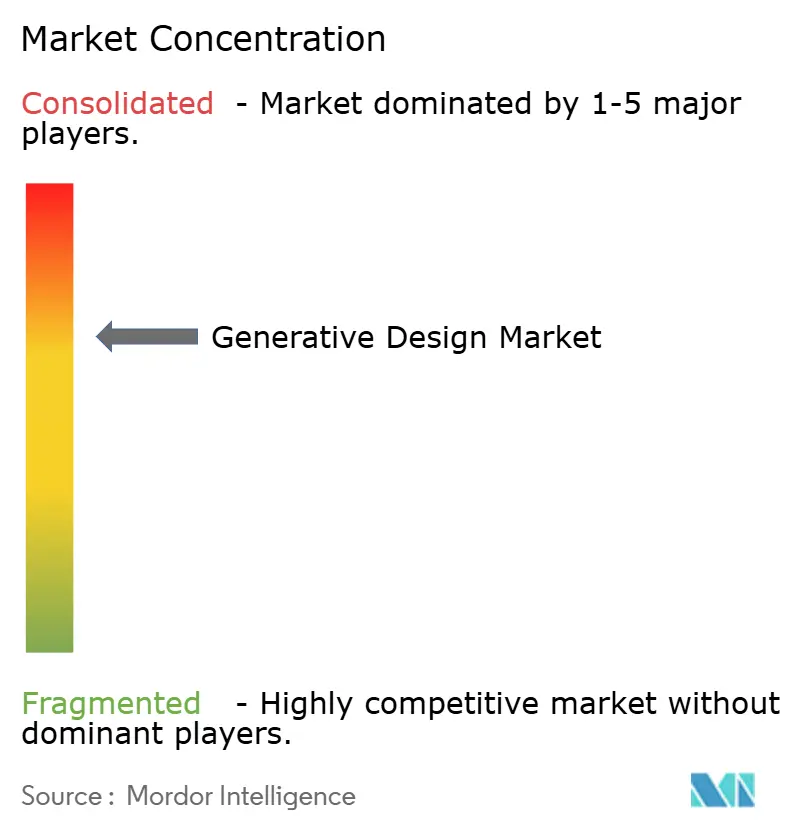
| Market Concentration | Medium |
Major Players *Disclaimer: Major Players sorted in no particular order Image © Mordor Intelligence. Reuse requires attribution under CC BY 4.0. | |
Generative Design Market Analysis by Mordor Intelligence
The generative design market size is projected to expand from USD 4.38 billion in 2025 and USD 5.01 billion in 2026 to USD 9.77 billion by 2031, registering a CAGR of 14.29% between 2026 and 2031. Robust demand stems from lightweighting mandates in transportation, tighter sustainability regulations, and the steady migration of design workloads to cloud-based high-performance computing. Vendors continue to embed artificial intelligence into topology optimization engines, shortening iteration cycles and broadening adoption among small and medium manufacturers. At the same time, tie-ups with additive manufacturing equipment suppliers are removing manufacturing bottlenecks, while updated FDA and FAA guidance has clarified approval pathways for safety-critical parts. Competitive differentiation is shifting toward domain-specific algorithm libraries, packaged consulting services, and seamless integration with product lifecycle management platforms, all of which reinforce long-term switching costs for enterprise buyers.
Key Report Takeaways
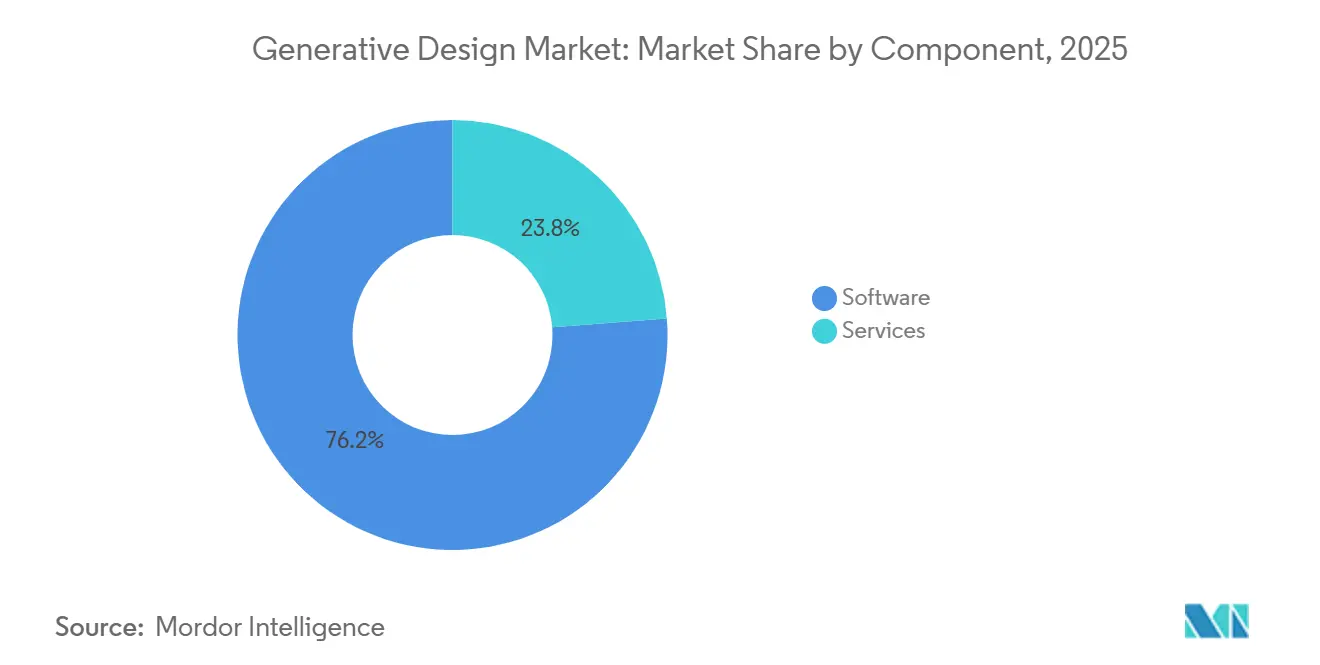
- By component, software licenses commanded 76.23% of spending in 2025, while the services segment is advancing at a 14.67% CAGR through 2031.
- By deployment, cloud accounted for 62.49% of the generative design market share in 2025 and is projected to grow at a 14.61% CAGR through 2031.
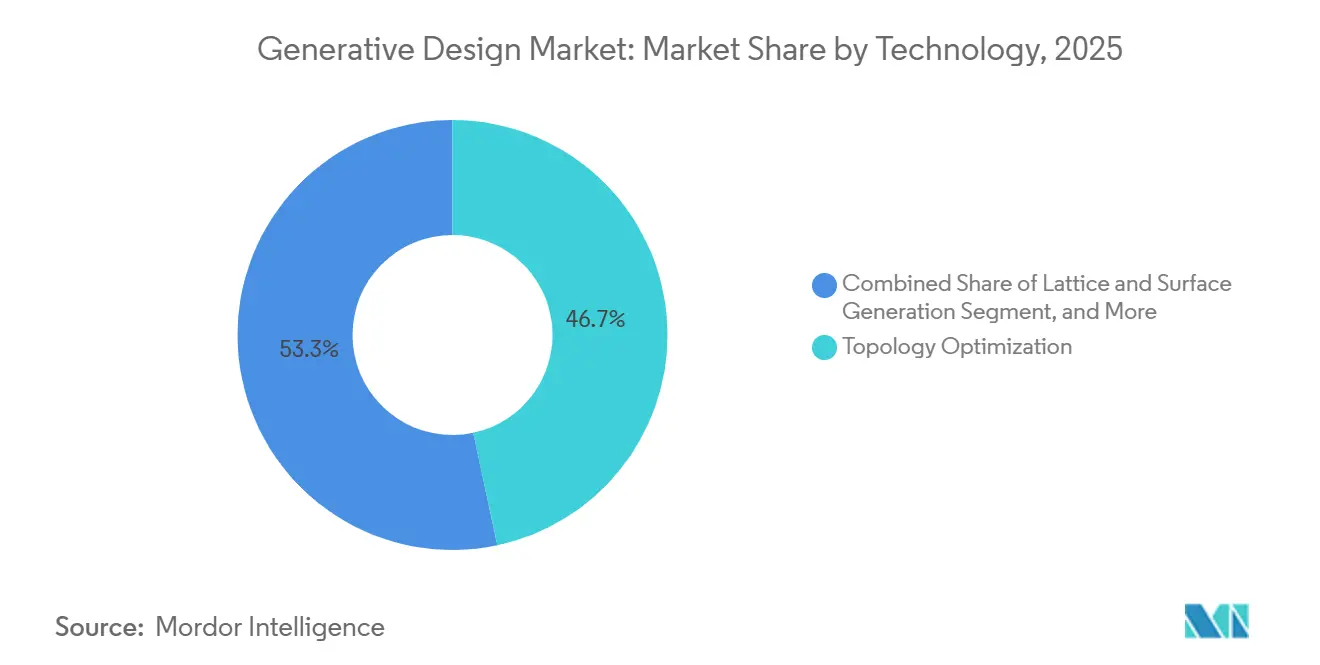
- By technology, topology optimization led the generative design market with 46.67% market share in 2025, whereas AI-driven multi-objective optimization is forecast to register a 15.07% CAGR during the same period.
- By end-user industry, automotive accounted for 38.91% of the generative design market share in 2025, while medical devices are poised to expand at a 15.89% CAGR through 2031.
- By geography, North America captured 38.73% of 2025 revenue, and Asia-Pacific is projected to post the fastest CAGR of 15.24% through 2031.
Note: Market size and forecast figures in this report are generated using Mordor Intelligence’s proprietary estimation framework, updated with the latest available data and insights as of 2026.
Global Generative Design Market Trends and Insights
Drivers Impact Analysis*
| Driver | (~) % Impact on CAGR Forecast | Geographic Relevance | Impact Timeline |
|---|---|---|---|
| Lightweighting Needs in Automotive and Aerospace | +3.2% | Global, concentrated in North America, Europe, Asia-Pacific | Medium term (2-4 years) |
| Cloud-Based HPC Access for SMEs | +2.8% | Global, strongest in Asia-Pacific and South America | Short term (≤ 2 years) |
| Integration with Additive Manufacturing Workflows | +3.5% | North America and Europe lead, Asia-Pacific growing fast | Medium term (2-4 years) |
| Generative Design for Carbon-Footprint Optimization | +2.1% | Europe and North America primary, Asia-Pacific emerging | Long term (≥ 4 years) |
| AI-Native Lattice Libraries for Bio-Mimetic Parts | +1.9% | North America and Europe medical devices, Asia-Pacific consumer products | Medium term (2-4 years) |
| Quantum-Accelerated Topology Search Algorithms | +0.6% | North America and Europe research hubs | Long term (≥ 4 years) |
| Source: Mordor Intelligence | |||
Lightweighting Needs in Automotive and Aerospace
Automakers and aircraft manufacturers face strict fuel-efficiency and emissions limits that translate directly into mass-reduction targets, pushing engineering teams toward topology optimization that removes non-critical material while preserving strength.[1]European Commission, “Corporate Sustainability Reporting Directive,” europa.eu Generative algorithms routinely deliver 20%–40% lighter brackets, seat frames, and battery enclosures, savings that multiply across high-volume vehicle platforms. Recent enhancements to Siemens NX let engineers define load cases and manufacturing constraints, then generate dozens of viable geometries in hours rather than weeks. In aerospace, each kilogram trimmed from an airframe can save thousands of U.S. dollars in fuel over a jet’s service life, so suppliers rapidly scale generative workflows for turbine brackets and satellite structures. These quantified benefits underpin sustained demand despite premium software pricing.
Cloud-Based HPC Access for SMEs
Running thousands of finite-element iterations once required expensive on-premises clusters, but cloud deployment now delivers scalable core hours through usage-based fees, removing capital barriers for small and medium manufacturers.[2]Autodesk Inc., “Fusion 360 Cloud-Based Generative Design Expansion,” autodesk.com Fusion 360 and Creo automatically spin up solver instances on Amazon Web Services or Microsoft Azure, allowing engineers to explore broader design spaces without hardware bottlenecks. Cloud workspaces also centralize models and results, simplifying collaboration across multiple plants and time zones. Asia-Pacific contract manufacturers and South American tier-two suppliers use this pay-per-job model to compete for lightweighting contracts once dominated by large OEMs. As hyperscalers add GPU- and accelerator-based nodes tuned for simulation, compute costs per iteration continue to fall, reinforcing the migration trend.
Integration with Additive Manufacturing Workflows
Generative design truly unlocks value when printed, because internal lattices, conformal cooling channels, and organic surfaces are impossible to cut or mill using subtractive methods. The ISO/ASTM 52900 standards published in 2024 established shared terminology and quality benchmarks that reassured risk-averse aerospace and medical buyers.[3]International Organization for Standardization, “ISO/ASTM 52900:2024,” iso.org Partnerships such as nTopology’s implicit modeling engine, linked directly to Desktop Metal’s Studio System 2 Plus, allow engineers to move from optimized geometry to printer toolpath with minimal manual rework, cutting lead times by up to 50%. Automated support-generation and build-orientation recommendations further reduce scrap and post-processing labor. These integrated pipelines translate algorithmic benefits into production savings, expanding adoption beyond prototyping into serial manufacture.
Generative Design for Carbon-Footprint Optimization
Corporate sustainability teams increasingly demand that engineering choices align with Scope 3 emissions disclosures under the EU Corporate Sustainability Reporting Directive, prompting software vendors to embed lifecycle assessment in design tools. Dassault Systèmes now lets users set carbon ceilings so that over-threshold geometries are automatically filtered out, aligning early design with downstream procurement goals. Altair’s Inspire overlay visualizes embodied energy for every iteration, speeding material swaps from steel to aluminum or composites that lower cradle-to-gate emissions by double-digit percentages. These capabilities turn sustainability from a reporting burden into a quantifiable design objective, helping manufacturers win eco-conscious bids and comply with future carbon taxes. The shift from weight-only to weight-plus-carbon metrics broadens the strategic relevance of generative design across industries.
Restraints Impact Analysis*
| Restraint | (~) % Impact on CAGR Forecast | Geographic Relevance | Impact Timeline |
|---|---|---|---|
| High Software Cost and Steep Learning Curve | -2.4% | Global, acute in South America, Middle East and Africa | Short term (≤ 2 years) |
| Data-Interoperability Gaps across CAD/CAE Suites | -1.8% | Global enterprises with mixed toolchains | Medium term (2-4 years) |
| IP Ownership Ambiguity for AI-Generated Designs | -1.1% | North America and Europe patent environments | Long term (≥ 4 years) |
| Shortage of Certified Materials for Safety-Critical 3D-Printed Parts | -1.6% | North America and Europe strict regulators | Medium term (2-4 years) |
| Source: Mordor Intelligence | |||
High Software Cost and Steep Learning Curve
Annual licenses for enterprise-grade generative platforms can exceed USD 10,000 per seat, a figure tough to justify for contract manufacturers operating on thin margins. Beyond fees, engineers must master objective functions, constraint tuning, and manufacturing filters, skills not taught in most mechanical-engineering programs. A 2025 global survey found 62% of respondents cited lack of in-house expertise as the primary adoption barrier, ranking higher than compute availability or material certification issues. Vendors offer bundled training and consulting, yet those services increase the total cost of ownership, reinforcing a skills gap that slows penetration outside aerospace and automotive hubs. Until prices fall and AI assistants automate parameter setup, uptake among small enterprises will remain uneven.
Shortage of Certified Materials for Safety-Critical 3D-Printed Parts
Regulators require rigorous validation of mechanical properties, microstructure consistency, and powder traceability before approving additively manufactured components for implants or flight hardware. Current certified options are largely limited to Ti-6Al-4V and Inconel 718, leaving many generative designs economically unviable for volume production. The United States Food and Drug Administration’s updated guidance mandates destructive testing and batch-to-batch documentation that can add 18–24 months to qualification timelines. Aerospace suppliers face similar hurdles under FAA and EASA rules, resulting in duplicative costs across each material-process combination. Without broader material databases and shared certification frameworks, many promising generative concepts will stall at the prototype stage, capping near-term deployment in safety-critical domains.
*Our forecasts treat driver/restraint impacts as directional, not additive. The impact forecasts reflect baseline growth, mix effects, and variable interactions.
Segment Analysis
By Component: Services Gain Momentum Amid Implementation Complexity
Software licenses captured 76.23% of the generative design market share in 2025 because vendors monetize intellectual property through recurring subscriptions that bundle upgrades and user support. Even so, the services slice of the generative design market size is projected to expand quickly as clients seek workflow integration, algorithm customization, and staff upskilling. Consulting engagements that translate lightweighting targets into solver constraints often run into six‐figure budgets, providing vendors with attractive margins. Training packages remain essential because proficiency demands familiarity with finite‐element theory, manufacturing rules, and optimization objectives. Altair and Siemens each broadened their professional-services bench in 2025, responding to automotive suppliers that need turnkey implementation before new electric-vehicle launches.
A second growth lever is managed high-performance computing, where providers oversee cloud clusters, run optimization jobs, and deliver ready-to-print geometries, eliminating the need for in-house IT. As more enterprises shift from pilot studies to fleetwide rollouts, demand for continuous algorithm tuning and post-processing support should rise. This dynamic positions service revenues to outpace license growth, even though software will remain the larger absolute pool through 2031. Vendors that package consulting, training, and computing into outcome-based contracts will deepen customer lock-in and smooth renewal cycles. The combination of sticky subscriptions and high-touch services enhances lifetime value and underpins the segment's long-term attractiveness.


By Deployment: Cloud Transforms Access to Compute-Intensive Solvers
Cloud installations accounted for 62.49% of the generative design market share in 2025, a figure driven by pay-as-you-go pricing that removes capital barriers for small and medium manufacturers. Each generative topology run can consume hundreds of core hours, and hyperscalers now offer GPU-accelerated nodes that slash solve times by up to 70%. This elastic capacity encourages engineers to expand design space, test additional load cases, and iterate faster, thereby reinforcing adoption.
On-premises deployments, still favored by aerospace and defense primes, accounted for 37.51% of the generative design market. These users cite data sovereignty requirements and export-control rules that restrict the transfer of sensitive geometries to the cloud. Hybrid models are emerging in which private clusters handle baseline workloads while public clouds add burst capacity during peak phases. The approach maximizes existing hardware investments yet prevents queue backlogs when program deadlines compress. As hyperscaler compliance frameworks mature and sovereign cloud zones proliferate, some regulated firms are expected to migrate more jobs to public infrastructure, supporting continued cloud momentum.
By Technology: AI-Native Engines Challenge Classical Topology Optimization
Topology optimization dominated the 2025 generative design market with 46.67% market share because engineers trust its well-validated method for removing low-stress material while honoring manufacturing constraints. Mature workflows inside Ansys, Siemens, and Dassault suites encourage conservative industries to stick with deterministic solvers for safety-critical parts. Yet limitations become clear when multiple objectives conflict, prompting iterative back-and-forth between structural and thermal specialists.
AI-driven multi-objective engines are forecast to grow at a 15.07% CAGR, the fastest rate within the generative design market. Trained on thousands of historical CAD files, these neural networks propose candidate geometries that satisfy weight, stiffness, heat-dissipation, and manufacturability goals in a single inference pass. Early adopters in battery-electric vehicles report design-cycle reductions exceeding 50%, freeing engineers to evaluate more tradeoffs before tooling lock. Lattice and surface-generation technology applies implicit modeling to craft graded cellular structures that match site-specific stress, a capability prized in orthopedic implants. Meanwhile, fluid and thermal solvers create conformal channels that enhance heat transfer in power electronics and injection-molding inserts, broadening the technology palette.

By End-User Industry: Medical Devices Race Ahead of Automotive Heavyweights
Automotive manufacturers retained 38.91% of 2025 spending because every 10% reduction in vehicle mass improves fuel efficiency or range by roughly 6%-8%. Programs targeting battery enclosures, seat frames, and suspension knuckles rely on well-established CAE pipelines, making integration of generative modules straightforward. Suppliers that hit aggressive lightweighting goals secure purchase-order preference from original-equipment makers, reinforcing the sector’s near-term dominance. Aerospace and defense follow closely, leveraging topology optimization to lower launch costs and extend aircraft range through kilogram-level savings.
Medical devices are on track for the highest CAGR of 15.89%, propelled by the 2024 FDA guidance that clarified approval pathways for additively manufactured implants. Patient-specific hip stems and spinal cages now reach the market faster because generative algorithms can tailor lattice stiffness to match bone gradients, reducing stress shielding. Hospitals value the post-operative benefits, while payers see lower revision rates, supporting premium reimbursement. Consumer products, architecture, and energy applications form an emerging tail, and adoption will accelerate once template-based interfaces lower expertise hurdles and multi-material printers move toward mainstream pricing.
Geography Analysis
North America accounted for 38.73% of 2025 revenue, the largest share of the generative design market among all regions, supported by a tight network of aerospace primes, automotive original equipment manufacturers, and additive manufacturing bureaus. Federal defense programs and early regulatory clarity on 3D-printed parts sustain high software spending, while the breadth of cloud infrastructure underpins continuous solver use. Canada and Mexico add incremental growth as cross-border suppliers adopt topology optimization to meet electric-vehicle mass targets. The result is a mature yet expanding ecosystem that pairs established engineering cultures with rising adoption in tier-two supply chains.
Asia-Pacific is projected to register the fastest 15.24% CAGR through 2031, making the region an outsized contributor to future gains in the generative design market. Chinese manufacturing-upgrade subsidies, Indian automotive export goals, and Japanese robotics leadership collectively foster rapid uptake of cloud-based tools. Local service bureaus bundle design optimization with printing, lowering barriers for small and medium enterprises that lack in-house expertise. Government stimulus funds often cover training and compute credits, accelerating first-time deployments across consumer electronics, medical devices, and power-equipment verticals. Regulatory harmonization on additive quality standards is expected to further streamline adoption over the forecast window.
Europe holds a significant share of current revenue, anchored by Germany’s automotive champions and the United Kingdom’s and France’s aerospace programs, which embed generative design into engine, airframe, and battery projects. Strict carbon-emission rules make lightweighting and lifecycle assessment mandatory, driving steady license renewals and advisory engagements. Southern European and Nordic construction firms are now applying optimization to façades and structural elements, broadening the addressable pool beyond mobility sectors. South America, the Middle East, and Africa collectively form a smaller but rising base as local universities and government labs incubate skills and pilot projects. Together, these emerging regions will incrementally widen the global generative design market share by the end of the decade.

Competitive Landscape
The competitive arena is moderately fragmented, with the top five vendors controlling just over half of global revenue, a structure that puts the generative design market concentration score at 5. Incumbent computer-aided design providers such as Autodesk, Siemens, and Dassault leverage their installed user bases to cross-sell integrated optimization modules, bundling simulation and lifecycle management to lock customers into long contracts. Their cloud marketplaces supply usage-based compute credits and curated training paths that lower initial friction but reinforce ecosystem dependence once data and workflows are embedded.
Specialized challengers, including nTopology, Hyperganic, and ParaMatters, focus on implicit modeling, lattice libraries, and AI-driven multi-objective engines that deliver distinctive geometric freedom. These firms court medical-device and aerospace suppliers that need graded cellular structures or thermal dispersion channels beyond the scope of conventional CAD kernels. Partnerships with printer hardware companies turn those algorithms into ready-to-build toolpaths, cutting lead times and strengthening vendor stickiness. Funding rounds in 2025 fueled accelerated product roadmaps, adding automated support generation and carbon-footprint filters that appeal to sustainability teams.
Strategic moves in 2025 and early 2026 indicate intensifying competition in services and vertical solutions. Altair expanded its consulting bench by hiring materials scientists to translate lightweighting goals into solver setups for automotive clients, while Siemens introduced natural-language constraint input to reduce onboarding time for small manufacturers. Autodesk’s acquisition of a cloud simulation startup added real-time multiphysics capability, narrowing a feature gap versus Ansys. Meanwhile, regional system integrators bundle training, compute, and part certification into outcome-based contracts that help late adopters clear expertise and regulatory barriers. Collectively, these maneuvers signal a shift from pure software licensing to full-stack offerings that combine platform, compute, and domain consulting into a single value proposition.
Generative Design Industry Leaders
Autodesk Inc.
Dassault Systèmes SE
PTC Inc.
Hexagon AB
Bentley Systems, Incorporated
- *Disclaimer: Major Players sorted in no particular order

Recent Industry Developments
- January 2026: Siemens Digital Industries Software integrated AI-driven natural-language generative workflows into NX, trimming setup time by up to 60%.
- December 2025: Autodesk acquired a cloud simulation startup, adding real-time multiphysics optimization inside Fusion 360.
- November 2025: Dassault Systèmes embedded life-cycle assessment filters within 3DEXPERIENCE generative modules.
- October 2025: nTopology partnered with Desktop Metal to streamline binder-jet lattice production.


Global Generative Design Market Report Scope
The Generative Design Market Report is Segmented by Component (Software, and Services), Deployment (On-Premise, and Cloud), Technology (Topology Optimization, Fluid and Thermal Optimization, Lattice and Surface Generation, AI-Driven Multi-Objective Optimization), End-User Industry (Automotive, Aerospace and Defense, Architecture and Construction, Industrial Equipment, Consumer Products, Medical Devices, Energy and Utilities, Other End-User Industries), and Geography (North America, South America, Europe, Asia-Pacific, Middle East and Africa). The Market Forecasts are Provided in Terms of Value (USD).
| Software |
| Services |
| On-Premise |
| Cloud |
| Topology Optimization |
| Fluid and Thermal Optimization |
| Lattice and Surface Generation |
| AI-Driven Multi-Objective Optimization |
| Automotive |
| Aerospace and Defense |
| Architecture and Construction |
| Industrial Equipment |
| Consumer Products |
| Medical Devices |
| Energy and Utilities |
| Other End-User Industries |
| North America | United States | |
| Canada | ||
| Mexico | ||
| South America | Brazil | |
| Argentina | ||
| Rest of South America | ||
| Europe | United Kingdom | |
| Germany | ||
| France | ||
| Italy | ||
| Rest of Europe | ||
| Asia Pacific | China | |
| Japan | ||
| India | ||
| South Korea | ||
| Rest of Asia Pacific | ||
| Middle East and Africa | Middle East | United Arab Emirates |
| Saudi Arabia | ||
| Rest of Middle East | ||
| Africa | South Africa | |
| Egypt | ||
| Rest of Africa | ||
| By Component | Software | ||
| Services | |||
| By Deployment | On-Premise | ||
| Cloud | |||
| By Technology | Topology Optimization | ||
| Fluid and Thermal Optimization | |||
| Lattice and Surface Generation | |||
| AI-Driven Multi-Objective Optimization | |||
| By End-User Industry | Automotive | ||
| Aerospace and Defense | |||
| Architecture and Construction | |||
| Industrial Equipment | |||
| Consumer Products | |||
| Medical Devices | |||
| Energy and Utilities | |||
| Other End-User Industries | |||
| By Geography | North America | United States | |
| Canada | |||
| Mexico | |||
| South America | Brazil | ||
| Argentina | |||
| Rest of South America | |||
| Europe | United Kingdom | ||
| Germany | |||
| France | |||
| Italy | |||
| Rest of Europe | |||
| Asia Pacific | China | ||
| Japan | |||
| India | |||
| South Korea | |||
| Rest of Asia Pacific | |||
| Middle East and Africa | Middle East | United Arab Emirates | |
| Saudi Arabia | |||
| Rest of Middle East | |||
| Africa | South Africa | ||
| Egypt | |||
| Rest of Africa | |||


Key Questions Answered in the Report
How fast is the generative design market expected to grow through 2031?
It is forecast to advance at a 14.29% CAGR from 2026 to 2031, reaching USD 9.77 billion by the end of the period.
Which deployment model leads current spending?
Cloud deployments held 62.49% of 2025 revenue because pay-as-you-go compute removes capex hurdles for small manufacturers.
Why are medical-device firms adopting generative tools so quickly?
FDA guidance in 2024 clarified approval paths, enabling patient-specific implants that reduce stress shielding and drive a 15.89% CAGR through 2031.
What is the biggest restraint blocking broader adoption?
High software cost combined with steep learning curves subtracts an estimated 2.4% from long-term CAGR until vendors simplify workflows and pricing.
Which region shows the fastest future expansion?
Asia-Pacific is projected to grow at 15.24% annually, propelled by Chinese manufacturing upgrades and Indian automotive exports.
How are vendors differentiating their offerings?
They emphasize AI-native multi-objective engines, lattice libraries, and deep integrations with additive manufacturing hardware to shorten concept-to-print timelines.
Page last updated on:


