Search Engine Market Size and Share
Market Overview
| Study Period | 2020 - 2031 |
|---|---|
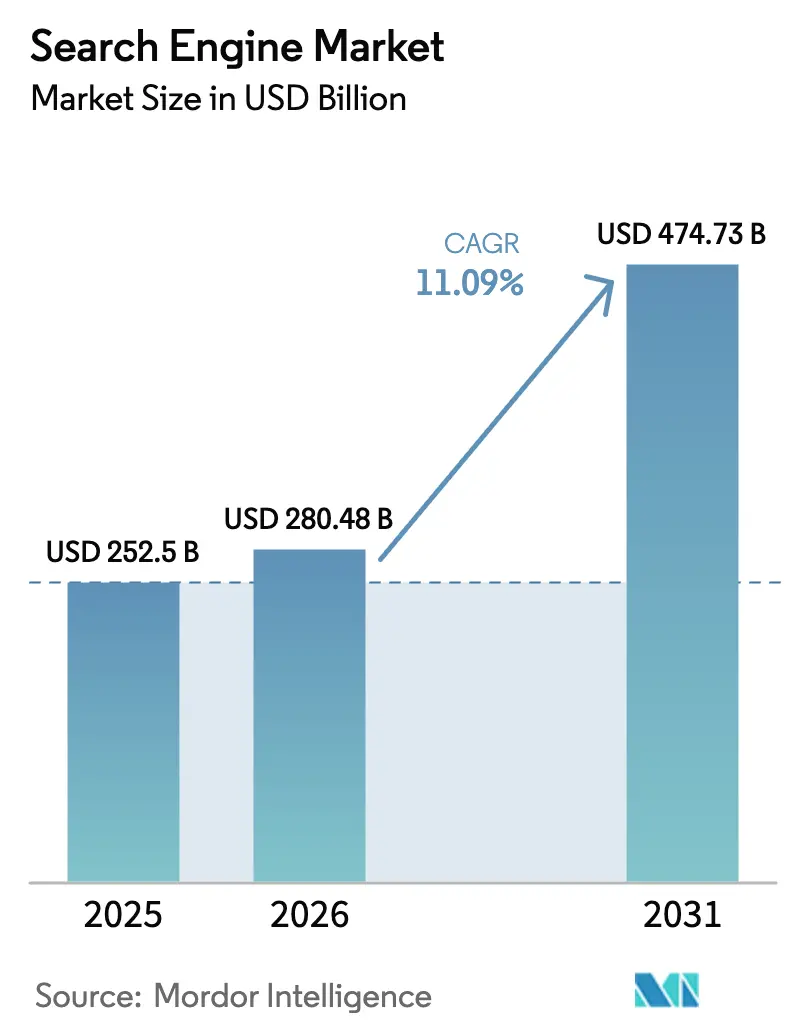
| Market Size (2026) | USD 280.48 Billion |
| Market Size (2031) | USD 474.73 Billion |
| Growth Rate (2026 - 2031) | 11.09% CAGR |
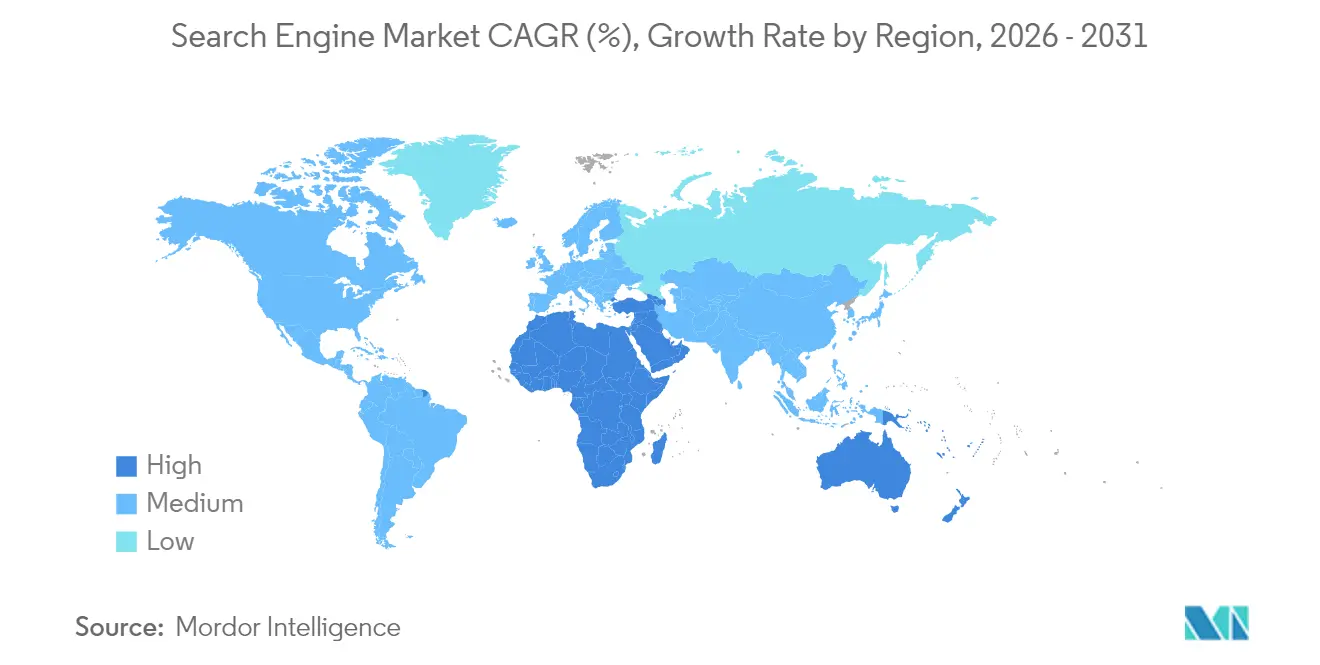
| Fastest Growing Market | Africa |
| Largest Market | Asia Pacific |
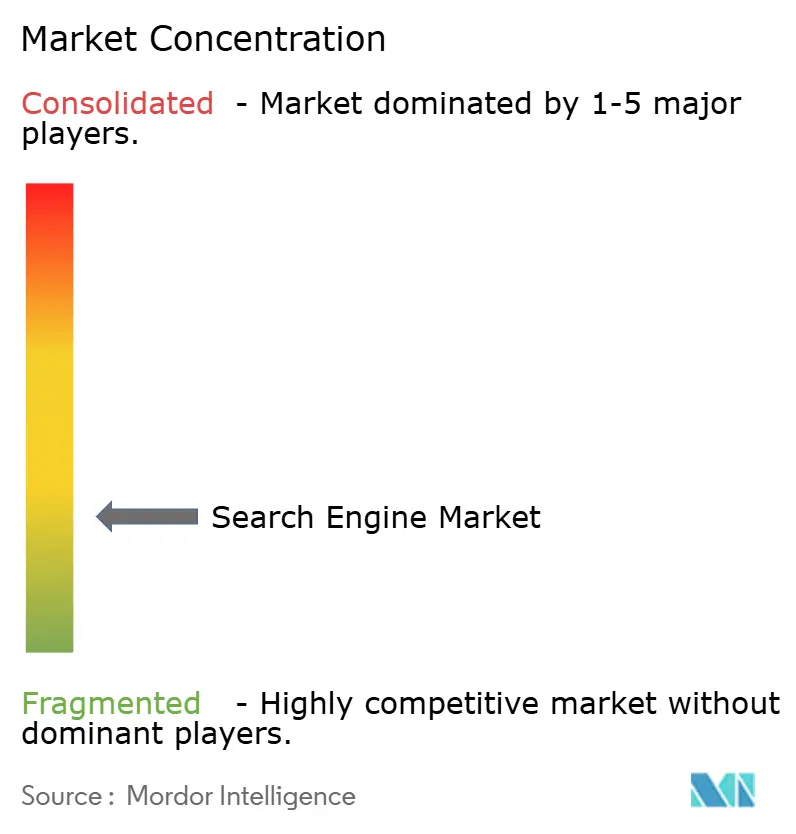
| Market Concentration | Low |
Major Players*Disclaimer: Major Players sorted in no particular order Image © Mordor Intelligence. Reuse requires attribution under CC BY 4.0. |
|
Search Engine Market Analysis by Mordor Intelligence
The search engine market size is expected to grow from USD 252.5 billion in 2025 to USD 280.48 billion in 2026 and is forecast to reach USD 474.73 billion by 2031 at 11.09% CAGR over 2026-2031. Strong growth reflects the shift from keyword retrieval to AI-native, conversational engines that require far greater compute resources, especially for multimodal queries that combine text, voice and visuals. Enterprise demand for vertical search APIs, the rise of multimodal monetization, and ongoing privacy regulation shape competitive strategies as providers balance innovation with compliance costs. APAC, boosted by 5G rollouts and mobile-first user bases, remains the largest regional contributor, while Africa records the fastest growth as broadband coverage accelerates. Crawler-based engines still dominate revenues, yet specialist vertical engines now set the pace for expansion thanks to enterprise demand for domain-aware results. Subscription and SaaS payment models, attractive to corporate customers seeking predictable costs, outpace pure advertising growth as compute-heavy AI search needs sustainable funding.
Key Report Takeaways
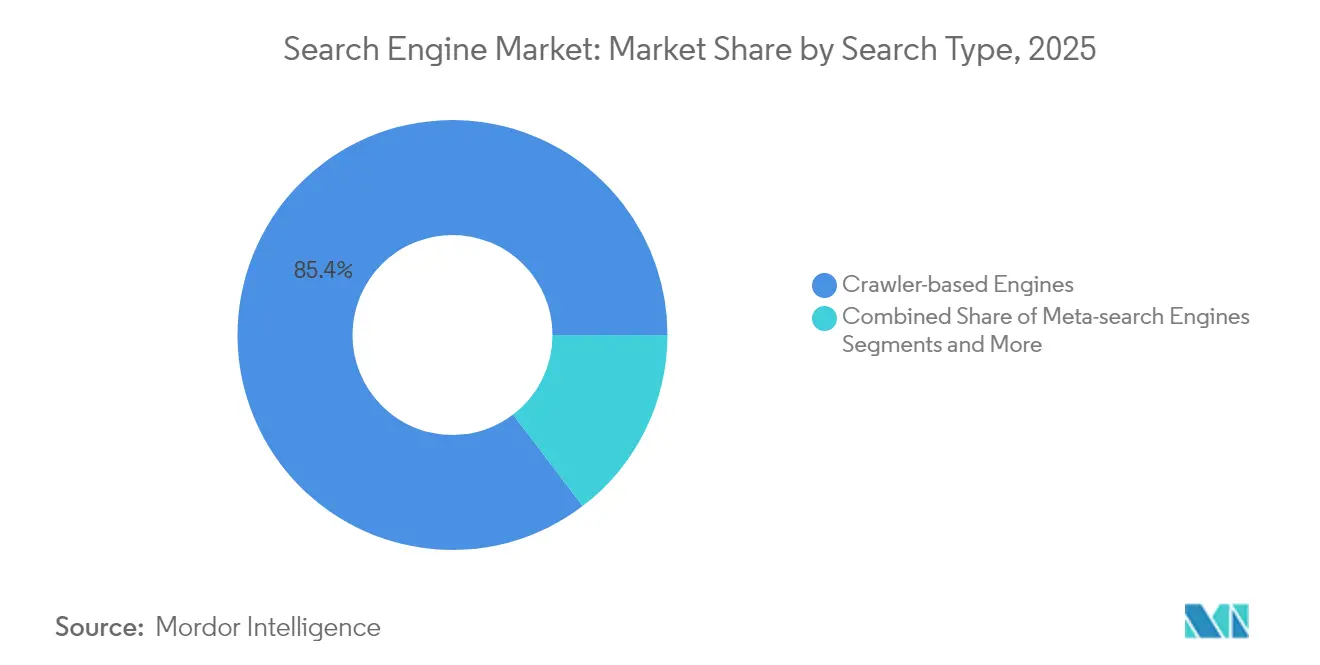
- By search type, crawler-based engines led with 85.35% revenue share in 2025; vertical and domain-specific engines are set to expand at an 17.95% CAGR through 2031.
- By platform, mobile captured 58.45% revenue in 2025, whereas smart-speaker and voice assistants advance at a 16.05% CAGR to 2031.
- By application, personal use accounted for 63.40% of the search engine market size in 2025, while enterprise deployments are rising at a 14.55% CAGR.
- By revenue model, advertising retained 61.20% share of the search engine market size in 2025; subscription and SaaS accrue the top CAGR at 17.25%.
- By end-use industry, e-commerce and retail produced 32.60% of 2025 revenues, but healthcare and life sciences are forecast to grow at a 16.75% CAGR through 2031.
- By geography, APAC held 38.70% of the search engine market share in 2025, while Africa is projected to grow at a 14.55% CAGR to 2031.
Note: Market size and forecast figures in this report are generated using Mordor Intelligence’s proprietary estimation framework, updated with the latest available data and insights as of 2026.
Global Search Engine Market Trends and Insights
Drivers Impact Analysis*
| Driver | (~) % Impact on CAGR Forecast | Geographic Relevance | Impact Timeline |
|---|---|---|---|
| Growth of voice search adoption | +2.1% | Global, APAC leading | Medium term (2-4 years) |
| Rising demand for AI-powered content intelligence | +3.2% | North America and EU | Short term (≤ 2 years) |
| Mobile internet penetration and 5G rollout | +1.8% | APAC core; spill-over to Africa and MEA | Long term (≥ 4 years) |
| Shift of ad-spend toward paid search | +2.4% | Global, concentrated in developed markets | Medium term (2-4 years) |
| Generative-AI multimodal search monetization | +1.9% | North America and EU | Short term (≤ 2 years) |
| Enterprise-grade vertical search APIs | +2.7% | Global enterprise markets | Medium term (2-4 years) |
| Source: Mordor Intelligence | |||
Growth of Voice Search Adoption
Voice interfaces permeate smartphones, vehicles and smart speakers as hardware vendors embed AI search directly into devices. Samsung’s investment in Perplexity AI will preload conversational capabilities on future handsets, while Bixby integrates object-recognition to let users query physical items through augmented-reality overlays. Enterprise scenarios gain from voice APIs that support hands-free retrieval in manufacturing, clinical and logistics settings. Patent activity shows suppliers refining voice-to-visual interaction, a foundation for monetizing ambient, context-aware search moments. As users embrace conversational queries, search providers enrich data signals, enhance ad targeting and diversify revenue beyond text ads.
Rising Demand for AI-Powered Content Intelligence
Enterprises now expect insight generation rather than simple document location. Google’s March 2025 AI Mode orchestrates multiple searches to return consolidated answers, signaling a move from ranked links to synthesized responses. Baidu’s ERNIE model processes 1.5 billion API calls daily at 99% lower cost than legacy stacks, illustrating efficiency gains that spur adoption. OpenAI’s Rockset acquisition underlines the strategic value of retrieval-augmented generation for real-time analytics. Enterprises leverage these tools to summarize reports, extract insights and power chatbots, creating subscription revenue streams for search vendors.
Mobile Internet Penetration and 5G Rollout
Advanced networks reduce latency and boost bandwidth, enabling visual and spatial search. APAC’s 1.8 billion mobile subscribers now contribute 5.3% to regional GDP, supporting location-aware ad formats and richer commerce experiences. DeepSeek’s visual search shows 62% of millennials and Gen Z prefer images over text, encouraging brands to sponsor shoppable results\. Africa’s fixed broadband base will almost double by 2030, expanding addressable audiences and boosting the search engine market.[1]"Africa Broadband Outlook 2024." Africa Analysis
Shift of Ad-Spend Toward Paid Search
AI-driven paid search is forecast to rise from USD 1 billion in 2025 to USD 26 billion by 2029 as advertisers chase higher-quality engagement despite lower click-through volumes. Microsoft’s FY 2024 search and news advertising grew 12% as Bing’s AI features improved audience reach.[2]Microsoft Corporation, “Microsoft 2024 Annual Report,” microsoft.com Google’s Q4 2024 search revenue rose 13% to USD 49.4 billion, underscoring the resilience of sponsored listings amid format changes. Marketers increasingly prioritize conversion attribution over impressions, benefiting engines that can map query intent to purchase outcomes.
Restraints Impact Analysis*
| Restraint | (~) % Impact on CAGR Forecast | Geographic Relevance | Impact Timeline |
|---|---|---|---|
| Rise in low-quality and misleading online content | -1.4% | Global, hitting emerging markets hardest | Short term (≤ 2 years) |
| Tougher data-privacy laws and cross-border rules | -2.1% | EU and North America remain the main watchdogs | Long term (≥ 4 years) |
| Stricter scrutiny of data-center environmental impact | -1.2% | Worldwide, with the EU setting the pace on green regulation | Medium term (2-4 years) |
| Antitrust limits on pre-installed browser defaults | -0.8% | North America and the EU drive most enforcement actions | Medium term (2-4 years) |
| Source: Mordor Intelligence | |||
Web-Spam and Content Quality Issues
Large-language models enable content farms that flood indices with plausible yet unreliable pages, eroding user trust. Engines invest in verification, fact-checking and human curators, driving up costs and squeezing smaller rivals. Quality challenges are acute in emerging markets where oversight resources are limited, further entrenching the largest providers.
Data-Privacy and Cross-Border Regulation
GDPR, CCPA and a wave of state-level AI bills restrict data flows, mandate consent tracking and demand algorithm transparency. Compliance raises capital demands and prompts regional fragmentation as EU players build sovereign indices like the EUSP project Yippy. Smaller entrants face disproportionate overheads, dampening competitive diversity and slowing overall market growth.
*Our forecasts treat driver/restraint impacts as directional, not additive. The impact forecasts reflect baseline growth, mix effects, and variable interactions.
Segment Analysis
By Search Type: Vertical Engines Drive Specialization
Crawler-based platforms generated 85.35% revenue in 2025, underpinning the search engine market size leadership through extensive infrastructure and advertiser familiarity. Nevertheless, vertical engines are projected to compound at 17.95% CAGR, propelled by regulated sectors that require domain-specific semantics and compliance features. Enterprises in healthcare and finance adopt specialist engines that deliver contextual answers, shortening research cycles. Meta-search and federated approaches gain relevance where organizations unify disparate repositories without replicating external web crawls.
Patent filings reveal Google prototyping neural radiance field models to embed 3D product previews directly into vertical shopping flows. OpenSearch 3.0’s GPU acceleration underscores the arms race for high-performance vector retrieval supporting semantic, multimedia and multilingual demands. As enterprises turn to subscription models, vendors that blend precision recall with low latency stand to capture disproportionate value in the search engine market.


By Platform: Voice Assistants Accelerate Beyond Mobile
Mobile traffic accounted for 58.45% of spending in 2025, anchoring the search engine market thanks to near-universal smartphone penetration and 5G throughput gains. Voice assistants, however, post the highest 16.05% CAGR as consumers and enterprises prioritize hands-free access. Automotive OEMs integrate voice queries to improve safety, while kitchens, factories and warehouses rely on audio prompts where screens are impractical. Desktop remains vital for deep research tasks, although growth flattens.
Microsoft’s personalization patent illustrates context-aware voice that adapts to user tone, location and prior sessions. Smart-speaker vendors seek differentiated skills, bundling shopping, payments and home-automation routines into conversational flows, thereby monetizing beyond adverts. As assistants gain language coverage and ambient sensing, they further expand the search engine market by embedding query capability into daily routines.
By Application: Enterprise Adoption Outpaces Consumer Growth
Personal use still leads with 63.40% revenue because habitual consumer search spans news, shopping and social discovery. Yet enterprise deployments grow at 14.55% CAGR, reflecting AI upgrades that transform unstructured data archives into knowledge hubs. The search engine market size for enterprise tools could more than double by 2034 as businesses chase productivity and compliance upside. Seek AI’s integration into IBM underscores the premium placed on engines that unify structured and unstructured data in regulated settings.
Academic and government users adopt engines tuned for citation quality, version control and multilingual support. Subscription-based knowledge portals benefit from tighter alignment with grant and procurement cycles, adding stickiness and elevating lifetime value.

By Revenue Model: Subscription Growth Challenges Advertising Dominance
Advertising delivered 61.20% of 2025 income, retaining primacy in the search engine market through established demand and automated bid auctions. However, energy-intensive AI queries raise compute overheads, pressuring margins and encouraging usage-based SaaS packages. Subscription and SaaS revenues rise at 17.25% CAGR as enterprise buyers seek predictable costs, privacy assurances and customization. Perplexity AI’s freemium bundle combines contextual ads with paid tiers offering expanded context windows, hinting at hybrid monetization paths.
Transaction and affiliate models proliferate in verticals where search triggers direct commerce, such as travel, tickets and app store listings. Providers experiment with revenue-share formats tied to verified conversions, diversifying beyond impression-based fees.
By End-use Industry: Healthcare Leads Vertical Specialization
Retail and e-commerce represented 32.60% of spending in 2025, leveraging product search and sponsored catalog placement to drive immediate sales. Healthcare and life sciences, advancing at 16.75% CAGR, illustrate the fastest uptake as clinicians demand drug interaction insights and evidence-based recommendations at point of care. Engines trained on medical ontologies mitigate hallucination risks and bolster regulatory compliance. Financial institutions deploy AI search for market intelligence and risk analytics, while media firms use semantic tagging to enhance content discovery.
Travel, education and government segments follow, each adopting vertical engines optimized for their data formats and compliance regimes. These dynamics widen the total addressable pool of the search engine market while underscoring the importance of specialized language models.
Geography Analysis
APAC, at 38.70% revenue share in 2025, anchors the search engine market thanks to large user bases in China and India plus aggressive 5G deployment that fuels multimodal query growth. Baidu’s AI-first strategy saw ERNIE process 1.5 billion API calls daily and drove 26% AI Cloud revenue growth. Government digitalization projects and thriving device ecosystems in Japan and South Korea extend enterprise adoption, while multilingual Southeast Asian markets embrace voice search tailored to local dialects.
Africa represents the fastest-growing territory at 14.55% CAGR through 2031 as fixed broadband lines expand from 36.4 million in 2024 to 65.4 million. Mobile-first usage patterns let countries such as Nigeria and Kenya bypass desktop legacies, rapidly scaling AI search services that integrate payments and government portals. Local-language support and data-lite interfaces are critical for monetization in low-ARPU environments, motivating partnerships between global engines and regional telecom carriers.
North America and Europe command high average revenue per user through enterprise contracts and mature ad ecosystems. Privacy regulations, however, increase compliance costs and elevate demand for sovereign indices like the EU-backed EUSP. Middle East smart-city programs embed search in urban infrastructure, whereas Latin America prioritizes low-bandwidth solutions and mobile billing integration. These regional nuances encourage diversified go-to-market playbooks within the global search engine market.

Competitive Landscape
The market remains concentrated: Google’s share dropped to 77.52% in April 2024 yet dwarfs rivals. Microsoft leverages OpenAI models to extend Bing reach, recording 12% advertising uplift in FY 2024. AI-native challengers gain scale: Perplexity AI hit USD 9 billion valuation after a USD 500 million raise and now seeks device pre-installs. OpenAI’s ChatGPT search feature and SearchGPT prototype position the lab as a disruptive contender, especially within enterprise contexts.
Incumbents defend positions through infrastructure scale, proprietary data and cross-product integration. Alphabet’s Gemini 2.0 powers AI Mode for premium Google One users, reinforcing subscription upsell potential. Patents cover multimodal intent discovery and personalized voice agents, signaling accelerated intellectual-property races.
Emerging providers differentiate with vertical depth and transparent pricing. Elastic, Algolia and OpenSearch capture enterprise workloads requiring private-cloud deployment. Partnerships rise in prominence: Samsung aligns with Perplexity, while Meta invests USD 15 billion for 49% of Scale AI, recruiting its CEO to spearhead a new superintelligence unit. Such alliances aim to share compute risk, accelerate capability gaps and seed distribution in the expanding search engine market.
Search Engine Industry Leaders
-
Google LLC
-
Bing Inc.
-
AOL Inc.
-
Ask Network
-
Yandex LLC
- *Disclaimer: Major Players sorted in no particular order

Recent Industry Developments
- June 2025: Meta Platforms completed USD 15 billion investment for 49% of Scale AI to bolster internal superintelligence efforts.
- June 2025: Samsung Electronics finalized a broad deal with Perplexity AI for device-level integration and Bixby enhancement
- May 2025: Perplexity AI raised USD 500 million at a USD 14 billion valuation to fund global expansion.
- May 2025: OpenSearch Software Foundation launched OpenSearch 3.0 with 9.5x vector performance improvements


Research Methodology Framework and Report Scope
Market Definitions and Key Coverage
Our study defines the search engine market as the global revenue earned by public-facing online engines that crawl, index, rank, and serve web content across devices, including AI-augmented conversational engines, vertical or domain-specific portals, and voice or image search front ends. Revenue streams counted cover advertising, subscription, and licensing fees tied directly to search results delivery.
Scope exclusions include SEO service fees, standalone enterprise search software, and developer web-scraping tools that fall outside this remit.
Segmentation Overview
-
By Search Type
- Crawler-based Engines
- Meta-search Engines
- Hybrid / Federated Engines
- Vertical and Domain-specific Engines
-
By Platform
- Desktop
- Mobile
- Smart-Speaker / Voice Assistants
- Other Connected Devices (TV, Auto-IVI)
-
By Application
- Personal Use
- Enterprise / Commercial
- Academic and Public Sector
-
By Revenue Model
- Advertising-based
- Subscription / SaaS
- Transaction and Affiliate
-
By End-use Industry
- E-commerce and Retail
- BFSI
- Healthcare and Life-Sciences
- Media and Entertainment
- Travel and Hospitality
- Others
-
By Geography
-
North America
- United States
- Canada
- Mexico
-
Europe
- United Kingdom
- Germany
- France
- Italy
- Rest of Europe
-
Asia-Pacific
- China
- Japan
- India
- South Korea
- Rest of Asia-Pacific
-
Middle East
- Israel
- Saudi Arabia
- United Arab Emirates
- Turkey
- Rest of Middle East
-
Africa
- South Africa
- Egypt
- Nigeria
- Rest of Africa
-
South America
- Brazil
- Argentina
- Rest of South America
-
North America
Detailed Research Methodology and Data Validation
Primary Research
Mordor analysts held structured interviews with former engine product leads, ad-tech vendors, and digital-agency strategists across North America, Europe, and Asia-Pacific. Discussions on cost-per-thousand impressions, AI query economics, and adoption timelines filled information gaps and confirmed usage inflection points revealed by desk work.
Desk Research
We start with freely available series such as FCC broadband penetration, ITU internet-user counts, StatCounter query shares, IMF household digital-media spend, and W3C browser telemetry, then layer in company filings, ad-platform disclosures, and national customs data. To test revenue and cost assumptions, our analysts tap D&B Hoovers for firm financials and Dow Jones Factiva for real-time news analytics. These sources illustrate the breadth consulted; many additional public and subscription resources informed data collection, validation, and clarification.
Market-Sizing & Forecasting
We employ a top-down and bottom-up framework. Starting with StatCounter query volumes, average revenue per search, and regional digital-ad budgets, we construct platform and geography splits. Selective bottom-up checks, sampled advertiser spend and data-center capacity rollups, corroborate totals. Key market fingerprints tracked include global smartphone installed base, shift of ad budgets to performance media, voice search penetration, compute cost per AI query, and privacy-led query deflection. Multivariate regression determines elasticities, an ARIMA overlay smooths cyclical ad spending, and scenario analysis stress-tests extreme volatility.
Data Validation & Update Cycle
Outputs run through variance filters, multi-analyst peer review, and senior sign-off. Models refresh each year, with interim updates after material events such as major engine launches or regulatory shifts, ensuring clients receive the most current audited view.
Why Mordor's Search Engine Baseline Commands Reliability
Published estimates often diverge because firms bundle adjacent services, choose different base years, or project AI uplift too aggressively.
By anchoring on verified query counts and monetization metrics, Mordor Intelligence offers a dependable decision baseline. Key gap drivers versus other publishers include exclusion of enterprise-only search, differing treatment of privacy-driven subscription revenue, and slower refresh cadences elsewhere.
Benchmark comparison
| Market Size | Anonymized source | Primary gap driver |
|---|---|---|
| USD 252.5 B (2025) | Mordor Intelligence | |
| USD 203.1 B (2023) | Global Consultancy A | Omits voice-only searches and AI answer engines |
| USD 205.79 B (2025) | Industry Publication B | Relies on advertiser spend surveys without query validation |
| USD 205.48 B (2023) | Regional Consultancy C | Applies uniform ARPU, ignores regional pricing variance |
The comparison shows that while peers provide useful reference points, our disciplined scope choices, yearly query-backed recalibration, and transparent assumptions deliver the most reliable baseline for strategy and investment planning.


Key Questions Answered in the Report
What is the current value of the search engine market?
The market stands at USD 280.48 billion in 2026 and is projected to reach USD 474.73 billion by 2031.
Which region leads the search engine market?
APAC leads with 38.70% revenue share in 2025, supported by expansive mobile and 5G adoption.
Why are vertical search engines growing faster than general web crawlers?
Enterprises prefer engines tuned to industry terminology and compliance, driving an 17.95% CAGR for vertical solutions.
How are subscription models affecting search monetization?
Subscription and SaaS revenues are growing at 17.25% CAGR as corporate clients favor predictable costs and privacy over ad-funded services.
Which industry vertical shows the highest search growth potential?
Healthcare and life sciences lead with a 16.75% CAGR due to demand for clinical decision support and specialized medical content retrieval.
What is driving the surge in voice search usage?
Hands-free convenience across smartphones, cars and smart speakers, coupled with hardware makers embedding AI search natively, fuels adoption.
Page last updated on:


