Augmented Analytics Market Size and Share
Market Overview
| Study Period | 2020 - 2031 |
|---|---|
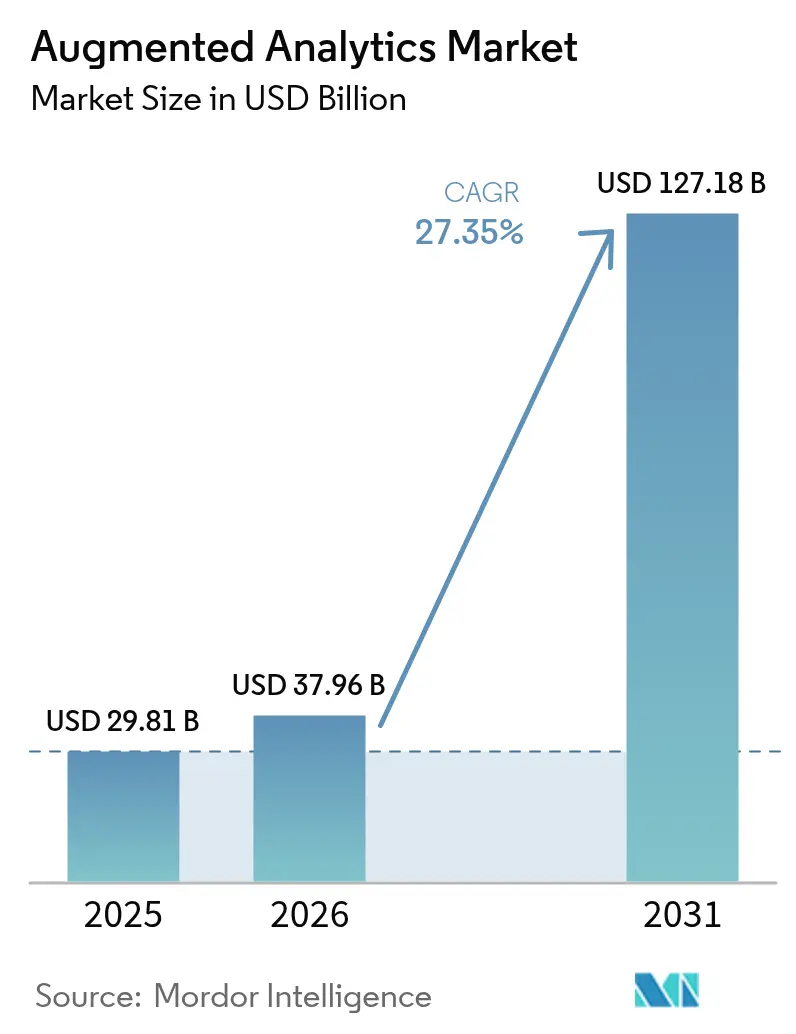
| Market Size (2026) | USD 37.96 Billion |
| Market Size (2031) | USD 127.18 Billion |
| Growth Rate (2026 - 2031) | 27.35% CAGR |
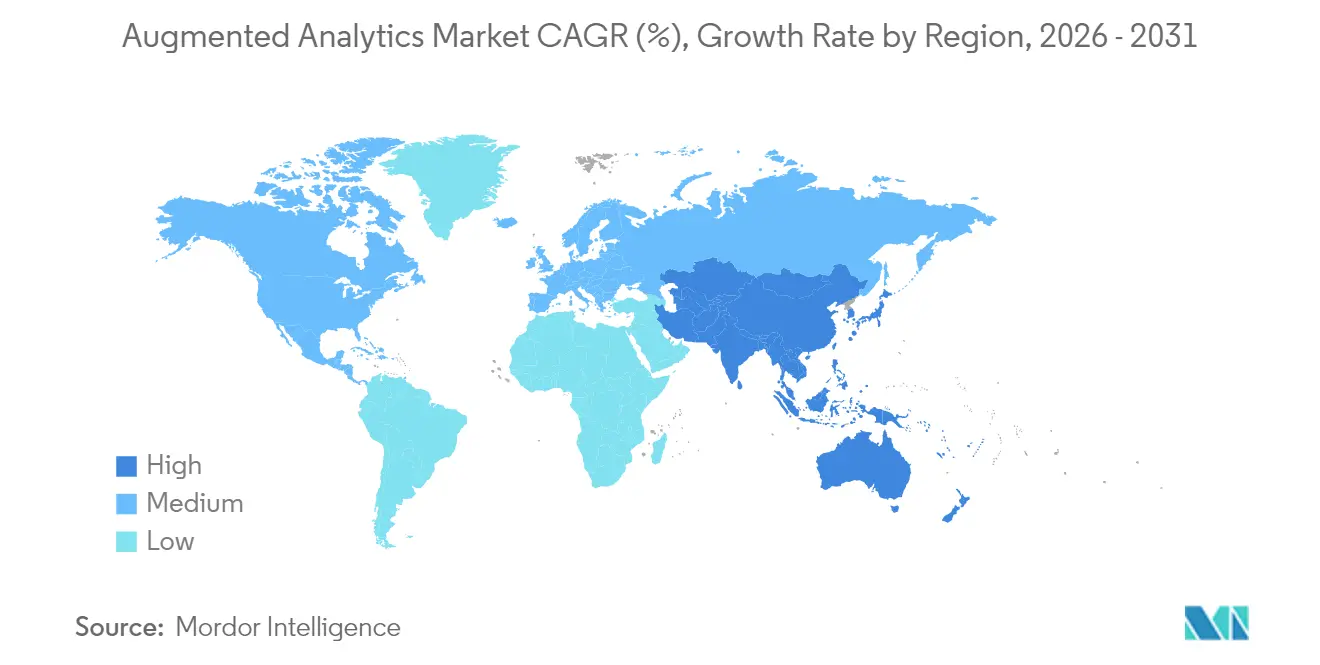
| Fastest Growing Market | Asia Pacific |
| Largest Market | North America |
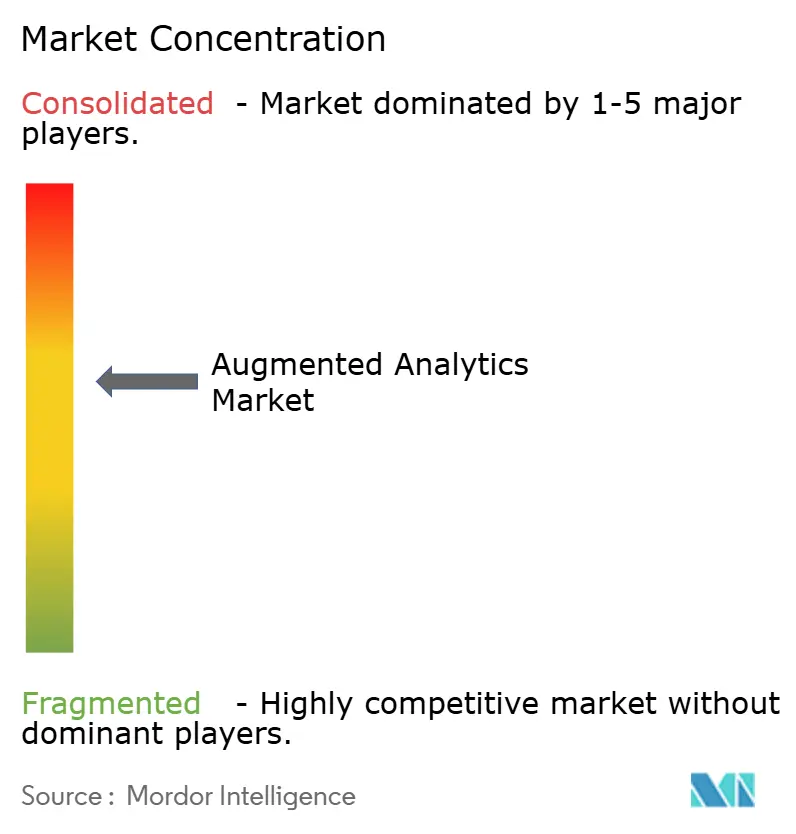
| Market Concentration | Medium |
Major Players*Disclaimer: Major Players sorted in no particular order Image © Mordor Intelligence. Reuse requires attribution under CC BY 4.0. | |
Augmented Analytics Market Analysis by Mordor Intelligence
The Augmented Analytics Market size was valued at USD 29.81 billion in 2025 and estimated to grow from USD 37.96 billion in 2026 to reach USD 127.18 billion by 2031, at a CAGR of 27.35% during the forecast period (2026-2031).
Revenue momentum shifts from proof-of-concepts to enterprise-wide deployments as large-language-model (LLM) functions become standard features inside mainstream business-intelligence suites. Natural-language querying, automated insight generation, and AI agents that execute workflows reduce analytics backlogs and shorten decision cycles, elevating data-driven culture across every business layer. Cloud platforms remain dominant, yet hybrid architectures gain traction because data-sovereignty mandates require on-premises processing for sensitive workloads. Vendor competition intensifies around orchestration tools that coordinate AI tasks between edge, private cloud, and public regions. Services demand accelerates as organisations seek partners to redesign governance, reskill workers, and fine-tune foundation models for domain specificity. Supply-chain bottlenecks for high-performance GPUs and rising inference costs temper near-term scaling plans, but road-map investments by hyperscalers indicate sustained infrastructure build-out through 2026.
Key Report Takeaways
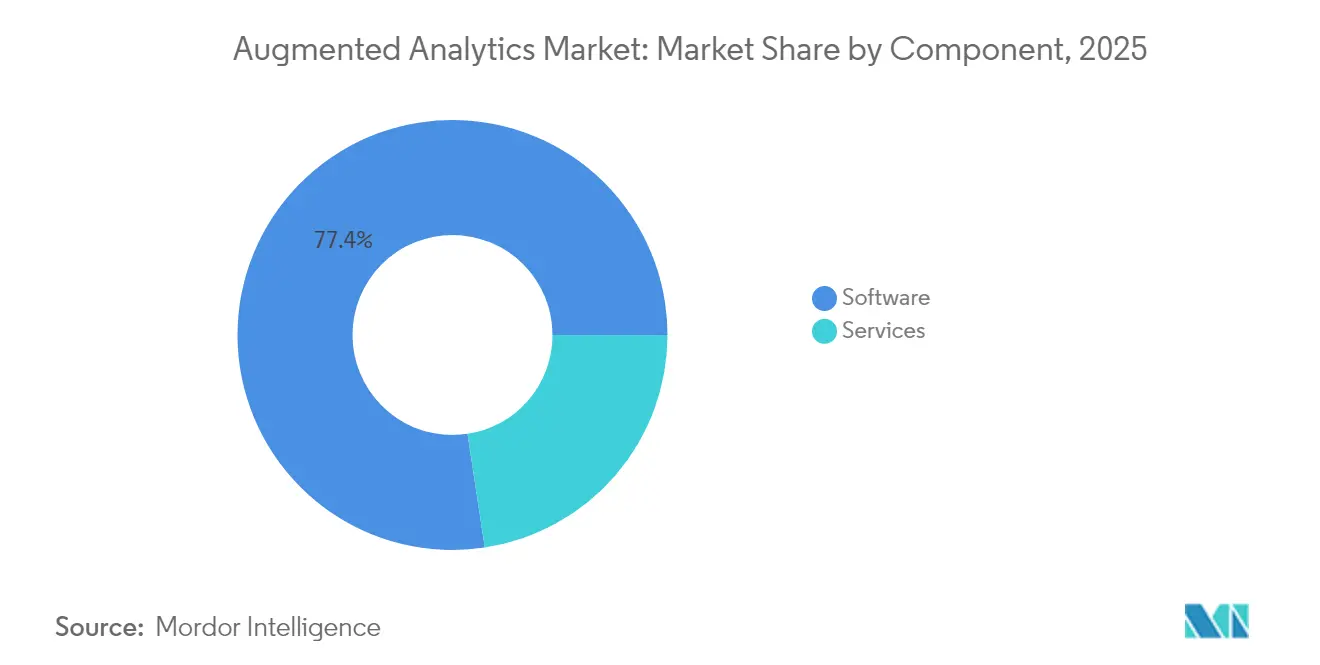
- By component, software captured 77.40% revenue share in 2025; services are projected to grow at a 28.40% CAGR through 2031.
- By deployment mode, cloud accounted for 59.10% of the augmented analytics market share in 2025, while hybrid leads growth at 29.75% CAGR to 2031.
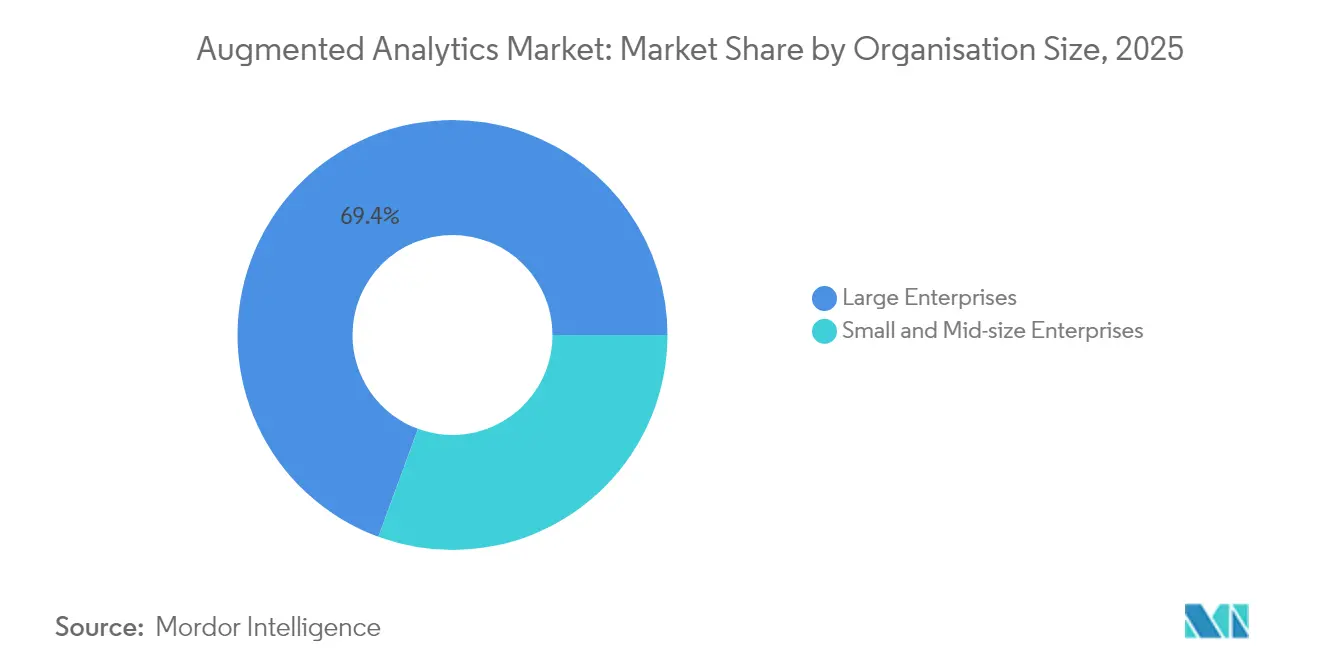
- By organisation size, large enterprises held 69.40% share of the augmented analytics market size in 2025; small and medium-sized enterprises (SMEs) are set to expand at 29.35% CAGR.
- By end-user industry, Banking, Financial Services, and Insurance (BFSI) led with 23.60% revenue share in 2025; retail and consumer goods are advancing at a 28.85% CAGR through 2031.
- By region, North America commanded 47.20% revenue in 2025, whereas Asia-Pacific is forecast to expand at a 28.10% CAGR during 2026-2031.
Note: Market size and forecast figures in this report are generated using Mordor Intelligence’s proprietary estimation framework, updated with the latest available data and insights as of 2026.
Market Trends and Insights
Drivers Impact Analysis of Augmented Analytics Market*
| Driver | (~) % Impact on CAGR Forecast | Geographic Relevance | Impact Timeline |
|---|---|---|---|
| Rising demand to analyse multi-structured data | +4.20% | Global, APAC leads | Medium term (2-4 years) |
| Self-service BI & data democratisation | +3.80% | North America & Europe core; APAC rising | Short term (≤2 years) |
| SME uptake via cloud subscriptions | +3.50% | Global, strong in emerging markets | Medium term (2-4 years) |
| Generative-AI-infused analytics suites | +5.10% | North America & APAC lead; Europe follows | Short term (≤2 years) |
| Edge-tier deployments for data sovereignty | +2.9% | Europe & APAC; expanding globally | Long term (≥4 years) |
| SaaS copilot-led embedded-analytics monetisation | +3.4% | Global, enterprise focus in developed markets | Medium term (2-4 years) |
| Source: Mordor Intelligence | |||
Rising demand to analyse multi-structured data
Nearly 80% of enterprise information is unstructured, spanning documents, images, and machine logs. Advanced language and vision models now parse these formats alongside classic tabular datasets, giving analysts a single discovery surface. Automotive manufacturers use the capability to fuse sensor telemetry with maintenance manuals and raise downtime-forecasting accuracy by 85%. Hospitals are combining radiology scans, clinical notes, and genomic profiles to refine diagnostic pathways. The ability to tap these untapped data pools pushes organisations toward platforms that embed AI-native parsers, reinforcing growth for the augmented analytics market.
Self-service BI and data-democratisation push
Natural-language prompts let marketing managers, finance controllers, and call-centre supervisors run complex queries without SQL. This shift cuts request-to-insight cycles from weeks to minutes and frees data-engineering teams for higher-value tasks. ThoughtSpot’s integration with Google’s Gemini models shows how conversational search hides complexity while returning governed, shareable answers[1]ThoughtSpot, “ThoughtSpot Integrates Gemini for Conversational Analytics,” thoughtspot.com. Higher usage rates improve data-literacy feedback loops, anchoring analytics culture, and lifting the augmented analytics market further.
SME uptake via cloud subscriptions
Subscription bundles priced per seat and auto-scaled by usage remove capital-expenditure barriers that historically sidelined smaller firms. Cloud vendors now pre-configure connectors for accounting, CRM, and e-commerce platforms, allowing a retail startup to plug in sales data and receive AI-generated margin diagnostics within hours. SMEs using analytics tools report 15% revenue improvements and 20% stronger cash-flow forecasting accuracy. The trend injects fresh demand velocity into the augmented analytics market by widening the addressable base.
Generative-AI infused analytics suites
Vendors embed LLMs that proactively scan tables, flag anomalies, and deliver narrative briefings to mobile devices. Microsoft’s USD 80 billion data-centre expansion allocates GPU clusters specifically for these AI copilots. Banks deploy the feature for fraud detection within seconds, and grocers use it for dynamic pricing micro-adjustments. The move from look-back dashboards to forward-seeking agents resets buyer criteria and propels market adoption.
Restraints Impact Analysis of Augmented Analytics Market*
| Restraint | (~) % Impact on CAGR Forecast | Geographic Relevance | Impact Timeline |
|---|---|---|---|
| Data privacy & security demands | -2.80% | Europe leads (GDPR); spreading globally | Short term (≤ 2 years) |
| Workforce anxiety over job replacement | -2.10% | Developed markets first; emerging regions next | Medium term (2-4 years) |
| Prompt-engineering skill gap | -1.9% | Global shortages | Short term (≤ 2 years) |
| GPU scarcity & inference cost inflation | -3.2% | Global supply chain; acute in large enterprises | Medium term (2-4 years) |
| Source: Mordor Intelligence | |||
Data-privacy and security concerns
GDPR and sectoral rules require explicit consent, data minimisation, and audit trails, making unfettered AI experimentation risky. Vendors now launch “sovereign cloud” zones inside regional data centres; MicroStrategy partnered with STACKIT to deliver an EU-compliant stack hosted in Germany and Austria[2]MicroStrategy, “Launch of MicroStrategy Sovereign European Cloud,” microstrategy.com. Compliance overhead slows project rollout, trimming near-term spending even as long-term trust builds.
Workforce anxiety over human-replacement
Employees worry that AI will marginalise their skills, creating resistance that reduces utilisation. Change-management programmes, job-redesign workshops, and reskilling stipends are proving effective in aligning incentives. When construction-materials supplier CEMEX paired analysts with AI copilots, throughput doubled while headcount stayed flat, illustrating augmentation rather than substitution.
*Our forecasts treat driver/restraint impacts as directional, not additive. The impact forecasts reflect baseline growth, mix effects, and variable interactions.
Augmented Analytics Market Segment Analysis
By Component:
Software Dominance Drives Platform InnovationSoftware accounted for 77.40% revenue in 2025 as buyers gravitated toward end-to-end suites bundling ingestion, modelling, and visualisation. In monetary terms, the segment contributed USD 23.07 billion to the augmented analytics market size. Continuous feature releases, such as in-product LLM chatbots, lock in renewals and upsell paths. The services segment, although smaller, is scaling at 28.40% CAGR on the back of implementation, model-governance, and user-adoption projects. As multi-cloud estates grow, clients commission partners to handle policy design, testing, and ROI baselining. Vendor professional-services groups tap this opportunity, while global system integrators build 1,000-person AI studios to capture demand.
Second-order effects reinforce software primacy. When Snowflake embedded Anthropic’s models inside its Cortex service, customers accessed generative summarisation without exporting data, tightening platform dependence. Over the forecast horizon, open-source AI components will evolve, yet buyers still prefer commercial wrappers that guarantee security patches and legal indemnities, sustaining the software segment’s lead within the augmented analytics market.


By Deployment:
Hybrid Models Bridge Sovereignty and PerformanceCloud installations generated 59.10% of total spending in 2025. Financial-services firms, online marketplaces, and streaming networks exploit elasticity for holiday spikes and model-training bursts. However, strict residency mandates push critical workloads to private zones, propelling hybrid setups at a 29.75% CAGR. The hybrid share of the augmented analytics market is projected to rise from USD 13.12 billion in 2026 to USD 48.26 billion by 2031. Edge devices process personally identifiable information locally, then forward aggregated patterns to cloud AI for deeper inference, balancing compliance with analytic depth.
Edge-to-cloud orchestration tools signal the next battleground: platforms must schedule SQL, vector-search, and reinforcement-learning jobs across Kubernetes clusters on both sides of the firewall. Providers able to auto-deploy containers, govern encryption keys, and optimise latency stand to capture an outsized wallet share. On-premises-only deployments remain relevant for nuclear energy, defence, and pharmaceuticals, but growth lags behind hybrid because hardware refresh cycles elongate in capex-constrained sectors.
By Organisation Size:
SME Acceleration Reshapes Market DynamicsLarge enterprises delivered 69.40% of 2025 revenue owing to wide data footprints and complex workload portfolios. For them, the augmented analytics market represents a strategic layer that harmonises operational, customer, and IoT data. Meanwhile, SMEs contribute under 30% today but are expanding at a 29.35% CAGR, outpacing corporate peers. Subscription bundles starting at USD 99 per user per month bundle ETL, visualisation, and LLM credit allowances, making entry frictionless. SME share of the augmented analytics market size for deployment via SaaS is projected to reach USD 49.25 billion by 2031.
Low-code interfaces remove the need for in-house data engineers. A mid-sized apparel brand uses Qlik AutoML to create demand-forecast models that cut stock-outs by 12% after four weeks. As consumer-packaged-goods SMEs witness similar paybacks, viral growth effects amplify. Payment gateways, HRIS vendors, and marketing-automation platforms now embed white-labelled analytics, allowing micro-firms to exploit AI without separate contracts, further democratizing adoption within the augmented analytics market.
By End-user Industry:
Financial Services Leadership Meets Retail InnovationBFSI held 23.60% revenue in 2025 as regulatory stress-testing, anti-money-laundering, and customer-360 initiatives demand advanced analytics. Citigroup’s deployment of autonomous risk copilots monitors exposures in real time and proposes hedging actions, underscoring early maturity. The sector’s share equates to USD 7.04 billion of the 2025 augmented analytics market size. Retail and consumer goods exhibit the fastest 28.85% CAGR, propelled by supply-chain optimisation, dynamic pricing, and hyper-personalised loyalty offers.
Omnichannel chains integrate point-of-sale data, web clicks, and social sentiment to predict demand spikes four weeks ahead, trimming markdown expense. Grocery groups like Aldi pilot AI bots that auto-order replenishment, lowering spoilage by 8%. Healthcare, manufacturing, and telecom also accelerate, but retail’s immediacy of ROI and visible customer impact drive superior budget allocations, reinforcing its role as a growth engine within the augmented analytics market.
Geography Analysis
North America Augmented Analytics Market
North America generated 47.20% of global revenue in 2025 and retains structural advantages: dense cloud-region footprint, venture-capital pipelines, and AI-skilled labour pools. Fortune 500 firms institutionalise AI centre-of-excellence charters, embedding analytics inside finance, supply-chain, and HR apps. Federal funding for AI research and streamlined IPO pathways attract startups that refresh the competitive arena. However, data-localisation clauses in Canada, California Consumer Privacy Act amendments, and antitrust scrutiny introduce compliance spend, nudging firms toward multi-jurisdictional hybrid architectures.
APAC Augmented Analytics Market
Asia-Pacific, while smaller today, is on a 28.10% CAGR trajectory through 2031. Government allocations exceed USD 500 billion for AI infrastructure, semiconductors, and talent development. China’s AI hub in Shenzhen offers subsidised GPU clusters; India’s Digital Personal Data Protection Act sets guardrails while encouraging domestic innovation. Manufacturing conglomerates cluster around Tokyo, Seoul, and Singapore, creating demand flywheels for shop-floor predictive analytics. Local vendors integrate Mandarin, Hindi, and Bahasa speech models, meeting linguistic requirements and giving regional players an edge. The augmented analytics market thus finds its fastest volume expansion in APAC geographies.
Europe Augmented Analytics Market
Europe continues to post mid-teen growth even as GDPR and the forthcoming AI Act heighten vendor obligations. Enterprises in Germany’s Mittelstand adopt sovereign-cloud deployments inside national borders. French public-sector agencies run analytics in isolated regions to comply with citizen-data statutes. Vendor road maps now include “EU trusted zone” labels, reflecting the continent’s regulatory pull. North-to-south digital-skills disparities persist, but EU-funded reskilling programmes close gaps, supporting steady adoption.
LATAM and MEA Augmented Analytics Market
Latin America, the Middle East, and Africa represent later-stage opportunities, together projected to account for just under 9.85% of the augmented analytics market by 2031. Mobile-first business models, rising fintech penetration, and under-banked populations create analytics needs around credit scoring and fraud detection. Cloud-region launches in São Paulo, Riyadh, and Johannesburg lower latency and address data-residency rules, unlocking pilot budgets that convert to production workloads when ROI materialises.

Regulatory Landscape
Augmented analytics deployments are being shaped by AI-specific governance requirements layered over broader data-protection and sector rules. In the European Union, the EU AI Act (Regulation (EU) 2024/1689) establishes a risk-based compliance regime for AI systems, with full application effective August 2, 2026, which elevates requirements such as risk management, data governance, technical documentation, record-keeping, and human oversight into core procurement and product-readiness checks for vendors selling into EU enterprises.
Outside the EU, many buyers anchor governance in formal risk frameworks instead of prescriptive AI laws. The NIST Artificial Intelligence Risk Management Framework (AI RMF 1.0, 2023) is a commonly referenced voluntary standard that organizes controls around govern, map, measure, and manage, influencing how enterprises specify auditability, model monitoring, and accountability in augmented analytics rollouts, particularly in regulated industries like BFSI and healthcare.
Value Chain Analysis
The augmented analytics value chain begins with data generation and collection across ERP/CRM, digital channels, IoT/OT systems, and external sources, followed by ingestion and preparation (connectors, ELT/ETL, data quality, lineage). This feeds into core data platforms (data warehouses, lakehouses, and governance layers), where security, cataloging, and access control determine what can be used for model-assisted analysis.
Model and insight layers then provide LLM-enabled natural language query, AutoML, anomaly detection, and narrative generation, which are delivered through BI applications and embedded analytics in day-to-day business workflows. Downstream value is realized through deployment and operations across cloud, on-premises, and hybrid estates, supported by implementation partners and system integrators that handle governance design, integration, and user adoption. Infrastructure suppliers (notably GPUs and cloud capacity) and platform vendors influence cost and scalability, while interoperability between data stacks and workflow systems is increasingly a differentiator as agentic capabilities move insights into action, including orchestration that connects analytics outputs to enterprise workflow tools and governed semantic models.
Competitive Landscape
The augmented analytics market remains moderately fragmented. Top cloud hyperscalers, Microsoft, Amazon, and Google, bundle analytics into infrastructure-as-a-service contracts, leveraging scale and GPU supply chains. Enterprise application vendors such as SAP and Oracle integrate copilots directly into ERP and CRM modules, improving stickiness among existing licensees. Pure-play analytics firms like ThoughtSpot and Qlik differentiate through speed-optimised search and visual-exploration engines. AI-native disruptors, many under five years old, focus on agentic workflows and vertical packages, for example, healthcare-focused analytic copilots that summarise radiology reports.
Investment flows highlight strategic priorities. Oracle earmarked USD 40 billion to secure NVIDIA accelerators, aiming to guarantee capacity for customers’ AI training budgets. Snowflake’s alliance with Anthropic injects state-of-the-art language models straight into its governed data cloud, circumventing the need for external API hops. Meanwhile, Alibaba Cloud launches vector databases tuned for multilingual queries, appealing to APAC buyers and diaspora SMEs.
Price competition is not the central lever; rather, vendors compete on time-to-insight, security certifications, and total cost of ownership at scale. Ecosystem breadth catalogue connectors, marketplace apps, and certified integrators drive platform gravity. Enterprise buyers increasingly shortlist suppliers offering turnkey governance and compliance artefacts, creating an advantage for firms that invest early in auditability features. Industry-specific models, domain ontologies, and pre-trained datasets become defensible assets, particularly in regulated verticals. Market-share shifts over the forecast horizon will likely hinge on the depth of such vertical moats and the speed at which vendors evolve from dashboard outputs to autonomous decision execution.
Augmented Analytics Industry Leaders
Microsoft Corporation
QlikTech International AB
IBM Corporation
SAP SE
Salesforce Inc
- *Disclaimer: Major Players sorted in no particular order
Augmented Analytics Market Companies Covered in this Report
- Microsoft Corporation
- Salesforce Inc. (incl. Tableau)
- SAP SE
- International Business Machines Corp.
- QlikTech International AB
- Google LLC (Looker)
- Oracle Corporation
- SAS Institute Inc.
- TIBCO Software Inc.
- ThoughtSpot Inc.
- MicroStrategy Inc.
- Sisense Inc.
- GoodData Corp.
- Alteryx Inc.
- Domo Inc.
- Zoho Corporation (Zoho Analytics)
- Amazon Web Services - QuickSight
- Yellowfin BI
- Board International

Market Opportunities and Future Outlook
A key whitespace is enterprise-grade agentic analytics that remains governed while operating across hybrid estates, translating conversational requests into multi-step analysis and workflow execution without exporting sensitive datasets. One supporting proof point is hyperscalers productizing natural language analytics inside core data platforms, including Google Cloud making Conversational Analytics in BigQuery generally available in July 2026, and platform vendors extending autonomous analytics across both cloud and on-premises, such as Teradata announcing general availability of its Teradata Autonomous Knowledge Platform in July 2026.
Compliance-ready analytics is another opportunity area for regulated industries, where auditability, documentation, and human oversight are required as part of AI governance programs. With full application of the EU AI Act effective August 2, 2026, buyers are standardizing risk management and traceability requirements inside analytics tooling and services, which is translating into demand for packaged governance artifacts, explainability features, and implementation services that operationalize controls across data pipelines, models, and user-facing insight interfaces.
Recent Industry Developments in Augmented Analytics Market
- April 2026: Qlik announced a strategic partnership with ServiceNow to integrate the Qlik Analytics Engine with ServiceNow Workflow Data Fabric and introduced a new Predict Agent for forward-looking business questions. The integration connects analytics outputs more directly to operational workflows, positioning agentic analytics as part of day-to-day execution rather than a separate BI layer.
- March 2025: Amazon Web Services introduced scenarios in Amazon Q for QuickSight, enabling employees to run expert-level analysis through natural language and citing a ten-fold productivity gain at BMW Group and Availity. The update added pressure on BI suites to embed LLM-assisted analysis as a standard experience for non-technical users.
- November 2024: Pyramid Analytics raised USD 50 million from BlackRock, supporting continued product investment in augmented analytics capabilities. The funding reinforced sustained investor backing for independent analytics vendors competing alongside hyperscalers and enterprise application suites.


Augmented Analytics Market Report Scope and Research Methodology
Market Definition and Coverage
The augmented analytics market is defined as revenue earned from software and related services that use AI-driven automation to prepare data, suggest insights, and support natural language style analysis for business users across industries.
Scope exclusions: This sizing excludes general-purpose data storage, hardware infrastructure, and pure consulting work that is not tied to augmented analytics product delivery.
Segments Covered in This Report
- By Component
- Software
- Services
- By Deployment
- On-premise
- Cloud
- Hybrid
- By Organisation Size
- Large Enterprises
- Small and Mid-size Enterprises
- By End-user Industry
- BFSI
- Telecom and IT
- Retail and Consumer Goods
- Healthcare and Life Sciences
- Manufacturing
- Media and Entertainment
- Government and Public Sector
- By Geography
- North America
- US
- Canada
- Mexico
- South America
- Brazil
- Argentina
- Rest of South America
- Europe
- Germany
- United Kingdom
- France
- Italy
- Russia
- Asia Pacific
- China
- Japan
- India
- South Korea
- Rest of Asia Pacific
- Middle East
- Saudi Arabia
- United Arab Emirates
- Qatar
- Rest of Middle East
- Africa
- South Africa
- Nigeria
- Rest of Africa
- North America
Data Sources, Market Sizing, and Validation
Desk Research
Desk work starts by mapping the demand and supply setting for augmented analytics, so the model does not over-count general BI, basic dashboards, or adjacent data management tools. We rely on public, non-paywalled references such as the US Bureau of Labor Statistics (data and analytics jobs), the US Census Bureau (IT services benchmarks), OECD digital economy indicators, World Bank macro data series, and standards or guidance pages from organizations such as ISO and NIST for common terminology and adoption context.
We also review company filings, earnings decks, product documentation, pricing pages, and reputable technology press to understand how revenue is recognized for software subscriptions versus services, and where augmented features are positioned in product lines. Where available, paid subscriptions for company financials and news are used to normalize reported numbers and corporate structure changes, and a patent database is referenced to gauge feature maturity and new capability launches. These sources are not exhaustive, and many other public documents were reviewed to support data collection, validation, and clarification.
Primary Interviews and Surveys
Primary inputs come from interviews and surveys with analytics platform teams, system integrators, and enterprise buyers who run data and BI functions, which helps us test adoption rates, packaging patterns, and typical pricing movement. We collect feedback across major user industries and regions so assumptions like cloud share, renewal behavior, and attach rates for services can be adjusted before final totals are set.
Distribution of primary research fieldwork respondents
| Company type | Respondent position | Region |
|---|---|---|
| Top tier: 29% | CXOs: 17% | APAC: 45% |
| Mid tier: 51% | Functional/Unit leaders: 35% | EMEA: 31% |
| Smaller Players: 20% | Managers: 48% | Americas: 24% |
Market-Sizing & Forecasting
Sizing is built using a top-down approach where enterprise analytics and software spending pools are reconstructed, then narrowed using penetration and mix assumptions that are specific to augmented analytics. To keep the math anchored, the cut-down factors are tied to observable signals such as cloud versus on-premise preference, seat-based subscription patterns, typical implementation timelines, and the share of deployments that include automated insight generation and natural language features.
Once the top layer is set, we corroborate it with selective bottom-up checks using sampled vendor revenue disclosures, channel feedback on deal sizes, and an ASP multiplied by an approximation of active users in priority industries. When data is missing for smaller providers or private entities, gaps are handled through peer benchmarking on pricing tiers and customer counts, and then the impact is capped so it does not inflate totals.
Forecasts are developed using scenario analysis supported by a light multivariate regression, where drivers such as enterprise AI adoption, data volume growth, analytics talent constraints, and IT budget outlook are used as inputs. Assumptions are stress-tested with interview feedback, and the final growth path is selected only after it matches expected product bundling behavior and renewal cycles.
Data Validation & Update Cycle
Validation is done by triangulating outputs against independent signals, including software category growth, cloud migration pace, and reported expansion of analytics users in large enterprises. Outliers are reviewed through variance checks by year and region, and then traced back to the driver assumptions so the logic remains consistent.
Before sign-off, the model and key inputs go through multi-step analyst reviews, and follow-up calls are triggered when a major mismatch is seen in pricing, adoption, or vendor positioning. Reports are refreshed annually, with interim updates when material events occur, and a final pre-delivery pass is completed so clients receive the latest updated view.
Mordor Intelligence's Augmented Analytics Market Size Compared With Other Published Estimates
Published numbers for augmented analytics can vary widely, even when the topic sounds similar, because the included product scope and the year used for the base can shift the total by a lot. We also see differences when studies combine broader analytics categories, or when they treat services differently, apply a different deployment mix, or reflect currency timing.
The main gap comes from whether the estimate counts wider advanced analytics and BI revenues as augmented analytics. In this work, Mordor Intelligence treats the market as only software and services that directly deliver AI-assisted insight automation, including natural language analysis, across the defined deployments and regions.
Benchmark comparison
| Source | Market Size | Gaps in Research Methodology |
|---|---|---|
| Mordor Intelligence | USD 37.96 B (2026) | |
| Industry Publisher A | USD 22.21 B (2024) | Uses an earlier base year and a 2024 to 2030 window, and the component treatment can differ when software definitions include broader BI tool revenue that is not always augmented feature-led. |
| Regional Consultancy B | USD 9.20 B (2024) | Leans on a narrower current-year sizing with different adoption and pricing assumptions, and it can under-capture enterprise-wide deployments when only a limited set of industries or functions is emphasized. |
The spread in the table is mainly explained by time framing and what is counted as augmented versus adjacent analytics spending. Our approach keeps the total tied to a clear demand pool, and it is checked with practical pricing and adoption signals so the estimate can be repeated and updated without hidden steps.


Key Questions Answered in the Report
What is the current value of the augmented analytics market?
The augmented analytics market is valued at USD 37.96 billion in 2026 and is projected to reach USD 127.18 billion by 2031 at a 27.35% CAGR.
Which deployment model is growing fastest?
Hybrid deployments lead growth at 29.75% CAGR through 2031 as firms balance cloud agility with on-premises data-sovereignty needs.
Why are SMEs adopting augmented analytics so rapidly?
Subscription-based cloud platforms remove up-front infrastructure costs and provide low-code interfaces, enabling SMEs to realise 15% revenue uplifts and faster decision cycles.
What industries invest most heavily today?
Banking, Financial Services, and Insurance hold 23.60% revenue share, leveraging AI for risk management and fraud detection.
Which region will see the highest future growth?
Asia-Pacific is forecast to expand at 28.10% CAGR due to substantial government AI initiatives and large-scale infrastructure investments.
What is the main restraint on near-term market expansion?
GPU scarcity and rising inference costs, combined with strict data-privacy regulations, currently slow large-scale rollouts, though hyperscaler investments aim to ease the bottleneck.
Page last updated on:


