Cyberwarfare Market Size and Share
Market Overview
| Study Period | 2020 - 2031 |
|---|---|
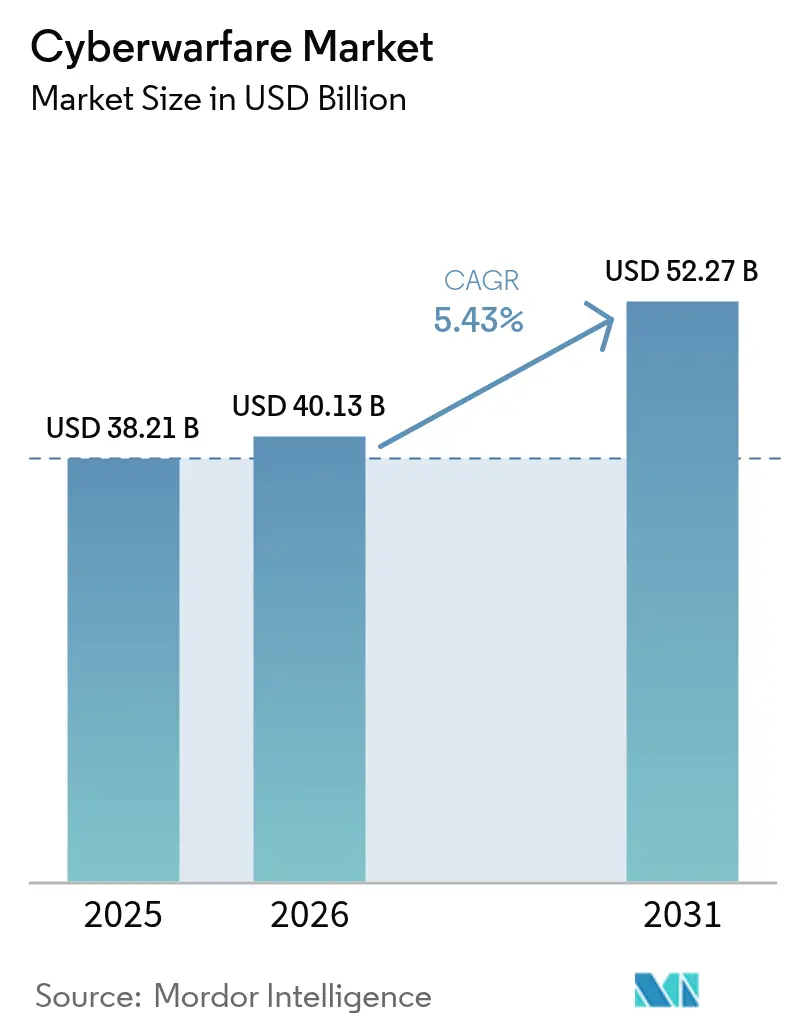
| Market Size (2026) | USD 40.13 Billion |
| Market Size (2031) | USD 52.27 Billion |
| Growth Rate (2026 - 2031) | 5.43% CAGR |
| Fastest Growing Market | Asia Pacific |
| Largest Market | North America |
| Market Concentration | Medium |
Major Players *Disclaimer: Major Players sorted in no particular order Image © Mordor Intelligence. Reuse requires attribution under CC BY 4.0. | |
Cyberwarfare Market Analysis by Mordor Intelligence
The cyberwarfare market size is projected to expand from USD 38.21 billion in 2025 and USD 40.13 billion in 2026 to USD 52.27 billion by 2031, registering a CAGR of 5.43% between 2026 to 2031. Rising allocations for offensive programs, NATO’s recognition of cyberspace as a warfighting domain, and expanding zero-trust adoption are shifting purchasing away from perimeter tools toward exploit development, autonomous threat hunting, and cognitive-warfare platforms. Traditional aerospace primes now compete directly with cloud-native cybersecurity vendors, and both groups face margin pressure as governments favor solutions that deliver continuous updates through secure DevSecOps pipelines. Procurement cycles are being accelerated by headline-grabbing ransomware attacks on critical infrastructure and by the talent shortage that is pushing agencies toward managed services. The cyberwarfare market, therefore, reflects a strategic realignment, where speed of software release and access to cleared personnel determine contract wins more than legacy weapons-system experience.
Key Report Takeaways
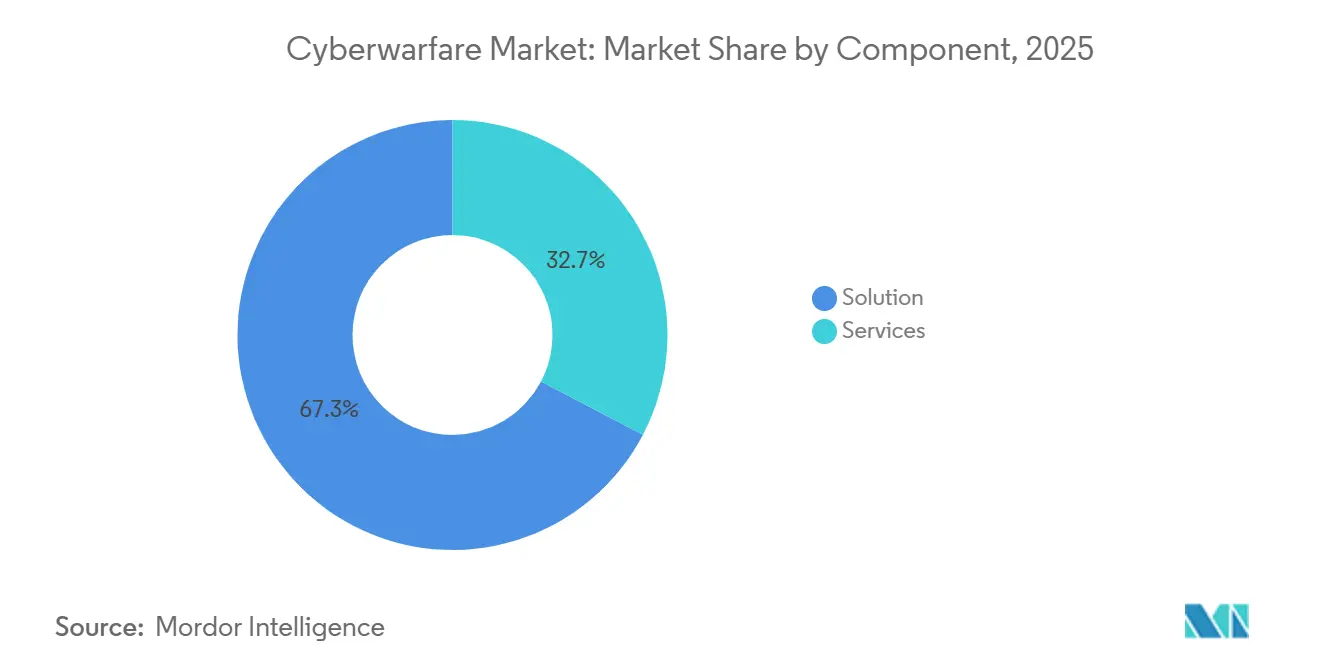
- By component, solution offerings commanded 67.32% of share in 2025, while the services segment is expanding at a 6.32% CAGR through 2031.
- By deployment mode, on-premises installations held 36.69% of the share in 2025, whereas the cloud-based segment is advancing at a 6.73% CAGR to 2031.
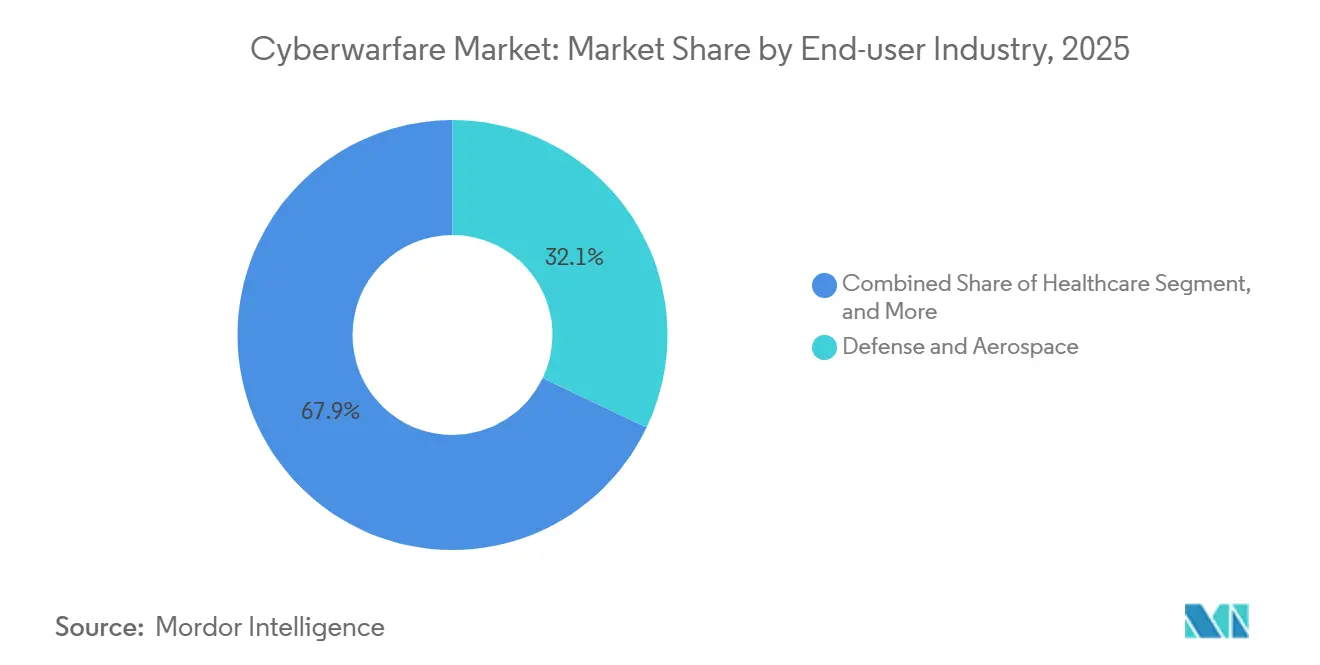
- By end-user industry, defense and aerospace accounted for 32.08% of the market share in 2025, and healthcare is advancing at a 7.13% CAGR through 2031.
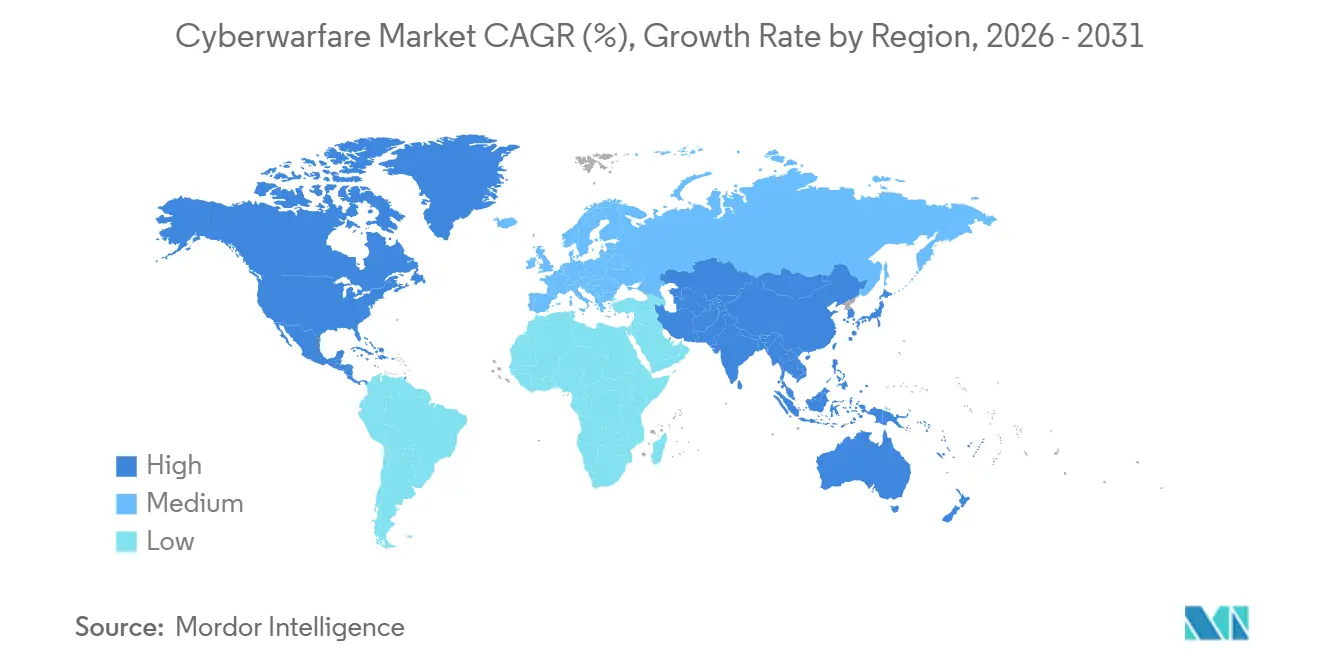
- By geography, North America retained 39.43% share in 2025, and Asia-Pacific is projected to expand at a 7.02% CAGR to 2031.
Note: Market size and forecast figures in this report are generated using Mordor Intelligence’s proprietary estimation framework, updated with the latest available data and insights as of 2026.
Global Cyberwarfare Market Trends and Insights
Drivers Impact Analysis*
| DRIVER | (~) % IMPACT ON CAGR FORECAST | GEOGRAPHIC RELEVANCE | IMPACT TIMELINE |
|---|---|---|---|
| Escalating Nation-State Sponsored Cyber-Espionage Programs | +1.2% | Global, acute in North America, Europe, Asia-Pacific | Medium term (2-4 years) |
| Rapid Digitalization of Military C4ISR Networks | +1.0% | North America, Europe, Asia-Pacific | Long term (≥4 years) |
| Surge in Critical Infrastructure Attacks Prompting Defense Budgets | +0.9% | Global, high in Europe and North America | Short term (≤2 years) |
| NATO “Cyber as Domain” Doctrine and Allied Procurement Cycles | +0.8% | Europe and North America | Medium term (2-4 years) |
| Proliferation of AI-Enabled Autonomous Offensive Tools | +0.7% | North America, Asia-Pacific, Middle East | Long term (≥4 years) |
| Commercial Satellite Internet Creating New Attack Surface | +0.5% | Global, early in conflict zones | Medium term (2-4 years) |
| Source: Mordor Intelligence | |||


Escalating Nation-State Sponsored Cyber-Espionage Programs
Advanced persistent threat collectives linked to China’s APT31 and Russia’s ELECTRUM escalated operations in 2025, breaching defense contractors and European energy grids. Ransomware has become an additional revenue stream for these units, with CISA documenting a 49% year-over-year rise in operational-technology incidents.[1]CISA, “Ransomware Threat Report 2025,” CISA.GOV Budgets, therefore, favor vendors that maintain zero-day stockpiles and autonomous exploit frameworks capable of pre-emptive disruption. The driver is strongest in North America and Europe, where defense ministries now embed cyber battalions inside traditional command structures, and in Asia-Pacific, where China-Taiwan tensions spur continual red-teaming exercises. As a result, the cyberwarfare market sees increasing demand for managed threat-intelligence feeds that fuse satellite imagery, dark-web chatter, and open-source signals.
Rapid Digitalization of Military C4ISR Networks
Initiatives such as the United States Joint All-Domain Command and Control program and NATO’s Allied Command Transformation accelerate cloud-hybrid adoption for mission data. While real-time fusion enhances situational awareness, migrating C4ISR workloads onto commercial satellite networks such as Starlink exposes new jamming and spoofing vectors that adversaries actively probe. Dependence on hyperscalers forces ministries to fund quantum-resistant encryption and software-defined networking hardened to military standards. Over the long term, overlap between military and civilian critical infrastructure means a compromise in one domain cascades to the other, compelling procurement of dual-use platforms that protect industrial control systems alongside battlefield sensors.
Surge in Critical Infrastructure Attacks Prompting Defense Budgets
The USD 22 million ransom paid in the February 2024 Change Healthcare breach highlighted systemic risk in medical systems and triggered CEO-level scrutiny of cyber resilience. Poland’s December 2025 grid intrusion forced emergency load shedding, pushing the European Union to enforce the NIS2 Directive with fines up to EUR 10 million (USD 10.8 million). Government agencies are reallocating funds from perimeter firewalls toward managed detection and incident-response retainers, driving service revenue growth within the cyberwarfare market. Regulatory penalties in North America and Europe incentivize boards to treat cybersecurity as fiduciary duty, accelerating near-term spending despite fiscal constraints.
NATO “Cyber as Domain” Doctrine and Allied Procurement Cycles
NATO’s 2025 commitment that members earmark 1.5% of GDP specifically for cyber and space has produced a multi-year, EUR 3 billion (USD 3.2 billion) allied investment in hardened communications. The Cooperative Cyber Defence Centre of Excellence in Tallinn is setting certification baselines that increasingly appear in tender requirements, effectively establishing a common entry barrier for vendors. European primes such as Thales and Leonardo have partnered with U.S. software firms to satisfy interoperability clauses. Smaller allies in Eastern Europe fast-track acquisitions to close gaps revealed by Russian intrusions, making consortium bids the preferred strategy for capturing rapid prototype awards.
Restraints Impact Analysis*
| Restraint | (~) % Impact on CAGR Forecast | Geographic Relevance | Impact Timeline |
|---|---|---|---|
| Acute Shortage of Cleared Cyber-Warfare Personnel | -0.6% | Global, severe in North America and Europe | Long term (≥4 years) |
| Attribution Complexity Limiting Proportional Response | -0.4% | Global, challenging for NATO and Asia-Pacific doctrines | Medium term (2-4 years) |
| Fragmented International Law on Offensive Cyber Operations | -0.3% | Global | Long term (≥4 years) |
| Supply-Chain Trust Gaps in Open-Source and COTS Components | -0.3% | Global, high in North America and Europe | Medium term (2-4 years) |
| Source: Mordor Intelligence | |||
Acute Shortage of Cleared Cyber-Warfare Personnel
ISC2 reported a 4 million-person global cybersecurity workforce gap in 2024, with the steepest shortages for roles requiring Top Secret or Sensitive Compartmented Information clearances.[2] ISC2 Research Team, “Cybersecurity Workforce Study 2024,” ISC2.ORG Median salaries for cleared penetration testers in the United States now exceed USD 150,000, inflating project budgets and provoking talent poaching across contractors. Clearance adjudication backlogs delay cyber-range buildouts by up to twelve months, hindering delivery of managed security operations centers. Universities are not graduating enough candidates, and strict citizenship rules narrow the pool further. Pilot “trusted insider” programs that admit foreign nationals remain experimental, so labor scarcity is likely to persist through the forecast horizon, restraining the cyberwarfare market size growth.
Attribution Complexity Limiting Proportional Response
Adversaries route attacks through multi-hop commercial infrastructure and seed false-flag artifacts, making definitive attribution technically elusive. The Tallinn Manual underscores that existing international law does not resolve evidentiary thresholds for cyber incidents.[3]NATO CCDCOE Analysts, “Poland Energy Grid Intrusions Analysis,” CCDCOE.ORG Without airtight attribution, governments hesitate to invoke collective defense clauses or launch proportional kinetic responses, which in turn dampens demand for offensive retaliation platforms. Divergent national interpretations create policy friction inside alliances, as seen when European states declined to formally blame Russia for the 2025 grid attacks despite strong indicators. Unless breakthroughs in telemetry correlation arrive, legal ambiguity will continue to temper acquisition of certain offensive capabilities within the cyberwarfare market.
*Our forecasts treat driver/restraint impacts as directional, not additive. The impact forecasts reflect baseline growth, mix effects, and variable interactions.
Segment Analysis
By Component: Services Outpace Solutions in Growth Velocity
Services captured 32.68% of share in 2025, expanding at a 6.32% CAGR that exceeds solution growth, signaling a shift in how the cyberwarfare market is delivered. Managed detection, incident response, and cyber-range training are purchased as turnkey subscriptions that address agency talent gaps. The February 2024 Change Healthcare ransomware event alone generated USD 50 million in remediation fees, underscoring why boards favor guaranteed service levels over sporadic tool purchases. Training range demand is buoyed by NATO’s Locked Shields exercise, which requires red-teaming platforms able to replicate advanced persistent threat tactics.
Solution suites still account for 67.32% of share in 2025, but vendors now bundle exploit development, threat intelligence, and cognitive-warfare analytics into integrated DevSecOps pipelines. Zero-day vulnerabilities for critical operating systems command USD 1 million premiums, a reminder that the offensive slice of the cyberwarfare market size remains high margin. Extended detection and response tools ingest endpoint, network, and cloud telemetry and feed AI models that triage alerts at machine speed. Psychological-operations tooling, an emergent category, is quietly added to secure catalogs as governments invest in counter-disinformation capabilities.

By Deployment Mode: Cloud Architectures Gain Traction Despite Sovereignty Concerns
On-premises architectures retained 36.69% share in 2025, reflecting latency, air-gap, and classification constraints that remain non-negotiable for many defense users. Yet cloud deployments post the fastest 6.73% CAGR, indicating that the cyberwarfare market is embracing elasticity for analytics and large-scale telemetry correlation. FedRAMP High authorizations granted to Azure Government and Amazon GovCloud permit controlled unclassified workloads and some secret-level data, catalyzing uptake among U.S. agencies.
European buyers remain cautious, prompting the GAIA-X initiative that seeks a sovereign alternative to U.S. hyperscalers. Hybrid models are rising as compromise; sensitive data remains on-premises while cloud analytics scale AI inferencing across allied networks. Vendor differentiation increasingly hinges on secure orchestration, with platforms such as Palo Alto Networks’ Cortex XSIAM delivering shared threat intelligence that smaller on-premises systems cannot match. As geopolitical trust frames procurement decisions, regional cloud providers in Asia-Pacific and Europe compete by emphasizing data residency guarantees, keeping the cyberwarfare market share of global hyperscalers in check.
By End-User Industry: Healthcare Emerges as Fastest-Growing Vertical
Defense and aerospace held the largest 32.08% of share in 2025, sustained by multibillion-dollar offensive and defensive programs. However, ransomware targeting electronic health records propelled healthcare to a 7.13% CAGR, the steepest across industries. The U.S. Department of Health and Human Services proposed mandatory cyber controls in 2025, making compliance non-optional for HIPAA entities. Hospitals therefore invest heavily in endpoint isolation, immutable backups, and managed detection, enlarging the cyberwarfare market size within the medical sector.
Banking, financial services, and insurance represent roughly 18% of spending, driven by the EU Digital Operational Resilience Act and high-profile incidents such as the ICBC Financial Services breach. Utilities pour funds into industrial control security after the December 2025 Poland grid attack. Government and transportation agencies prioritize software bill-of-materials visibility to blunt supply-chain exploits. Across sectors, cyber insurance underwriting now mandates multi-factor authentication and offline backups, turning best practice into contractual obligation and channeling new dollars into the cyberwarfare market.

Geography Analysis
North America retained 39.43% of share in 2025 as the United States National Defense Authorization Act allocated USD 15.1 billion for cyber operations in fiscal 2026, complemented by a USD 473.4 million U.S. Cyber Command budget increase. Canada modernizes its Communications Security Establishment with AI detection tools, and Mexico is forming a national cybersecurity agency after ransomware crippled state energy firms. Commercial satellite constellations such as Starlink expand connectivity but introduce spoofing risks, prompting new funding for anti-jam technology. The cyberwarfare market share in North America, therefore, balances innovation gains against emergent orbital vulnerabilities.
Asia-Pacific records the fastest 7.02% CAGR through 2031, propelled by China-Taiwan cyber clashes, India’s Defense Cyber Agency formation, and ASEAN threat-intelligence collaboration. Japanese and South Korean semiconductor firms hardened intellectual-property defenses after repeated APT41 raids, while Australia’s USD 6.5 billion cyber strategy builds sovereign ranges and offensive workforces. Southeast Asian utilities accelerate spending after ransomware hit Indonesian and Philippine grids, demonstrating that growth spans from advanced economies to emerging markets. Such diversity makes Asia-Pacific the most dynamic theater for vendor expansion within the cyberwarfare market.
Europe’s uptick concentrates in Eastern members; Poland budgeted EUR 2.5 billion (USD 2.7 billion) for cyber defense to 2028 and the Baltic trio fast-tracked purchases after Russian grid intrusions. The NIS2 Directive enforces strict controls with fines up to EUR 10 million (USD 10.8 million), driving compliance spending among critical operators. Germany pilots quantum-safe encryption, and Nordic countries pool resources for a shared defense center. South America, Middle East, and Africa collectively remain under 20% of the cyberwarfare market share but show pockets of rapid growth, including Saudi Arabia’s USD 1.3 billion National Cybersecurity Authority program.

Competitive Landscape
The cyberwarfare market is moderately fragmented. Lockheed Martin, Northrop Grumman, and BAE Systems leverage classified program experience to secure offensive platform awards, yet they face competition from CrowdStrike, Palantir, and Darktrace, which deploy cloud-native services at lower total cost. Partnerships blur lines; Thales and Google Cloud offer a sovereign solution that satisfies European data-residency mandates. Leonardo integrates Check Point’s AI detection to improve command suites, highlighting how primes import niche software to remain relevant.
Disruptors expand through compliance certifications. CyberArk’s FedRAMP High authorization opened U.S. federal privileged-access contracts, while Parsons won USD 967 million supporting Space Force cyber operations by combining satellite expertise with red-teaming skills. Vendor differentiation now centers on AI automation that lowers analyst workloads, with Darktrace’s ActiveAI claiming autonomous neutralization of in-progress attacks. The persistent shortage of cleared professionals intensifies talent poaching, inflating labor costs, and elongating delivery schedules across the board.
Compliance has evolved into a competitive moat; firms sporting FedRAMP High, ISO 27001, and Common Criteria listings enter restricted tenders that exclude uncertified peers. Market entry barriers thus rise even while technology commoditizes. White-space opportunities exist in cognitive warfare, where NATO’s Strategic Communications Centre of Excellence is defining technical baselines yet few commercial products have matured. Vendors able to satisfy both accreditation and classified psychological-operations requirements are positioned to capture disproportionate cyberwarfare market share growth over the next five years.
Cyberwarfare Industry Leaders
Lockheed Martin Corporation
BAE Systems plc
Northrop Grumman Corporation
General Dynamics Corporation
The Boeing Company
- *Disclaimer: Major Players sorted in no particular order

Recent Industry Developments
- February 2026: Northrop Grumman announced a USD 1.2 billion contract with the U.S. Air Force for an AI-powered cyber mission platform integrating offensive and defensive capabilities.
- January 2026: Palantir secured a five-year, USD 480 million extension with U.S. Cyber Command to expand Gotham and Apollo for classified threat-intelligence fusion.
- December 2025: Poland’s Ministry of National Defence awarded a EUR 850 million (USD 920 million) contract to a Leonardo and Thales consortium for a national cyber-defense operations center.
- November 2025: Lockheed Martin launched its Cyber Resilience Platform, a FedRAMP High authorized cloud-hybrid solution piloted by the U.S. Navy.


Global Cyberwarfare Market Report Scope
Cyber warfare refers to the use of digital attacks by nations or organizations to disrupt, damage, or gain unauthorized access to another nation's or organization's information systems, networks, or infrastructure. It encompasses a range of activities, including cyber espionage, sabotage, and other forms of cyber aggression, often aimed at achieving strategic, political, or economic objectives.
The Cyberwarfare Market Report is Segmented by Component (Solution, and Services), Deployment Mode (On-premises, Cloud-based, and Hybrid), End-user Industry (Defense and Aerospace, BFSI, Corporate, Power and Utilities, Government, Healthcare, Transportation and Logistics, and Other End-user Industries), and Geography (North America, South America, Europe, Asia-Pacific, and Middle East and Africa). The Market Forecasts are Provided in Terms of Value (USD).
| Solution | Offensive Platforms and Exploits | |
| Defensive Platforms (SOC, SIEM, EDR) | Threat Intelligence and Analytics | |
| Cognitive Operations Training | Cognitive Warfare Platforms | |
| Psychological Operations (PSYOPS) Technology | ||
| Disinformation and Misinformation Tools | ||
| Information Warfare Platforms | ||
| Cognitive Electronic Warfare (CEW) | ||
| Perception Management Services | ||
| Social Media Intelligence and Manipulation | ||
| Services | Managed Security Services (MSSPs) | |
| Incident Response and Forensics | ||
| Training & Simulation (Cyber Ranges) | ||
| Threat Intelligence Services | ||
| Penetration Testing and Red Teaming | ||
| On-premises |
| Cloud-based |
| Hybrid |
| Defense and Aerospace |
| BFSI |
| Corporate |
| Power and Utilities |
| Government |
| Healthcare |
| Transportation and Logistics |
| Other End-user Industries |
| North America | United States | |
| Canada | ||
| Mexico | ||
| South America | Brazil | |
| Argentina | ||
| Rest of South America | ||
| Europe | Germany | |
| United Kingdom | ||
| France | ||
| Italy | ||
| Spain | ||
| Poland | ||
| Romania | ||
| Finland | ||
| Sweden | ||
| Norway | ||
| Lithuania | ||
| Estonia | ||
| Latvia | ||
| The Netherlands | ||
| Switzerland | ||
| Rest of Europe | ||
| Asia-Pacific | China | |
| Japan | ||
| India | ||
| South Korea | ||
| South-East Asia | ||
| Rest of Asia-Pacific | ||
| Middle East and Africa | Middle East | Saudi Arabia |
| United Arab Emirates | ||
| Rest of Middle East | ||
| Africa | South Africa | |
| Egypt | ||
| Rest of Africa | ||
| By Component | Solution | Offensive Platforms and Exploits | |
| Defensive Platforms (SOC, SIEM, EDR) | Threat Intelligence and Analytics | ||
| Cognitive Operations Training | Cognitive Warfare Platforms | ||
| Psychological Operations (PSYOPS) Technology | |||
| Disinformation and Misinformation Tools | |||
| Information Warfare Platforms | |||
| Cognitive Electronic Warfare (CEW) | |||
| Perception Management Services | |||
| Social Media Intelligence and Manipulation | |||
| Services | Managed Security Services (MSSPs) | ||
| Incident Response and Forensics | |||
| Training & Simulation (Cyber Ranges) | |||
| Threat Intelligence Services | |||
| Penetration Testing and Red Teaming | |||
| By Deployment Mode | On-premises | ||
| Cloud-based | |||
| Hybrid | |||
| By End-user Industry | Defense and Aerospace | ||
| BFSI | |||
| Corporate | |||
| Power and Utilities | |||
| Government | |||
| Healthcare | |||
| Transportation and Logistics | |||
| Other End-user Industries | |||
| By Geography | North America | United States | |
| Canada | |||
| Mexico | |||
| South America | Brazil | ||
| Argentina | |||
| Rest of South America | |||
| Europe | Germany | ||
| United Kingdom | |||
| France | |||
| Italy | |||
| Spain | |||
| Poland | |||
| Romania | |||
| Finland | |||
| Sweden | |||
| Norway | |||
| Lithuania | |||
| Estonia | |||
| Latvia | |||
| The Netherlands | |||
| Switzerland | |||
| Rest of Europe | |||
| Asia-Pacific | China | ||
| Japan | |||
| India | |||
| South Korea | |||
| South-East Asia | |||
| Rest of Asia-Pacific | |||
| Middle East and Africa | Middle East | Saudi Arabia | |
| United Arab Emirates | |||
| Rest of Middle East | |||
| Africa | South Africa | ||
| Egypt | |||
| Rest of Africa | |||


Key Questions Answered in the Report
What is the forecast value of the cyberwarfare market in 2031?
The cyberwarfare market is projected to reach USD 52.27 billion by 2031.
Which region is expected to grow fastest through 2031?
Asia-Pacific shows the highest 7.02% CAGR, driven by escalating state conflicts and new cyber agencies.
Why are services growing faster than solutions?
Agencies rely on managed detection, incident response, and cyber-range training to offset talent shortages, leading to a 6.32% CAGR for services.
Which deployment mode is increasing its share most rapidly?
Cloud-based architectures register a 6.73% CAGR as FedRAMP High authorizations and hybrid designs gain trust.
Which industry vertical shows the quickest rise in spending?
Healthcare leads with a 7.13% CAGR due to ransomware pressures and proposed regulatory mandates.
Page last updated on:


