Consumer Security Market Size and Share
Market Overview
| Study Period | 2020 - 2031 |
|---|---|
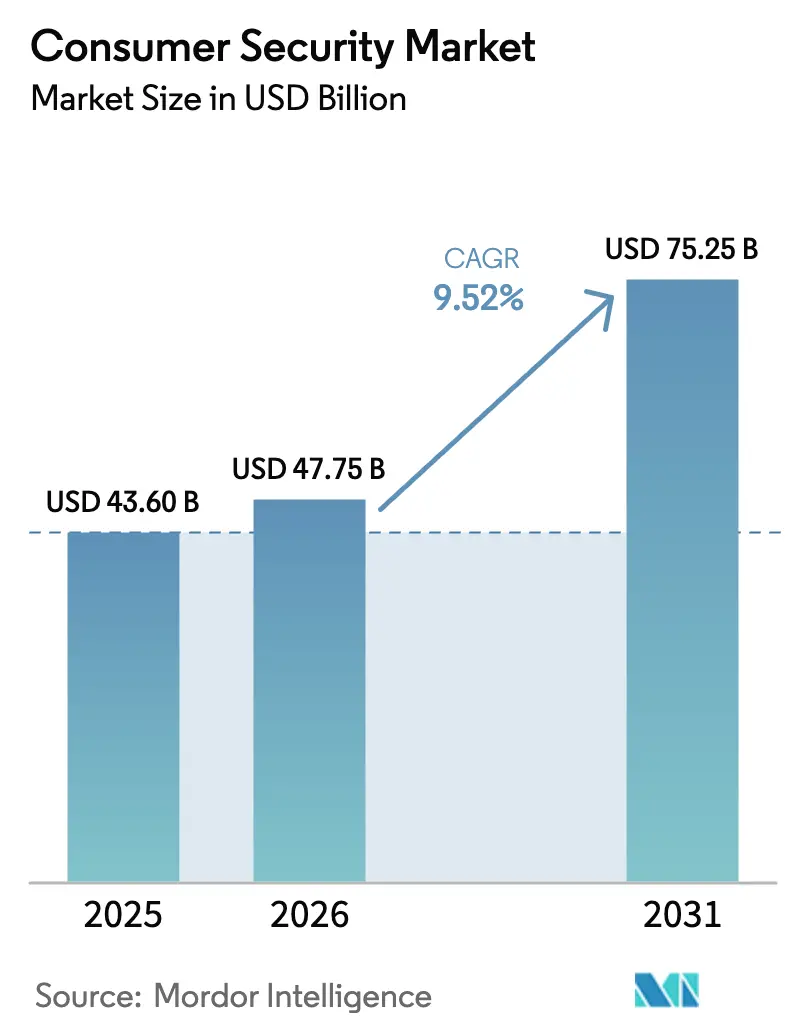
| Market Size (2026) | USD 47.75 Billion |
| Market Size (2031) | USD 75.25 Billion |
| Growth Rate (2026 - 2031) | 9.52% CAGR |
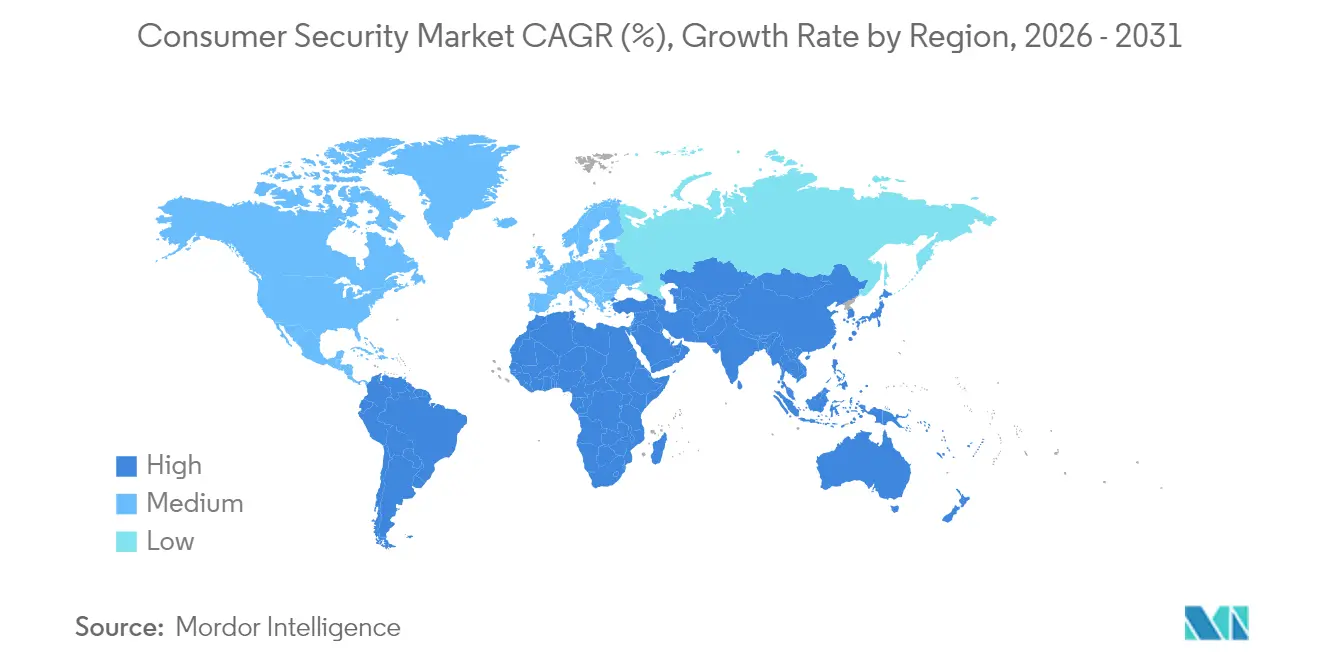
| Fastest Growing Market | Asia Pacific |
| Largest Market | North America |
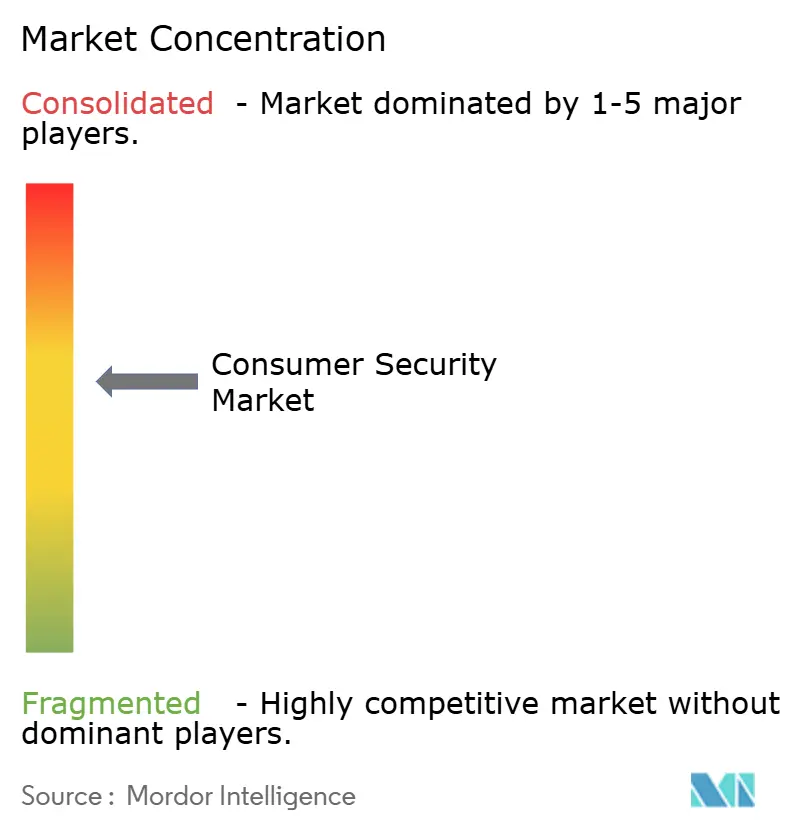
| Market Concentration | Medium |
Major Players *Disclaimer: Major Players sorted in no particular order Image © Mordor Intelligence. Reuse requires attribution under CC BY 4.0. | |
Consumer Security Market Analysis by Mordor Intelligence
The consumer security market size was valued at USD 43.6 billion in 2025 and estimated to grow from USD 47.75 billion in 2026 to reach USD 75.25 billion by 2031, at a CAGR of 9.52% during the forecast period (2026-2031). This expansion takes place against a backdrop of escalating cybercrime losses, expanding household attack surfaces and tightening privacy rules, all of which keep protection tools front-of-mind for individual users. The market’s momentum benefits from the fast adoption of AI-native personal cyber assistants and an enlarging base of internet-connected devices that now permeate daily life. Cloud delivery models are gaining ground, yet on-device installations remain significant because many consumers still prefer local control of sensitive data. Competitive intensity stays moderate as established platforms lean on large subscriber bases while newer entrants compete through single-purpose innovations and telco distribution deals. Price sensitivity in emerging economies and the presence of free built-in operating-system protection temper near-term upside, but premium bundled suites continue to win subscribers who understand that a single breach can outweigh annual fees.
Key Report Takeaways
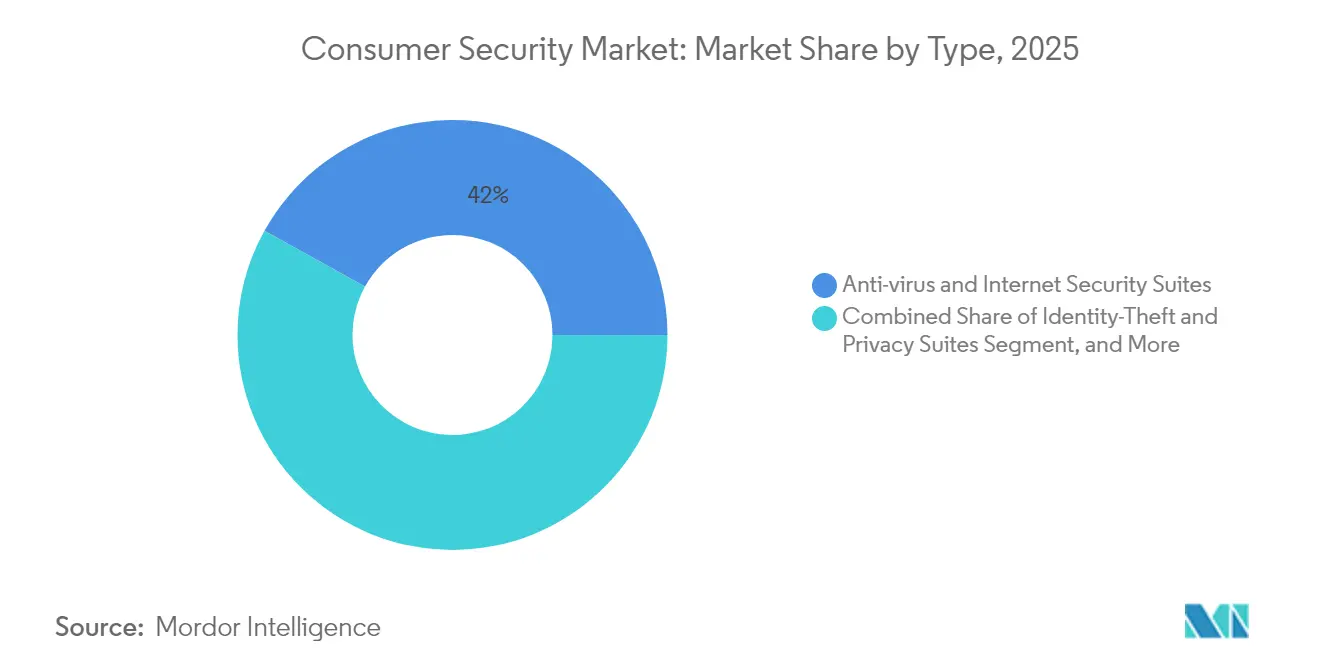
- By product type, anti-virus and internet security suites led with 41.95% of consumer security market share in 2025, while Endpoint Detection and Response for home users is forecast to post an 18.25% CAGR through 2031.
- By component, software accounted for 81.78% of the consumer security market size in 2025; managed services is the fastest-growing component at a 16.55% CAGR to 2031.
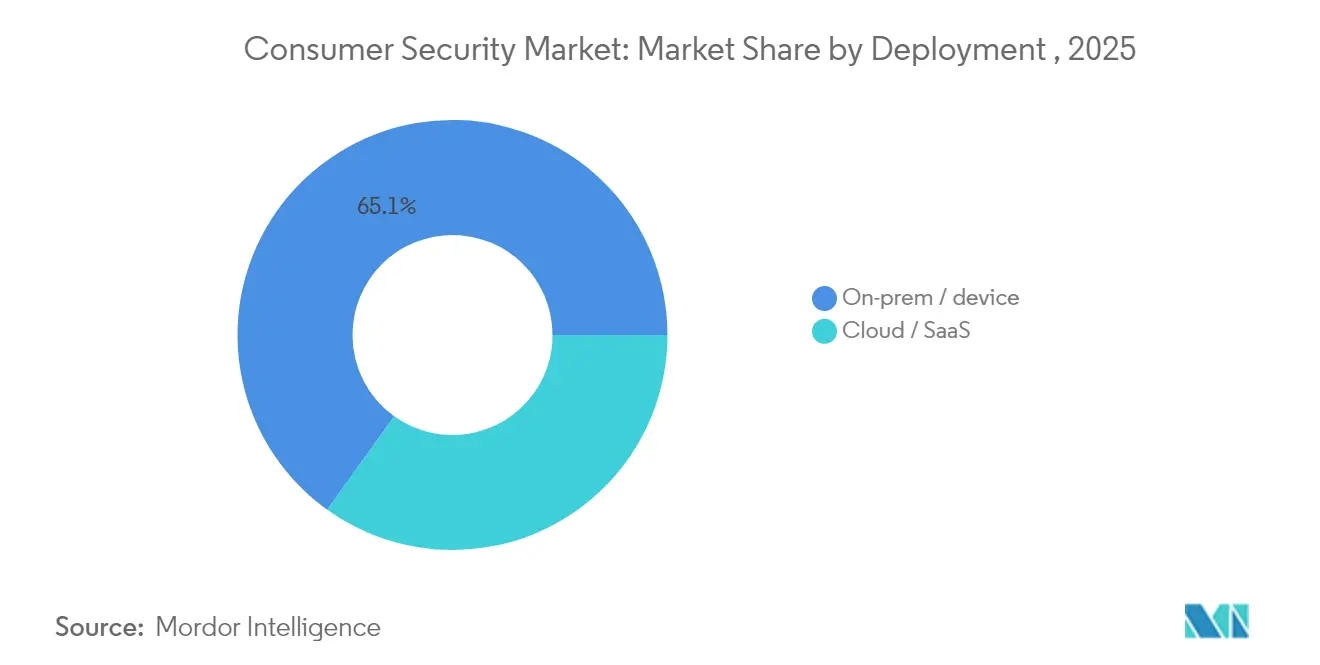
- By deployment, on-premise and device-resident solutions held 65.10% of the consumer security market size in 2025, whereas cloud models are expanding at a 14.62% CAGR.
- By end-user vertical, banking, financial services and insurance captured 21.35% revenue share in 2025; healthcare is advancing at a 13.21% CAGR through 2031.
- By geography, North America commanded 35.85% revenue share in 2025; Asia-Pacific is projected to register a 15.16% CAGR to 2031.
Note: Market size and forecast figures in this report are generated using Mordor Intelligence’s proprietary estimation framework, updated with the latest available data and insights as of 2026.
Global Consumer Security Market Trends and Insights
Drivers Impact Analysis*
| Driver | (~) % Impact on CAGR Forecast | Geographic Relevance | Impact Timeline |
|---|---|---|---|
| Surging phishing and ransomware losses | +2.1% | Global with highest impact in North America and Europe | Short term (≤ 2 years) |
| Household IoT explosion | +1.8% | Asia-Pacific core, spill-over to North America and Europe | Medium term (2–4 years) |
| Privacy-first regulations drive adoption | +1.4% | North America and EU, expanding to Asia-Pacific | Medium term (2–4 years) |
| Subscription identity-protection bundles | +1.2% | Global, led by North America | Short term (≤ 2 years) |
| Source: Mordor Intelligence | |||
Surging Phishing and Ransomware Losses
Consumer losses reported to the FBI climbed to USD 16.6 billion in 2024, a 33% rise year over year, and phishing accounted for 193,407 complaints, the single largest crime category. Healthcare facilities faced 444 ransomware incidents, underscoring how consumer devices can act as stepping-stones into critical systems.[2]American Hospital Association, “Report: Health care had most reported cyberthreats in 2024,” aha.org Average loss per victim reached USD 19,372, and seniors lost USD 4.8 billion, prompting vendors to simplify interfaces and add elder-friendly coaching. Business email compromise inflicted USD 2.7 billion in damages, so suites now extend defenses beyond file scanning to include secure mail gateways and fraud alerts. As victims see direct financial fallout, willingness to pay for multi-layer packages climbs, driving upgrades from free tools to premium bundles.
Household IoT Explosion
Smart home ownership expands the attack surface because everyday devices often leave factories with weak credentials. A U.S. Commerce Department study found that 66% of surveyed devices used semiconductors supplied by Chinese foundries, heightening supply-chain scrutiny. The United Kingdom banned default passwords on connected products in April 2024 and mandated minimum support periods, setting a precedent that other regions may follow. Academic work reveals that consumer IoT gear commonly lacks rigorous intrusion detection, creating an opening for platforms that protect the entire home network rather than isolated gadgets. Vendors now couple endpoint apps with router-level scanners, and China’s state push for AI-based domestic robots further aligns smart-device growth with demand for household security.
Privacy-First Regulations Drive Adoption
California’s regulator advanced updated CCPA rules in 2024, widening data-broker obligations and increasing potential penalties. India’s Digital Personal Data Protection Act will be enforced alongside new rules in 2025, putting explicit duties on data handlers. China published the “Data Twenty Articles” that streamline cross-border transfers yet raise technical safeguards, pushing demand for proven encryption and consent management. In the United States, the FCC reclassified broadband service under Title II, giving the agency clearer authority to impose cybersecurity obligations on providers. As compliance shifts from optional to mandatory, consumers increasingly adopt tools that document privacy controls and data residency.
Subscription Identity-Protection Bundles
Freemium upgrades prove effective when identity monitoring, VPN, and password management are bundled into one license. Gen Digital now serves 500 million users and reports 65 million paid accounts across its Norton and Avast brands, highlighting conversion leverage. Telecommunications operators embed security in broadband tariffs because home connectivity is an ideal distribution channel; telcos' spend on consumer security software is forecast to climb from USD 412 million in 2024 to USD 606 million by 2030, a 6.6% CAGR. The global toll of online scams surpassed USD 1 trillion in 2023, motivating buyers to favor continually updated services over one-time software keys. Recurring models also align incentives: vendors maintain vigilance, clients remain protected, and lifetime revenue increases.
Restraints Impact Analysis*
| Restraint | (~) % Impact on CAGR Forecast | Geographic Relevance | Impact Timeline |
|---|---|---|---|
| Free built-in OS security | -1.6% | Global, with biggest impact in price-sensitive markets | Short term (≤ 2 years) |
| Price-sensitive emerging markets and piracy | -1.1% | Asia-Pacific emerging, Latin America, Middle East, and Africa | Medium term (2–4 years) |
| Source: Mordor Intelligence | |||
Free Built-in OS Security
Windows Defender and similar native tools deliver an acceptable baseline safety for malware and phishing, especially on modern operating systems. Their zero-price tag reduces the perceived need for extra subscriptions among budget-conscious households. Yet record consumer losses of USD 16.6 billion in 2024 show that baseline protection fails to stop sophisticated social-engineering or targeted ransomware.[1]Federal Bureau of Investigation, “2024 IC3 Annual Report,” ic3.gov Vendors, therefore, highlight advanced heuristics, banking shields, dark-web monitoring, and VPN traffic obfuscation that integrated utilities do not cover. Marketing now stresses holistic safeguards against identity fraud and real-time financial alerts rather than simple virus scanning.
Consumer Alert Fatigue Lowers Retention
Excessive warnings clogging screens reduce compliance as users start to ignore pop-ups. Industry research finds that too many generic prompts erode trust, leading to subscription churn. To counteract this, Kaspersky has secured 53 machine-learning patents since 2019, focusing on precise detection to cut false positives. AI-driven assistants now triage events, surface only urgent issues and propose clear next steps, though mainstream adoption is still early.
*Our forecasts treat driver/restraint impacts as directional, not additive. The impact forecasts reflect baseline growth, mix effects, and variable interactions.
Segment Analysis
By Type: EDR-Home Drives Premium Segment Growth
Endpoint Detection and Response for home devices is projected to grow at 18.25% CAGR through 2031, even as anti-virus suites commanded 41.95% revenue in 2025. This shift reflects the reality that signature-based engines cannot keep pace with file-less malware and living-off-the-land tactics. Within the consumer security market size for endpoint tools, ransomware shields rise on healthcare headlines, while identity-theft monitors gain visibility each time breach settlements hit the news. VPN modules show steady uptake because work-from-anywhere lifestyles increase privacy consciousness. Password managers follow new rules that ban weak credentials across consumer apps, although penetration stays higher among security-savvy professionals.
Convergence is underway as vendors bundle these categories into one portal to cut interface fatigue. As a result, the consumer security market registers stronger retention when families can cover laptops, mobiles, and IoT hubs under a unified dashboard. Vendors also pitch parental controls and safe browsing to digital-native parents, and backup utilities remain relevant for ransomware recovery despite competition from mainstream cloud drives.


By Component: Services Accelerate Despite Software Dominance
Software made up 81.78% of the consumer security market size in 2025 because endpoint agents and mobile apps remain the first purchase step. However, services are on track for a 16.55% CAGR as non-technical users lean on managed detection, setup, and 24/7 response. Telco alliances simplify activation and billing, expanding reach into households that would not buy standalone packages.
Hybrid offerings blur the line: AI algorithms run in the cloud, yet human analysts validate suspicious activity, producing a compelling value proposition for higher-risk households. FBI data showing USD 2.7 billion lost to business email compromise underlines the need for expert guidance when alerts escalate beyond device-level threats. Over time, service attachments boost average revenue per user and build switching costs that pure-software vendors struggle to match.
By Deployment: Cloud Adoption Accelerates Infrastructure Shift
On-device deployments held a 65.10% share in 2025 because many buyers still want offline protection. Yet cloud models are growing at 14.62% CAGR thanks to real-time reputation feeds and simplified cross-platform administration. China’s cybersecurity blueprint calls for centralized monitoring and data-classification controls, encouraging vendors to keep threat analytics in the cloud.
Privacy rules that demand data residency sometimes favor local processing, but edge-plus-cloud hybrids now cache sensitive content on the endpoint while still drawing AI insights from a central engine. Patent filings covering real-time vulnerability monitoring illustrate the technical pivot to always-connected telemetry. In the United States, stronger FCC oversight nudges ISPs toward cloud dashboards that reflect security posture in customer portals.
By End-User Vertical: Healthcare Leads Adoption Amid Rising Threats
Financial services represented 21.35% of revenue in 2025 as encrypted transactions and regulatory audits required high standards. Yet, healthcare is on pace for a 13.21% CAGR through 2031 because hospital supply chains rely on consumer-grade tablets, and staff may handle records on personal devices. The American Hospital Association logged 444 cyberthreat incidents in 2024, pushing patients and clinicians alike to install dedicated defenses.
The International Monetary Fund warns that cyber losses in banking could hit USD 2.5 billion in extreme cases, so sector employees now treat home networks as extensions of office perimeters. Government, telecom, and education also adopt consumer tools because hybrid work blurs device ownership. The FCC’s USD 200 million E-Rate pilot expands school budgets for endpoint safeguards. Retail and logistics demand mobile protection as staff scan inventory and process payments in the field.
Geography Analysis
North America retained 35.85% revenue in 2025 and continues to buy premium suites thanks to mature awareness and a strong regulatory push. The latest FBI Internet Crime Report listed USD 16.6 billion in consumer losses, giving sellers a potent proof point during renewals. The FCC’s decision to classify broadband as a telecommunications service increases oversight and forces providers to package safety tools with connectivity plans, further enlarging the local opportunity. Canada’s National Cyber Security Strategy and sustained enterprise spending of CAD 14 billion (USD 10.3 billion) demonstrate regional commitment. Yet headline breaches such as the AT&T exposure of 51 million customer records in 2024 keep consumers on edge.
Asia-Pacific posts the highest 15.16% CAGR through 2031 as digital transformation accelerates. China’s cybersecurity market is projected to rise from 712 billion yuan in 2022 to 1,078 billion yuan by 2025, translating to almost USD 149 billion and underscoring scale. India’s UPI scheme processed 33% more transactions in May 2025 than a year earlier, yet fraud losses hit EUR 177 crore (USD 21 million), alerting citizens to online risks. Japan promotes AI in consumer services, creating advanced requirements for behavioral analytics that vendors rush to meet. A diverse patchwork of laws forces suppliers to localize features such as incident-response hotlines and data-storage zones.
Europe records steady expansion anchored in GDPR enforcement, which obliges transparent data handling and breach reporting. The United Kingdom’s prohibition of default passwords on smart devices broadens the compliance burden and encourages consumers to upgrade security across the home. Telefonica Tech showcases European operator appetite for bundled security by rolling out SASE services that include endpoint protection for small firms and their staff. The Middle East and Africa show nascent demand: rising internet penetration fuels threat exposure, but price sensitivity slows uptake of high-end suites. Government digital-economy plans and public-private partnerships are expected to fund awareness campaigns that will raise baseline demand over time.

Competitive Landscape
The field shows moderate concentration because a handful of global brands hold large subscriber pools, yet no single vendor exceeds half of the total revenue. Gen Digital’s Norton, Avast, and LifeLock units report 500 million users and added USD 38 million net revenue in Q3 2025, leveraging freemium funnels and brand familiarity. Competitors differentiate by layering advanced AI analytics, identity defense, and password vaults into one console to raise switching costs.
Kaspersky broadened its BUILD program in 2025, lowering entry barriers for small developers so the ecosystem can plug white-space capabilities into its platform. Patent activity is brisk: Kaspersky holds dozens of machine-learning inventions, while Darktrace patents autonomous response algorithms that could migrate from enterprise to consumer edge devices.
Telcos emerge as pivotal channels, with spending on consumer security software projected to hit USD 606 million by 2030. Vendors willing to white-label their engines inside broadband routers can tap multi-million household footprints with a single deal. Start-ups focus on scam voice detection, real-time QR code inspection, and gaming-specific protection, forcing incumbents to acquire or copy niche functions. Free OS defenses continue to improve, but complexity of threats ensures room for packaged suites that integrate zero-day detection, VPN and digital-wallet guardrails.
Consumer Security Industry Leaders
Gen Digital (Norton, Avast)
McAfee
Trend Micro
Kaspersky Lab
Bitdefender
- *Disclaimer: Major Players sorted in no particular order

Recent Industry Developments
- June 2025: China’s Cyberspace Administration launched the “Clear and Bright” campaign targeting opaque algorithms, creating new compliance checkpoints for AI-enabled security apps.
- May 2025: Gen Digital disclosed a USD 38 million net revenue boost in Q3 2025 thanks to higher take-up of identity-protection bundles.
- April 2025: The FCC reclassified broadband under Title II, expanding its authority to order cybersecurity safeguards within consumer connections.
- February 2025: Bitdefender’s HardenStance study forecast telco spending on consumer protection to reach USD 606 million by 2030.


Research Methodology Framework and Report Scope
Market Definitions and Key Coverage
Our study defines the consumer security market as the aggregate spending by private individuals on software, hardware, and cloud-delivered services that protect personal endpoints, home networks, consumer IoT devices, and related digital identities. Protection spans threat prevention, detection, response, and privacy tooling installed on PCs, mobiles, smart home hubs, cameras, and routers.
Scope exclusion: purely enterprise-licensed cyber platforms and physical guarding services are not counted.
Segmentation Overview
- By Type
- Anti-virus and Internet Security Suites
- Identity-Theft and Privacy Suites
- Virtual Private Network (VPN)
- Password Managers
- Endpoint Detection and Response (EDR-Home)
- Parental Control and Safe-Browsing
- Backup and Recovery
- Ransomware Shield
- By Component
- Software
- Services (Setup, Support, MDR-Home)
- By Deployment
- On-premise / Device-resident
- Cloud / SaaS
- By End-user Vertical
- Government and Defense
- BFSI
- IT and Telecom
- Healthcare
- Transportation and Logistics
- Retail and E-commerce
- Energy and Utilities
- Manufacturing
- Education
- By Geography
- North America
- United States
- Canada
- South America
- Brazil
- Rest of South America
- Europe
- Germany
- United Kingdom
- France
- Italy
- Spain
- Russia
- Rest of Europe
- Asia-Pacific
- China
- Japan
- India
- South Korea
- Australia and New Zealand
- ASEAN
- Rest of Asia-Pacific
- Middle East and Africa
- GCC
- Turkey
- South Africa
- Rest of Middle East and Africa
- North America
Detailed Research Methodology and Data Validation
Primary Research
Mordor analysts interviewed security-suite product managers, ISP bundling leads, and regional CERT advisors across North America, Europe, and Asia Pacific. These conversations validated average selling prices, attach rates for telco bundles, and the pace at which households add security for new IoT endpoints.
Desk Research
We began with public datasets, FBI IC3 loss statistics, ENISA threat reports, and ITU household broadband penetration, since they anchor user exposure. Global customs codes for Wi-Fi cameras, BIS shipment data for PCs, and patent filings on consumer threat analytics guided device stock estimates. Company filings, investor decks, and reputable press added pricing and adoption clues. Subscription metrics from App Store rankings and Gen Digital's annual report were sourced through D&B Hoovers and Dow Jones Factiva. The sources named here illustrate the wider desk research pool consulted; many additional databases and open releases informed our view.
Market-Sizing & Forecasting
A blended top-down and bottom-up model was built. We first sized the addressable pool by tracking connected households, average devices per home, and reported malware infection incidence, which were then valued using region-specific penetration and ARPU curves. Supplier roll-ups of user counts and sampled ASP times active-seat checks acted as a bottom-up counterweight before reconciliation. Key variables include annual consumer cyber-crime losses, smartphone installed base, smart camera shipments, privacy regulation milestones, and average security-suite renewal rates. Multivariate regression, supplemented with scenario analysis for device growth, projects figures to 2030 and flags variance when any driver deviates beyond one standard deviation.
Data Validation & Update Cycle
Outputs pass three layers: automated outlier scans, peer review by a second analyst, and a lead analyst sign-off. Models refresh yearly, with interim updates triggered by material events such as a major OS security release or a regulatory change. Clients therefore receive the most current baseline.
Why Mordor's Consumer Security Baseline Commands Reliability
Published estimates vary because firms differ on what they count and how often they refresh results.
Device scope, pricing ladders, and forecast techniques create visible gaps that puzzle buyers.
Benchmark comparison
| Market Size | Anonymized source | Primary gap driver |
|---|---|---|
| USD 43.65 B | Mordor Intelligence | - |
| USD 40.46 B | Global Consultancy A | counts smart-home devices only, omits mobile security revenue |
| USD 45.15 B | Industry Journal B | uses vendor list pricing, limited primary validation, annual refresh lag |
In summary, Mordor's disciplined variable selection and annual field checks deliver a balanced, transparent figure that decision-makers can trace back to clear inputs and repeatable steps. This makes our baseline the dependable choice.


Key Questions Answered in the Report
What is the current value of the consumer security market and how fast is it growing?
The market stands at USD 47.75 billion in 2026 and is projected to reach USD 75.25 billion by 2031, implying a 9.52% CAGR.
Which product category holds the largest consumer security market share today?
Anti-virus and internet security suites command 41.95% revenue share in 2025, giving them the lead among product types.
Why is Asia-Pacific the fastest-growing region for consumer security solutions?
Rapid digitization, rising mobile payments and expanding regulatory frameworks push Asia-Pacific to a 15.16% CAGR through 2031.
How are telecom operators influencing consumer security adoption?
Telcos increasingly bundle protection in broadband plans, and their spending on security software is forecast to rise from USD 412 million in 2024 to USD 606 million by 2031.
What role do privacy regulations play in market growth?
New laws in California, India, China and other jurisdictions make data protection mandatory, prompting consumers to adopt tools that prove compliance and safeguard personal information.
Are built-in operating-system defenses enough for modern threats?
While free tools cover basic malware, advanced phishing, ransomware and identity fraud still require the multi-layer capabilities offered by premium consumer security suites.
Page last updated on:


