Risk Analytics Market Size and Share
Market Overview
| Study Period | 2020 - 2031 |
|---|---|
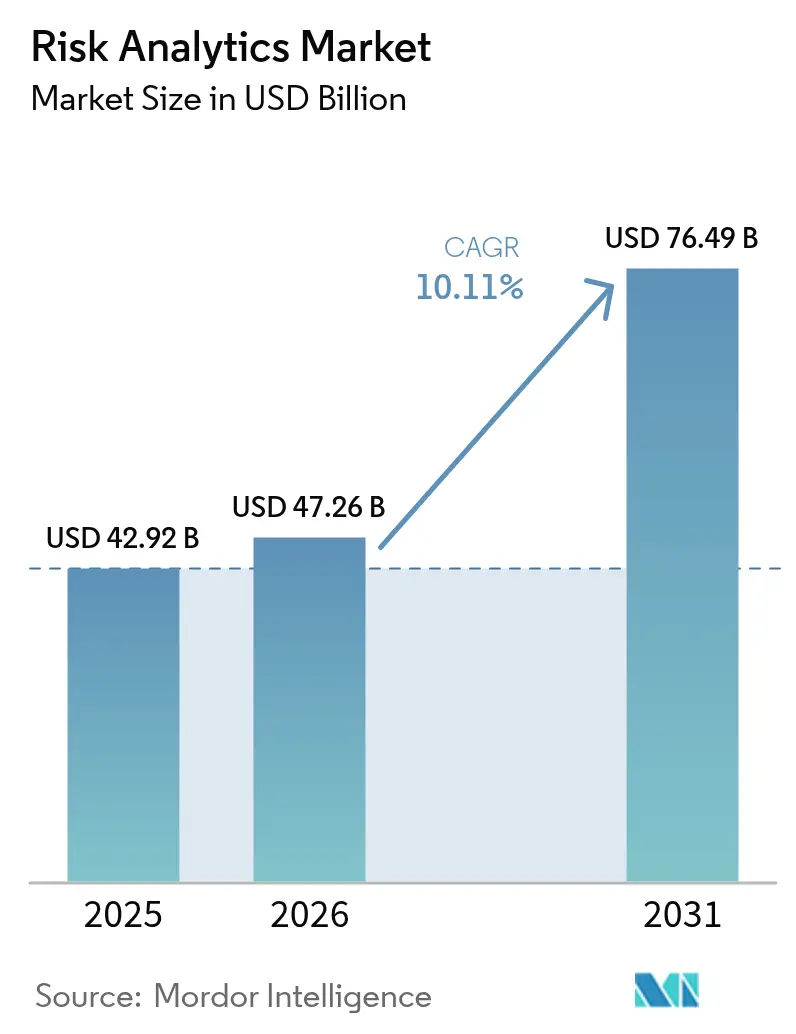
| Market Size (2026) | USD 47.26 Billion |
| Market Size (2031) | USD 76.49 Billion |
| Growth Rate (2026 - 2031) | 10.11% CAGR |
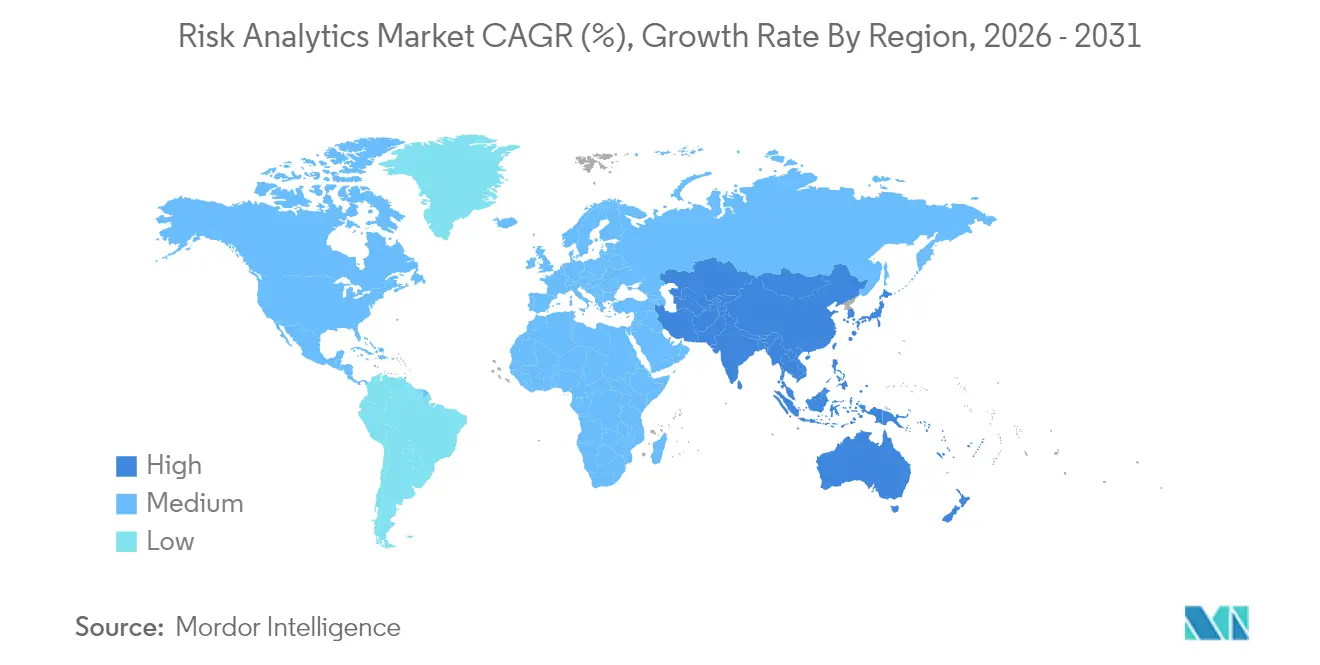
| Fastest Growing Market | Asia Pacific |
| Largest Market | North America |
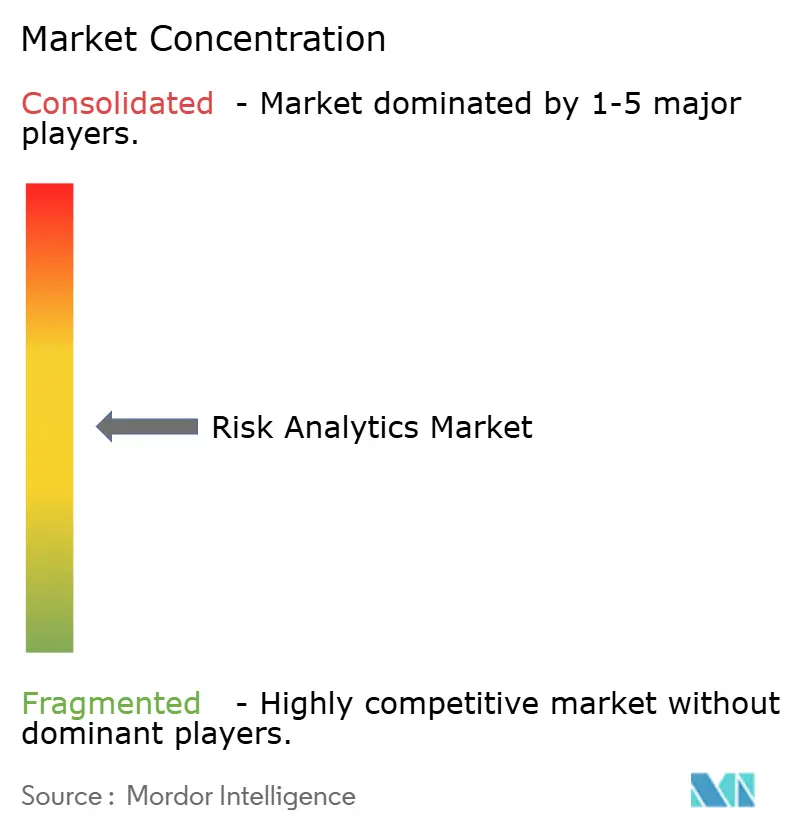
| Market Concentration | Medium |
Major Players *Disclaimer: Major Players sorted in no particular order Image © Mordor Intelligence. Reuse requires attribution under CC BY 4.0. | |
Risk Analytics Market Analysis by Mordor Intelligence
The risk analytics market size is expected to grow from USD 42.92 billion in 2025 to USD 47.26 billion in 2026 and is forecast to reach USD 76.49 billion by 2031 at 10.11% CAGR over 2026-2031. Heightened regulatory scrutiny, real-time fraud exposure on instant-payment rails, and mandatory climate-risk disclosure are making advanced analytics a strategic necessity rather than a discretionary IT spend. Financial institutions are phasing out rule-based tools in favor of AI-driven platforms that evaluate millions of data points within milliseconds to support capital optimization, fraud interdiction, and climate scenario modeling. Cloud-native architectures, quantum-resistant algorithms, and unified data fabrics are cutting total cost of ownership while enabling parallel compliance reporting across jurisdictions[1]Google Cloud, “Accelerating Risk Analytics with Secure Data Fabric,” cloud.google.com. The convergence of these forces is reshaping vendor strategies toward platform-as-a-service delivery that merges software, consulting, and managed operations.
Key Report Takeaways
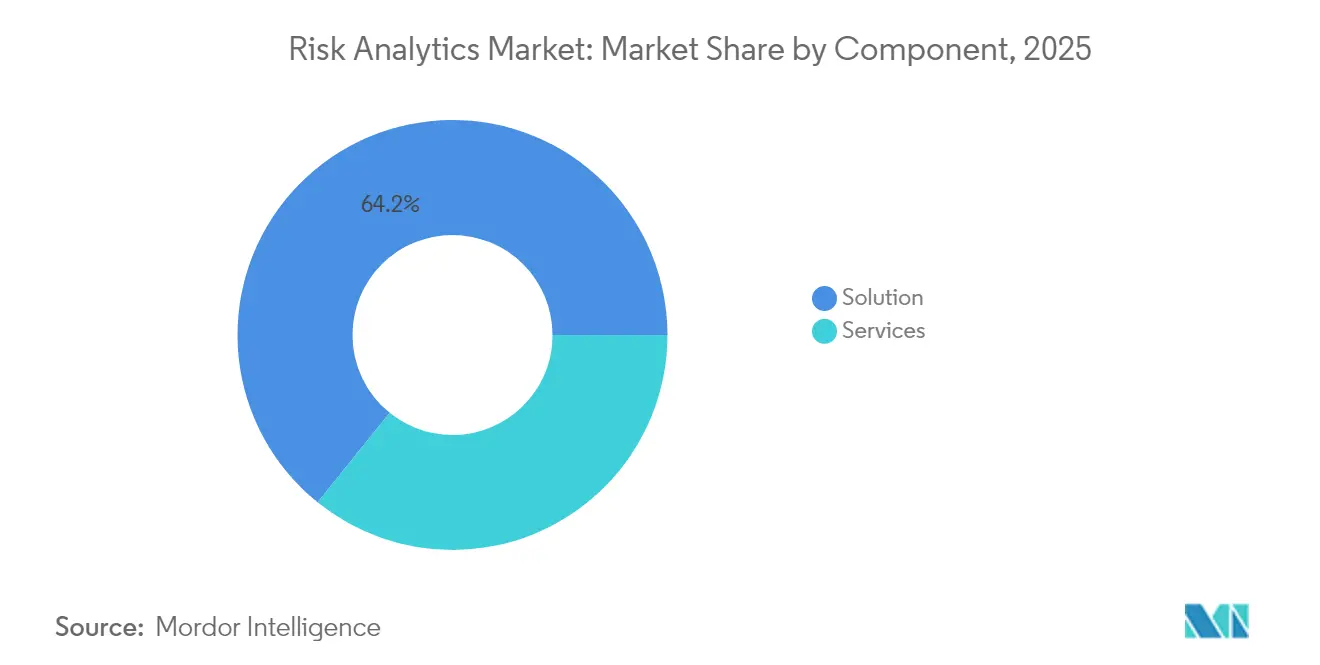
- By component, Solutions led with 64.20% of the risk analytics market share in 2025, while Services are expanding at an 11.62% CAGR to 2031.
- By deployment, On-premises accounted for 66.95% of the risk analytics market size in 2025; Cloud is forecast to grow at 11.92% CAGR through 2031.
- By risk type, Credit risk held 39.85% share of the risk analytics market size in 2025; Climate and ESG risk analytics will expand at an 11.12% CAGR.
- By application, Fraud detection and AML captured 41.05% of the risk analytics market share in 2025; Cyber-risk analytics registers the fastest 10.74% CAGR.
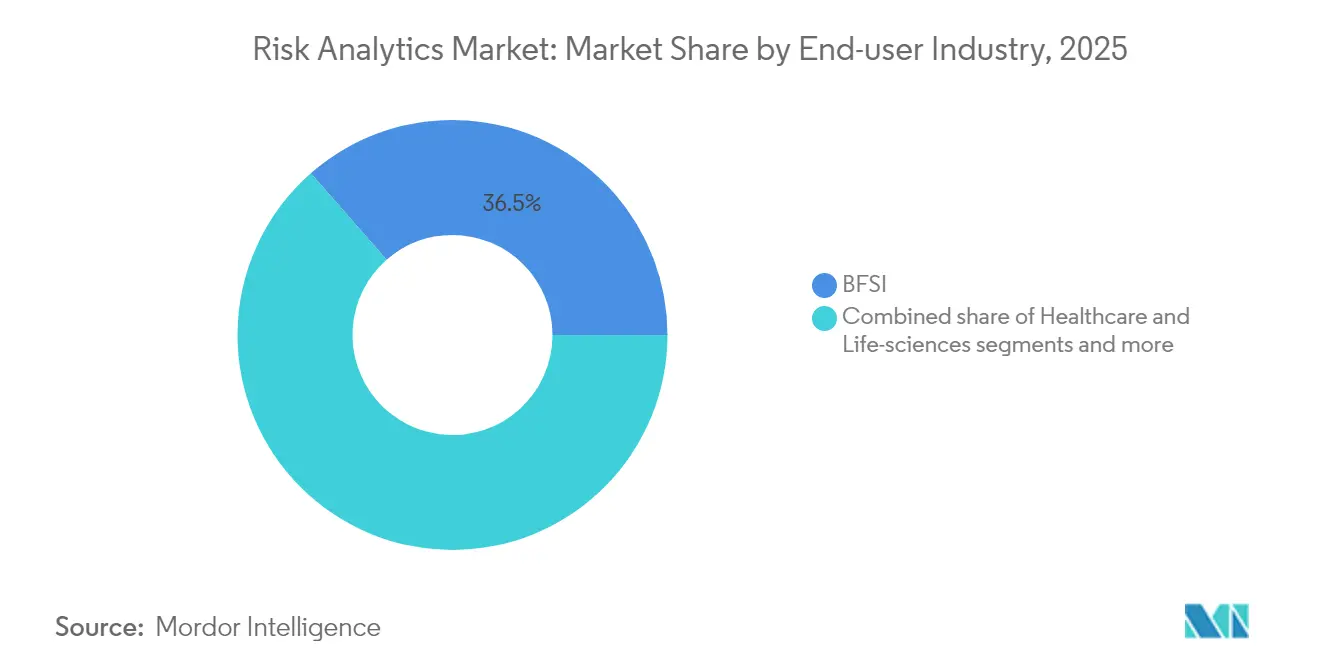
- By end-user industry, BFSI commanded 36.45% of revenue in 2025; Retail and e-commerce will grow at 10.55% CAGR on soaring digital transactions.
- By organisation size, large enterprises represented 68.75% of demand in 2025, but SMEs are advancing at 12.05% CAGR through 2031 on cloud democratization.
- By geography, North America led with 38.15% revenue share in 2025; Asia-Pacific is projected to expand at an 11.23% CAGR through 2031.
Note: Market size and forecast figures in this report are generated using Mordor Intelligence’s proprietary estimation framework, updated with the latest available data and insights as of 2026.
Global Risk Analytics Market Trends and Insights
Drivers Impact Analysis*
| Driver | (~) % Impact on CAGR Forecast | Geographic Relevance | Impact Timeline |
|---|---|---|---|
| Real-time fraud surge in instant-payment rails | +2.1% | Global, led by North America and APAC | Short term (≤ 2 years) |
| Heightened post-Basel IV capital-adequacy scrutiny | +1.8% | Global, EU and UK lead | Medium term (2-4 years) |
| Mandatory climate-risk disclosure | +1.5% | Global, EU leads | Long term (≥ 4 years) |
| AI-powered credit scoring for thin-file borrowers | +1.3% | Global, emerging markets focus | Medium term (2-4 years) |
| Multi-cloud risk-data fabrics cut TCO > 25% | +1.1% | North America and EU core, spreading to APAC | Short term (≤ 2 years) |
| Quantum-computing threat to legacy crypto-algos | +0.9% | Global, advanced economies first | Long term (≥ 4 years) |
| Source: Mordor Intelligence | |||
Real-time fraud surge in instant-payment rails
Instant settlement environments expose banks to transaction-level attacks that overwhelm batch fraud tools. Global real-time payment volumes are on track to hit 575 billion transactions by 2028, forcing institutions to deploy millisecond analytics that blend behavioral biometrics, device intelligence, and network analytics while maintaining false-positive rates below 1%[2]European Payments Council, “2024 Payment Threats and Fraud Trends Report,” europeanpaymentscouncil.eu. The United Kingdom’s mandatory reimbursement rule for authorized push-payment fraud strengthens the economic case for AI-native platforms that score transactions as they occur. Vendors that can combine streaming data ingestion, graph analytics, and model governance within a single cloud-native stack hold a decisive edge.
Heightened post-Basel IV capital-adequacy scrutiny
The EU’s January 2025 Basel IV rollout and FINMA’s enhanced operational-risk ordinances oblige multinational banks to run several risk-weighted asset calculations in parallel. Cloud-based Monte-Carlo engines allow near real-time capital optimization across diverging rulesets while satisfying BCBS 239 data-aggregation tests. As regulators intensify on-site data audits, demand for unified data lineage, audit trails, and scenario libraries accelerates the migration toward service-rich platforms that embed regulatory logic natively.
Mandatory climate-risk disclosure
Federal Reserve guidance now links climate exposure to safety-and-soundness expectations for large banks. The EU Corporate Sustainability Reporting Directive mandates auditable metrics across scopes and asset classes, redirecting budgets toward geospatial analytics that merge satellite imagery with long-run climate models. Institutions are re-engineering credit and market-risk engines to capture transition-risk factors such as carbon pricing. Vendor offerings that integrate physical and transition risk within existing portfolio-risk views are gaining rapid acceptance.
AI-powered credit scoring for thin-file borrowers
Large language models and multimodal AI engines ingest payment history, telco data, and social signals to identify creditworthy applicants lacking formal bureau files. The Monetary Authority of Singapore’s Veritas consortium sets fairness and transparency benchmarks that shape product designs. Banks in India, Nigeria, and Brazil leverage these models to unlock new lending pools without breaching discrimination rules. Demand concentrates on platforms that embed explainability layers, synthetic data augmentation, and bias-testing modules inside scoring workflows.
Restraints Impact Analysis*
| Restraint | (~) % Impact on CAGR Forecast | Geographic Relevance | Impact Timeline |
|---|---|---|---|
| Acute talent shortage in model-risk governance | -1.7% | Global, severe in North America and EU | Medium term (2-4 years) |
| Rising SaaS subscription fatigue among mid-tiers | -1.2% | Global, mid-tier institutions | Short term (≤ 2 years) |
| Vendor-lock-in concerns over proprietary ML stacks | -0.9% | Global, highest in North America and EU | Medium term (2-4 years) |
| Inconsistent ESG taxonomies across jurisdictions | -0.8% | Global, pronounced in EU, US and APAC | Long term (≥ 4 years) |
| Source: Mordor Intelligence | |||
Acute talent shortage in model-risk governance
Fifty-four percent of banks report gaps in quantitative validation skills, delaying model releases and inflating compliance costs. Salary inflation is steepest for specialists who combine statistics, regulatory insight, and AI competence. Institutions are adopting automated validation toolkits that replay production data and issue governance alerts, but supervisors still require human sign-off. Vendors that bundle workflow, documentation, and auto-testing capabilities mitigate the constraint yet cannot fully replace scarce expertise.
Rising SaaS subscription fatigue among mid-tiers
Mid-tier banks juggle dozens of niche tools, creating integration overhead and licensing creep. Many are rationalizing stacks in favor of unified risk analytics market platforms that provide modular capabilities under usage-based pricing. Hybrid-cloud architectures and container orchestration lower exit barriers, alleviating vendor-lock concerns. Providers able to showcase clear payback periods through proof-of-value pilots see quicker renewals despite budget caution.
*Our forecasts treat driver/restraint impacts as directional, not additive. The impact forecasts reflect baseline growth, mix effects, and variable interactions.
Segment Analysis
By Component: Services adoption accelerates as institutions seek specialist expertise
Market share data show Solutions at 64.20% in 2025, yet the Services arm is expanding faster at 11.62% CAGR. The risk analytics market size tied to consulting, implementation, and managed operations grows as banks confront AI governance, climate stress testing, and quantum-risk modeling. Service firms help integrate advanced engines with legacy cores while aligning outputs to jurisdictional templates. In parallel, core software evolves toward low-code configurability, natural language front-ends, and quantum-resistant libraries.
Ongoing regulatory change keeps customers reliant on external specialists for model inventory curation, documentation, and validation. Managed services covering data quality, scenario libraries, and real-time monitoring reduce overhead for mid-tier players. As a result, spending tilts toward recurring service contracts even where perpetual licenses remain in place. Vendors that fuse software upgrades with outcome-based service commitments guard renewals and upsell opportunities.


By Deployment: Cloud uptake rises despite on-premises prevalence
On-premises systems retain 66.95% share in 2025 as institutions guard sensitive data against extraterritorial access. Yet a 11.92% CAGR for cloud indicates decisive migration momentum, raising the risk analytics market value delivered via SaaS and platform-as-a-service models. Cloud deployments support elastic compute bursts for intraday stress testing, real-time fraud scoring, and high-frequency market-risk recalculations. Providers of sovereign-cloud zones ease data-residency objections in Europe, the Middle East, and Asia.
Hybrid architectures dominate transition roadmaps. Legacy credit engines remain on-premises while AI inference layers, visualization dashboards, and batch reporting shift to cloud micro-services. Clients use multi-cloud orchestrators to avoid lock-in and align workloads with latency, cost, and data-localization constraints. Solutions that embed workload-placement logic and cross-cloud cost analytics capture wallet share as institutions refine resource allocation strategies.
By Risk Type: Climate and ESG analytics record fastest advance
Credit risk still anchors 39.85% of 2025 revenue, but climate and ESG models expand at 11.12% CAGR through 2031. The risk analytics market share for climate scenarios grows as disclosure mandates require quantification of floods, wildfires, and transition shocks at obligor level. Integrated platforms overlay physical-risk maps on loan collateral and securities holdings to calculate capital charges consistent with regulator guidelines.
Vendors add transition-risk libraries that model carbon-price pathways and policy shocks, linking them to credit, market, and operational risk exposures. Institutions re-factor stress-testing suites to merge climate outcomes with macroeconomic downturns. Providers that can supply traceable climate data, transparent methodologies, and audit trails win procurement evaluations, especially in Europe where supervisors scrutinize scenario assumptions.
By Application: Cyber-risk analytics surges on digital-first operations
Fraud detection and AML captured 41.05% share in 2025 and continues to evolve toward behavioral and network-based analytics. Cyber-risk analytics however outpaces with a 10.74% CAGR as financial infrastructure digitizes and regulators impose ICT-risk standards. The risk analytics market size for cyber models expands under the Digital Operational Resilience Act that requires threat identification, penetration testing, and service-level orchestration.
Platforms ingest log data, vulnerability scans, and supply-chain intelligence to quantify residual cyber exposure in monetary terms. They connect to security orchestration tools to trigger controls when risk thresholds breach tolerance. Clients prioritize solutions that unify cyber, operational, and third-party risk within enterprise dashboards, enabling boards to compare cyber exposure with credit or liquidity risks on common scales.
By End-user Industry: Retail and e-commerce drive fraud-centric innovation
The BFSI vertical held 36.45% of revenue in 2025 as banks continue to invest in compliance, stress testing, and anti-fraud analytics. Retail and e-commerce, posting a 10.55% CAGR, emerges as a hotbed of real-time fraud and chargeback management. The risk analytics market size for merchants increases as instant payments and buy-now-pay-later plans raise exposure to synthetic identities and refund abuse. Visa research shows over 80% of merchants boosting instant-payment acceptance, escalating fraud management needs.
Online sellers adopt plug-and-play AI fraud engines that flag anomalies at checkout, score customers on risk tiers, and feed results into embedded finance offerings. Telecom and tech providers also increase spend to safeguard digital wallets and embedded lending channels. Vendors supplying verticalized risk content and out-of-the-box connectors shorten time-to-value and penetrate non-financial sectors faster.
By Organisation Size: SMEs close capability gaps via platform democratization
Large enterprises maintain 68.75% share under complex regulatory obligations and sophisticated portfolios. The highest 12.05% CAGR resides in SMEs that leverage subscription models to gain enterprise-grade analytics without heavy CapEx. Cloud service providers and fintech aggregators bundle scoring, fraud, and compliance modules into pay-as-you-grow packages. The risk analytics market democratizes as SME adoption spreads to micro-lenders, regional insurers, and mid-sized retailers.
Ease of integration and outcome-based pricing accelerate SME uptake. Vendors that automate data onboarding, offer pre-trained models, and supply sandbox testing environments reduce implementation cycles from months to weeks. Partner ecosystems distribute these offerings through accounting platforms and vertical SaaS marketplaces, widening reach while containing customer-acquisition costs.
Geography Analysis
North America held 38.15% of revenue in 2025, underpinned by strict supervisory regimes and early hyperscale-cloud adoption. The Federal Reserve’s climate guidance and Basel III endgame rules sustain spending on capital optimization, stress testing, and data lineage solutions. U.S. institutions also pilot quantum-resistant encryption to future-proof payment rails, supported by IBM’s multi-billion dollar quantum roadmap.
Europe commands significant share and shapes regulatory templates worldwide. Implementation of the Digital Operational Resilience Act in 2025 obliges banks to integrate ICT-risk analytics with traditional financial-risk metrics. The bloc’s leadership on ESG rules propels climate-scenario spending, while BCBS 239 compliance pushes real-time data aggregation investments. Fragmented member-state rules raise demand for platforms that map multiple reporting schemas onto consistent data models.
Asia-Pacific is the fastest-growing region at 11.23% CAGR. India’s Unified Payments Interface processes billions of monthly transfers, heightening real-time fraud needs. China deepens supply-chain finance analytics and readies digital currency risk frameworks. Southeast Asian markets accelerate credit-scoring for first-time borrowers using alternative data. Regulators adopt sandbox schemes that speed vendor approvals, fuelling rapid deployment of scalable cloud offerings adapted to local data-localization norms.

Competitive Landscape
The risk analytics market features moderate consolidation. Incumbents such as SAS, IBM, Oracle, and SAP leverage broad suites that align with multi-risk governance and regulatory mapping. Specialists like FICO, Moody’s Analytics, and NICE Actimize cultivate deep domain models for credit, climate, or financial crime. Acquisition momentum is strong as vendors seek differentiated data sources and AI engines. Mastercard’s purchase of Recorded Future adds threat intelligence to its fraud shield services.
Cloud hyperscalers intensify competition by embedding analytics APIs into infrastructure layers. Google, Microsoft, and Amazon market low-latency fraud detection, auto-scaling stress-test grids, and managed model-ops. Partnerships between software vendors and cloud providers ensure regulatory certifications and sovereign-cloud options that reassure supervisors. Start-ups focus on quantum-safe algorithms, geospatial climate metrics, and synthetic-data validation tools, targeting niches where incumbents are slower to innovate.
Real-time processing capability is a decisive differentiator. Vendors demonstrate millisecond decision times on peak loads while preserving explainability and audit trails. Offerings that couple streaming analytics with line-of-business dashboards attract buyers who need actionable insights rather than historical reports. Competitive advantage increasingly depends on ecosystem openness, model-risk governance tooling, and transparent licensing that alleviates subscription fatigue.
Risk Analytics Industry Leaders
IBM Corporation
SAP SE
SAS Institute Inc.
Oracle Corporation
Accenture PLC
- *Disclaimer: Major Players sorted in no particular order

Recent Industry Developments
- April 2025: Verisk acquired Nasdaq Risk Modelling for Catastrophes to enhance extreme-event analytics.
- January 2025: Moody’s bought CAPE Analytics to add geospatial property-risk intelligence to its platform.
- January 2025: FICO received the 2025 BIG Innovation Award for blockchain-enabled AI model governance.
- December 2024: Mastercard closed its USD 2.65 billion acquisition of Recorded Future, integrating threat intelligence into its fraud prevention portfolio.
- March 2024: Archer purchased Flisk, entering the risk management information-system space.


Research Methodology Framework and Report Scope
Market Definitions and Key Coverage
Our study defines the risk analytics market as the aggregate revenue generated by purpose-built software platforms and related services that ingest heterogeneous data, model financial, operational, compliance, cyber, and climate exposures, and deliver actionable risk scores or dashboards across enterprise workflows. Solutions may be deployed on-premise or in the cloud for users ranging from global banks to mid-size retailers.
Scope exclusion: stand-alone actuarial modeling tools and generic business-intelligence suites are not counted.
Segmentation Overview
- By Component
- Solution
- Risk-calculation engines
- Risk reporting and dashboards
- ETL / Data-management hubs
- Services
- Consulting
- Integration and Implementation
- Managed / BPO Services
- Solution
- By Deployment
- On-premises
- Cloud
- By Risk Type
- Credit
- Operational
- Liquidity
- Compliance / RegTech
- Climate and ESG
- By Application
- Fraud Detection and AML
- Stress Testing and Scenario-Analysis
- Model-Risk Management
- Cyber-Risk Analytics
- Supply-chain / Third-party Risk
- By End-user Industry
- BFSI
- Healthcare and Life-sciences
- Retail and E-commerce
- Energy and Utilities
- IT and Telecom
- Others
- By Organisation Size
- Large Enterprises
- Small and Medium Enterprises (SMEs)
- Geography
- North America
- United States
- Canada
- Mexico
- Europe
- Germany
- United Kingdom
- France
- Italy
- Spain
- Russia
- Rest of Europe
- Asia-Pacific
- China
- Japan
- India
- South Korea
- Australia and New Zealand
- Rest of Asia-Pacific
- South America
- Brazil
- Argentina
- Rest of South America
- Middle East and Africa
- Middle East
- Saudi Arabia
- United Arab Emirates
- Turkey
- Rest of Middle East
- Africa
- South Africa
- Nigeria
- Rest of Africa
- Middle East
- North America
Detailed Research Methodology and Data Validation
Primary Research
Mordor analysts conduct structured interviews with chief risk officers, reg-tech integrators, and cloud-security architects across North America, Europe, and fast-growing Asia Pacific. Discussions validate spending triggers, typical annual contract values, and module attach rates, filling gaps that secondary sources leave open.
Desk Research
We review authoritative, non-paywalled sources such as the Basel Committee's regulatory bulletins, the US OCC's Suspicious Activity Report data, ECB supervisory statistics, and APRA stress-test disclosures, which together anchor the risk pool size. Industry bodies like the Risk Management Association and ISO TC 262 provide adoption benchmarks, while company 10-Ks and investor decks clarify vendor pricing shifts. Paid repositories, D&B Hoovers for vendor revenue splits and Dow Jones Factiva for deal flow, supply further granularity. This list is illustrative; many additional publications inform our desk research efforts.
Market-Sizing & Forecasting
A top-down reconstruction begins with regulated financial-services IT spend and industry-reported risk-software penetration rates, thereby sizing the demand pool. Select bottom-up checks, supplier revenue roll-ups and sampled average selling price multiplied by active installations, are then used to fine-tune totals. Key variables in our model include (i) number of Basel IV-impacted institutions, (ii) volume of instant-payment transactions, (iii) annual Suspicious Transaction Reports filed, (iv) cloud-migration ratio in BFSI workloads, and (v) impending CSRD climate-risk disclosure deadlines. Multivariate regression links these drivers to historical spend before forward projections are generated. Data gaps in bottom-up samples are bridged with region-specific median-price proxies agreed during expert calls.
Data Validation & Update Cycle
Outputs face three-layer variance checks, peer review, and anomaly flags. Reports refresh annually, with mid-cycle tweaks when material regulatory or macro shocks occur, and an analyst re-audits figures prior to client delivery.
Why Our Risk Analytics Baseline Commands Reliability
Published estimates often diverge because firms pick different risk categories, deployment modes, and contract metrics to include.
Key gap drivers are scope breadth, some studies fold generic BI platforms into totals, one-off currency conversions, and less frequent refresh schedules that miss the post-Basel IV spend uptick captured by Mordor's 2025 base case.
Benchmark comparison
| Market Size | Anonymized source | Primary gap driver |
|---|---|---|
| USD 42.92 B (2025) | Mordor Intelligence | - |
| USD 32.25 B (2025) | Global Consultancy A | Omits climate-risk analytics and counts services only when bundled with software |
| USD 44.55 B (2024) | Trade Journal B | Uses prior-year FX rates and treats generic predictive-analytics tools as risk platforms |
| USD 28.23 B (2025) | Research Firm C | Excludes cloud subscriptions and SMEs, leading to a narrow demand pool |
Taken together, the comparison shows that Mordor's disciplined scope selection, variable transparency, and yearly refresh cadence deliver a balanced baseline that decision-makers can trace back to clear data points and reproducible steps.


Key Questions Answered in the Report
What is the current risk analytics market size and growth outlook?
The risk analytics market is valued at USD 47.26 billion in 2026 and is forecast to reach USD 76.49 billion by 2031, posting a 10.11% CAGR.
Which segment contributes the largest risk analytics market share?
Solutions retain leadership at 64.20% of 2025 revenue, reflecting continued investment in core engines and dashboards.
Why are services growing faster than software in risk analytics?
Institutions need specialized expertise for AI model governance, climate-risk methodology, and multi-jurisdiction compliance, driving an 11.62% CAGR for services to 2031.
How fast is cloud adoption advancing in risk analytics?
Cloud deployments are expanding at 11.92% CAGR as hybrid architectures deliver elastic compute and lower ownership costs while meeting data-residency rules.
Which geographic region will add the most new revenue?
Asia-Pacific leads growth at 11.23% CAGR to 2031 owing to digital-payment proliferation and evolving regulatory frameworks that favor cloud-native analytics.
What technologies define competitive advantage in the risk analytics industry?
Real-time AI engines, quantum-resistant algorithms, sovereign-cloud availability, and automated model-risk governance tools differentiate leading platforms.
Page last updated on:


