Waste Recycling Services Market Size and Share
Market Overview
| Study Period | 2020 - 2031 |
|---|---|
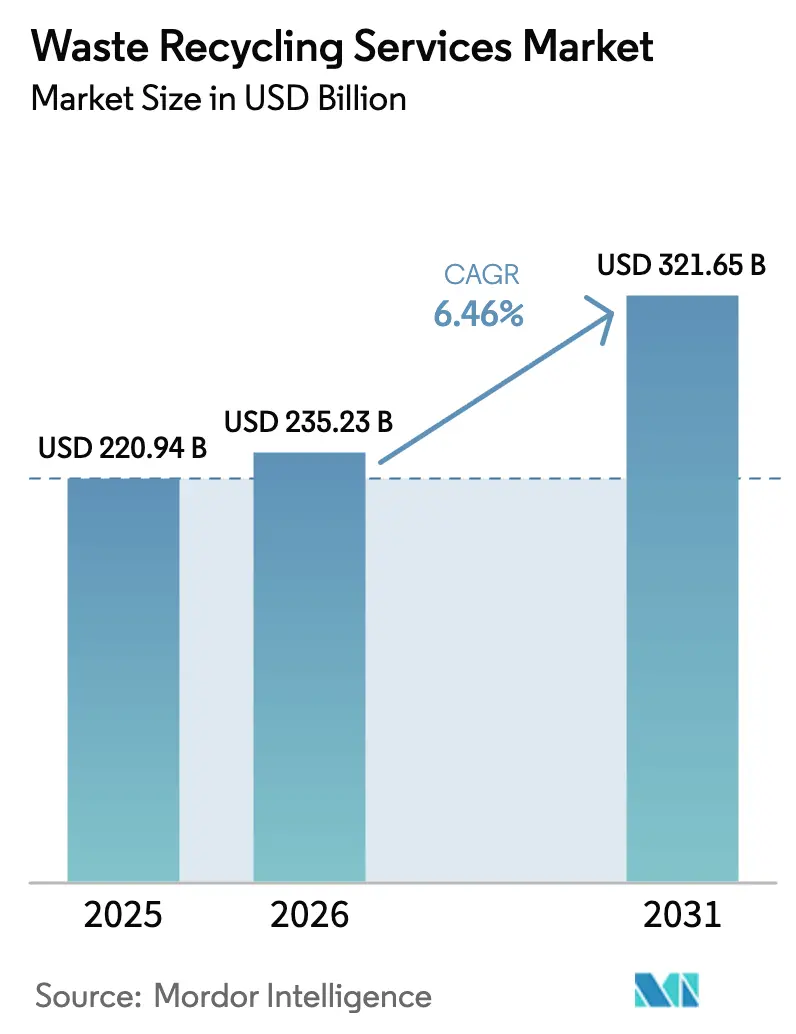
| Market Size (2026) | USD 235.23 Billion |
| Market Size (2031) | USD 321.65 Billion |
| Growth Rate (2026 - 2031) | 6.46% CAGR |
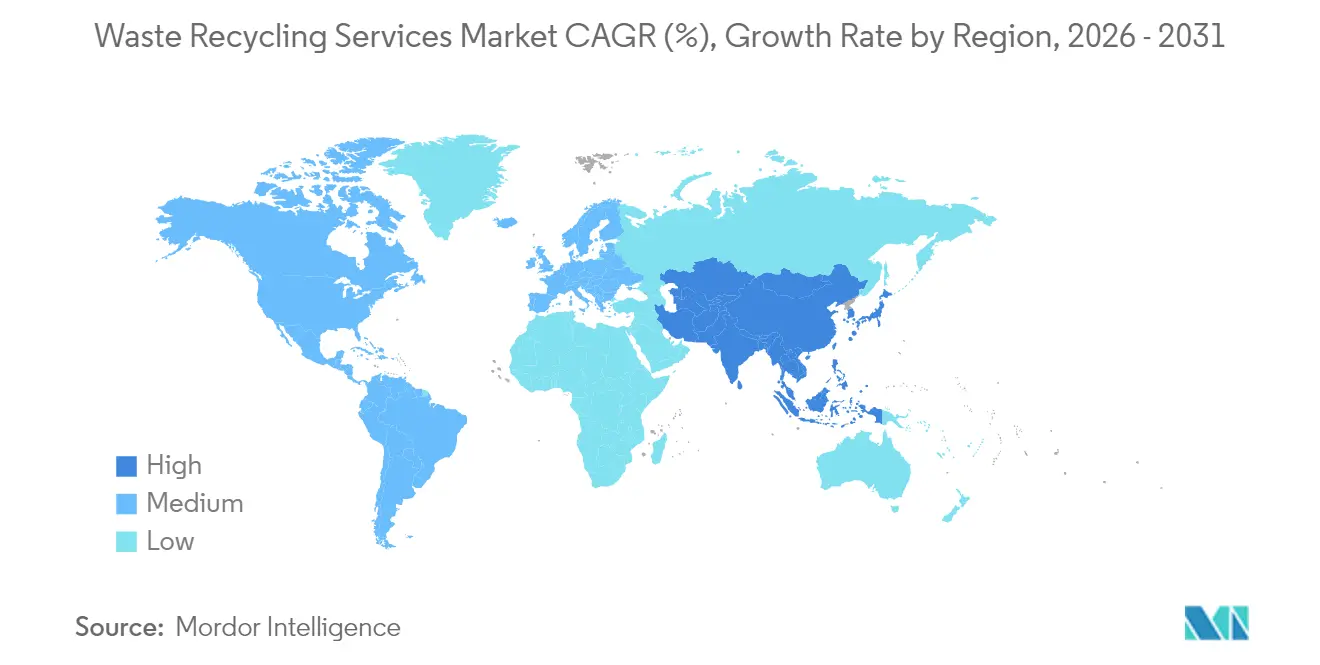
| Fastest Growing Market | Asia Pacific |
| Largest Market | Europe |
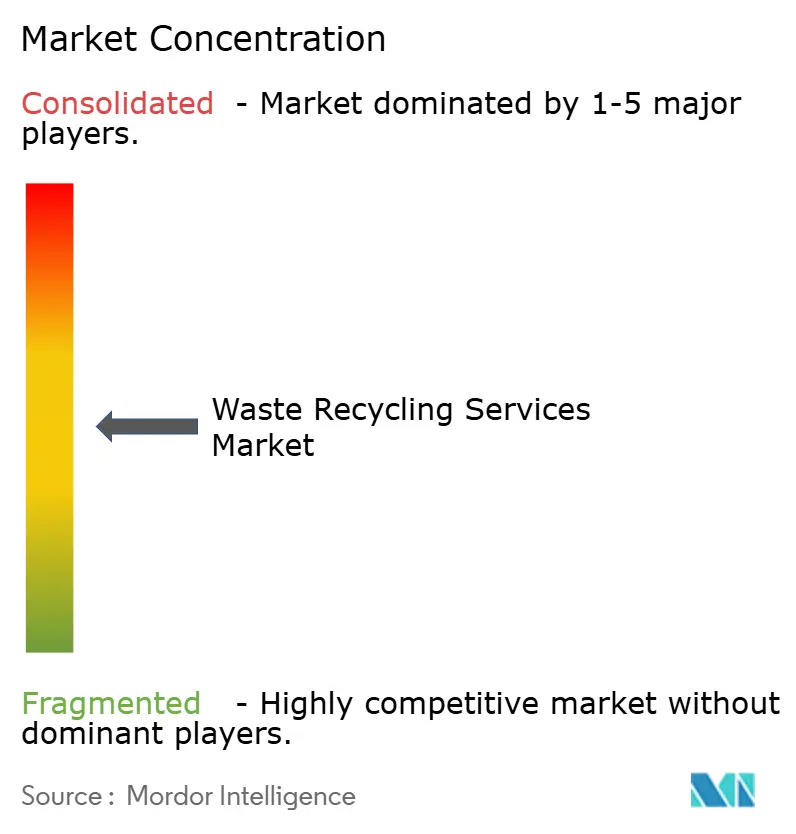
| Market Concentration | Medium |
Major Players *Disclaimer: Major Players sorted in no particular order Image © Mordor Intelligence. Reuse requires attribution under CC BY 4.0. | |
Waste Recycling Services Market Analysis by Mordor Intelligence
The Waste Recycling Services Market size was valued at USD 220.94 billion in 2025 and estimated to grow from USD 235.23 billion in 2026 to reach USD 321.65 billion by 2031, at a CAGR of 6.46% during the forecast period (2026-2031). The expansion reflects stricter Extended Producer Responsibility (EPR) rules, rapid digitalization of sorting lines, and escalating corporate net-zero pledges. Paper & paperboard remains the largest recycled material, yet lithium-ion batteries are opening premium, technology-intensive niches. Contract activity is especially strong in Europe under the new Packaging and Packaging Waste Regulation, while chemical recycling investments in Asia-Pacific are unlocking revenue from complex plastic streams. Corporate demand for closed-loop solutions is tightening the supply of high-quality secondary materials, pushing operators to enhance traceability systems. Meanwhile, volatile secondary commodity prices and battery-related fire-risk premiums continue to pressure processing margins.
Key Report Takeaways
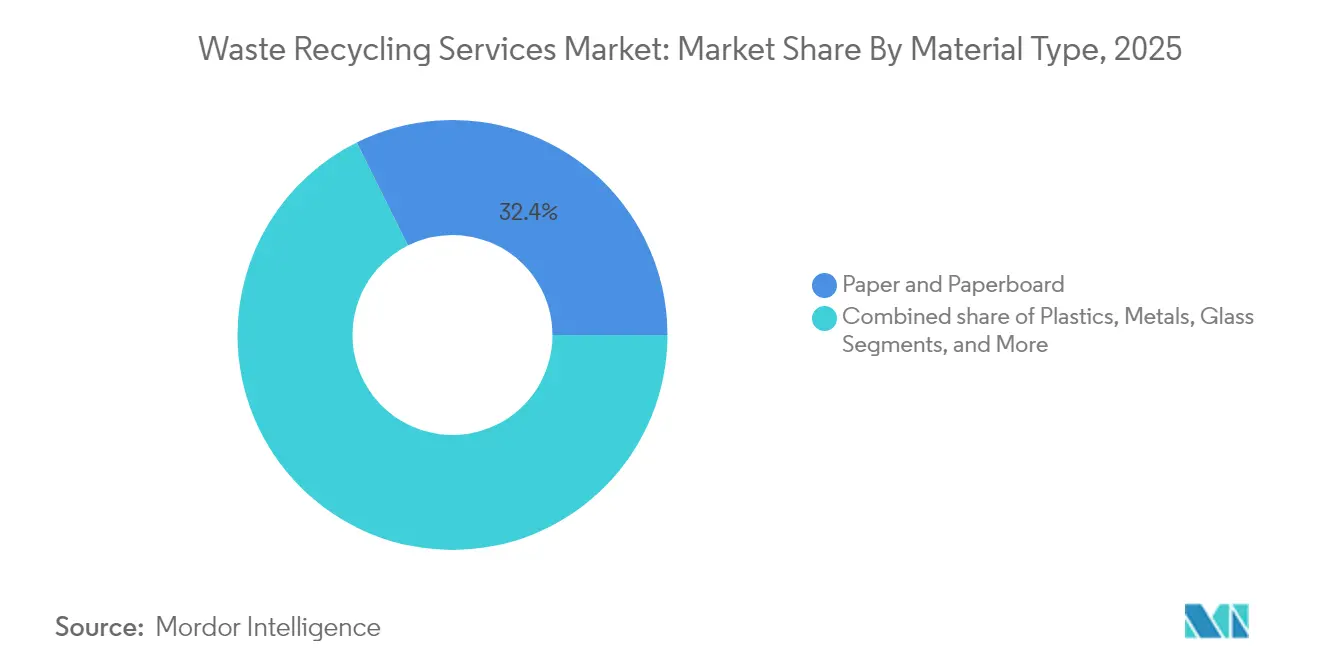
- By material type, Paper & Paperboard led with a 32.35% waste recycling services market share in 2025, while Batteries are projected to post the fastest 11.02% CAGR to 2031.
- By source, Industrial streams held 40.58% of the waste recycling services market size in 2025; Residential volumes are set to grow the quickest at a 6.84% CAGR through 2031.
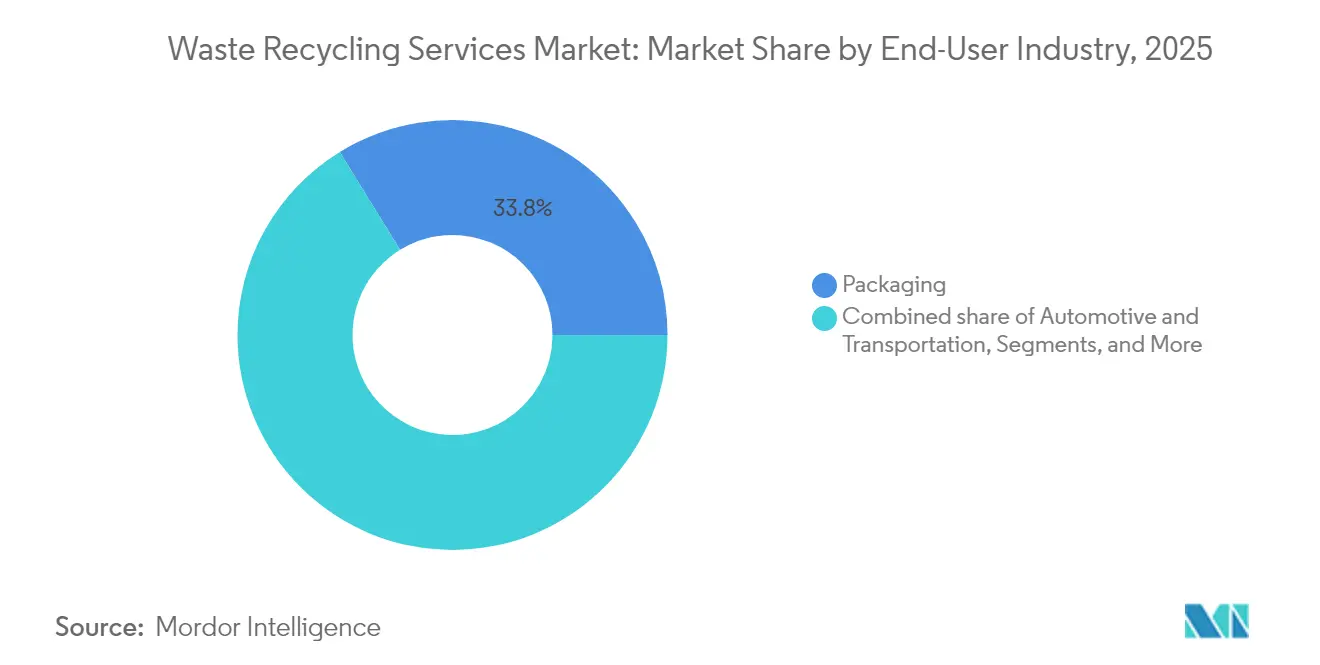
- By end-user industry, Packaging captured 33.78% revenue share in 2025; Electrical & Electronics is expected to expand at a 7.26% CAGR to 2031.
- By recycling process, Mechanical recycling maintained 61.12% waste recycling services market share in 2025, while Chemical/Advanced methods are forecast to grow at a 9.01% CAGR through 2031.
- By region, Europe accounted for 33.20% of 2025 revenue, whereas Asia-Pacific is on track for the highest 7.92% CAGR to 2031.
Note: Market size and forecast figures in this report are generated using Mordor Intelligence’s proprietary estimation framework, updated with the latest available data and insights as of 2026.
Global Waste Recycling Services Market Trends and Insights
Drivers Impact Analysis*
| Driver | (~) % Impact on CAGR Forecast | Geographic Relevance | Impact Timeline |
|---|---|---|---|
| Extended Producer Responsibility (EPR) Mandates Accelerating Recycling Contracts Across Europe | 1.2% | Europe, with spillover to North America | Medium term (2-4 years) |
| Surge in Lithium-Ion Battery Waste from EV Adoption Fueling Specialized Service Demand in Asia & North America | 0.9% | Asia-Pacific & North America core, emerging in Europe | Long term (≥ 4 years) |
| Corporate Net-Zero Supply-Chain Pledges Boosting Demand for Closed-Loop Recycling Partnerships in North America | 0.8% | North America & EU, expanding to APAC | Medium term (2-4 years) |
| Rapid Digitalization of Sorting Facilities (AI/Robotics) Reducing Operating Costs and Enhancing Material Recovery in OECD Markets | 0.7% | OECD markets, with technology transfer to emerging economies | Short term (≤ 2 years) |
| Emergence of Chemical Recycling Capacity Unlocking Hard-to-Recycle Plastics Streams, Particularly in APAC | 0.6% | APAC core, with pilot projects in Europe & North America | Long term (≥ 4 years) |
| Expanding Municipal Pay-As-You-Throw Programs Raising Residential Recycling Volumes in U.S. & EU | 0.5% | United States & EU, with pilot programs in Canada | Medium term (2-4 years) |
| Source: Mordor Intelligence | |||
Extended Producer Responsibility Mandates Accelerating Recycling Contracts Across Europe
The EU Packaging and Packaging Waste Regulation, effective February 2025, stipulates recyclability for all packaging by 2028 and a minimum of 30% recycled plastic content by 2030. The policy shifts disposal costs to producers and locks in long-term offtake contracts for recyclers. Harmonized targets remove cross-border compliance gaps, favoring integrated operators able to manage multi-jurisdiction logistics. Beverage groups are piloting closed-loop glass programs to capture post-consumer cullet, illustrating how regulation spurs process innovation[1]Virginijus Sinkevičius, “Proposal for a Regulation on Packaging and Packaging Waste,” European Commission, europa.eu.
Surge in Lithium-ion Battery Waste From EV Adoption Fueling Specialized Service Demand in Asia & North America
Global battery recycling capacity is forecast to top 3 million t per year by 2025 under mandatory take-back laws and critical minerals strategies. China has already reached 40% recycling rates, and automakers such as BMW have signed direct contracts with Redwood Materials to secure cobalt and nickel feedstock. High-value recovery, strict safety requirements, and rising insurance premiums create strong entry barriers that support premium pricing.
Corporate Net-zero Supply-chain Pledges Boosting Demand for Closed-loop Partnerships in North America
Large retailers are tying supplier contracts to verified emissions cuts. Walmart’s Project Gigaton claims 1 billion tons of avoided CO₂e with waste diversion as a core lever. Downstream, material producers such as Dow are co-developing proprietary technologies to recycle multilayer films, granting recyclers with traceability tools pricing power. Documentation burdens, however, tilt the market toward tech-enabled operators.
Rapid Digitalization of Sorting Facilities Reducing Operating Costs and Enhancing Material Recovery in OECD Markets
Robotics suppliers report a 20-30% uplift in capture rates and improved worker safety. AMP Robotics alone has guided the sortation of more than 2.5 million tons of recyclables. Denmark’s first robotised construction-waste plant achieves 90% purity on 25,000 t/y throughput. Up-front capex is high, but scale economies let large groups widen cost gaps over smaller rivals.
Restraints Impact Analysis*
| Restraint | (~) % Impact on CAGR Forecast | Geographic Relevance | Impact Timeline |
|---|---|---|---|
| Volatile Secondary Commodity Prices Undermining Service Profitability | -0.8% | Global, with acute impact in commodity-dependent regions | Short term (≤ 2 years) |
| Fragmented Collection Infrastructure in Emerging Economies Limiting Feedstock Quality | -0.6% | Emerging economies in Asia, Africa, and Latin America | Long term (≥ 4 years) |
| Rising Incidence of Lithium-Ion Battery Fires Increasing Insurance Costs for MRF Operators | -0.4% | Global, with concentrated impact in high-volume facilities | Medium term (2-4 years) |
| Inconsistent Definitions of "Recyclable" Materials Across Jurisdictions Complicating Service Standardization | -0.3% | Global, particularly affecting cross-border operations | Medium term (2-4 years) |
| Source: Mordor Intelligence | |||
Volatile Secondary Commodity Prices Undermining Service Profitability
Average recycled commodity prices at Republic Services swung from USD 117/tonnes in 2023 to USD 173/tonnes in Q2 2024, underlining revenue sensitivity. Futures contracts for recycled materials remain thin, leaving processors exposed. Larger vertically integrated firms hedge risk through diversified income streams, widening their competitive advantage.
Fragmented Collection Infrastructure in Emerging Economies Limiting Feedstock Quality
Informal picker networks deliver 20–50% recovery yet lack quality standards, hampering advanced recycling economics, ScienceDirect. In Accra, only 1,800 t of the 2,200 t of daily waste is formally collected. Pilot projects in Nairobi using guaranteed pricing and app-based tracking indicate that higher-quality feedstock is achievable but capital-intensive[2]Brenda Wilson, “Policy Integration of Informal Recycling Systems in Emerging Economies,” Journal of Material Cycles and Waste Management, springer.com.
*Our forecasts treat driver/restraint impacts as directional, not additive. The impact forecasts reflect baseline growth, mix effects, and variable interactions.
Segment Analysis
By Material Type: Batteries Outpace Established Paper Streams
Paper & Paperboard retained 32.35% waste recycling services market share in 2025, thanks to dense collection networks and mature pulping lines. Stable demand from packaging converters provides predictable volumes, while optical sorters now separate coated and mixed grades more efficiently. However, price pressure persists when virgin pulp markets soften, underscoring the need for cost-efficient logistics. Brand owners’ switch to recycled-content packaging secures baseline fibre demand and supports mill upgrades that handle lower-grade feedstock.
Battery recycling shows an 11.02% CAGR to 2031, far above any other material category. Complex hydrometallurgical flowsheets recover lithium, cobalt, and nickel at >90% efficiency, enabling processors to capture high intrinsic metal value. SK Chemicals’ USD 98.4 million chemical-recycling expansion illustrates the rush to secure early-mover advantage. Direct-recycling research aimed at retaining cathode structure could further boost margins by cutting energy use. Partnerships with automakers lock in spent-battery supply and de-risk capital spending, positioning specialised firms for outsized returns within the waste recycling services market.


By Source: Industrial Streams Dominate While Residential Volumes Accelerate
Industrial sources generated 40.58% of the waste recycling services market size in 2025, reflecting contracted, homogeneous waste flows from manufacturing and logistics hubs. Fixed agreements allow processors to invest in dedicated lines for metals, glass, or single polymers. The fastest volume uptick, however, arises from municipal pay-as-you-throw schemes, which are propelling Residential waste at a 6.84% CAGR. Massachusetts towns that adopted unit-based pricing cut waste by 44% and raised recycling rates markedly.
Commercial establishments benefit from corporate procurement policies that emphasise recycled content. Institutional healthcare waste is gaining prominence after Waste Management folded regulated medical services into its portfolio through the Stericycle deal. Smart-bin pilots in European housing estates transmit fill-level data, trimming collection mileage and lowering emissions while generating cleaner input for downstream recycling, reinforcing residential growth momentum in the waste recycling services market.
By End-User Industry: Electronics Growth Surpasses Packaging Maturity
Packaging held 33.78% waste recycling services market share in 2025 on the back of mandated EPR fees and well-established deposit-return infrastructure. Secondary fibre mills and PET recyclers maintain steady offtake, anchoring baseline revenue. Yet, the Electrical & Electronics segment is forecast to post a 7.26% CAGR through 2031, driven by stricter Basel Convention controls requiring written consent for e-waste shipments. High copper and precious-metal content, as well as legislative pressure to recover critical minerals, support premium gate fees.
Digital marketplaces such as Hitachi’s AI-driven platform connect device OEMs with certified recyclers, reducing transaction friction and improving audit trails. Concurrently, apparel and food brands exploring smart-label technology amplify traceability expectations across sectors, encouraging adoption of blockchain-enabled certificates in the waste recycling services market.
By Recycling Process: Chemical Innovation Challenges Mechanical Dominance
Mechanical recycling accounted for 61.12% of 2025 revenue due to entrenched baling, shredding, and washing assets that treat standard polymers at low cost. Line upgrades using near-infrared cameras now recover black plastics and films formerly destined for energy recovery. Chemical and other advanced routes, however, are expanding at a 9.01% CAGR, the fastest within the waste recycling services industry. The Rewind PET process from Axens, IFPEN, and JEPLAN depolymerises PET to monomers, enabling infinite re-use without quality loss.
Petronas is building one of Asia’s largest advanced-recycling hubs in Malaysia to process mixed plastic waste and generate circular feedstock for regional petrochemical plants. As voluntary recycled-content pledges tighten, chemical technologies will unlock hard-to-recycle multilayer packaging and divert feedstock from landfill, sharpening competitive differentials across the waste recycling services market.
Geography Analysis
Europe commanded 33.20% of global revenue in 2025 owing to unified EPR laws and deposit-return systems that secure high-quality feedstock. The Packaging and Packaging Waste Regulation now targets 90% collection of single-use bottles by 2029, guaranteeing throughput for PET re-processors. France’s textile-collection rule, effective in 2025, is catalysing joint ventures such as Reju with Nouvelles Fibres Textiles to handle post-consumer apparel. Nonetheless, the forthcoming ban on plastic waste exports to non-OECD nations from November 2026 forces processors to add domestic capacity, squeezing operators with limited capex flexibility.
Asia-Pacific is projected to record the fastest 7.92% CAGR to 2031 as advanced-recycling projects multiply. China’s battery-collection mandate already delivers 40% take-back rates, while South Korea’s catalyst breakthroughs cut chemical-recycling energy use. India’s Race Eco Chain partnership aims to satisfy a 30% recycled-plastic requirement by 2025-2026, lifting local demand for rPET flake. Yet, integrating informal picker systems remains a complex, capital-heavy undertaking that may temper realised growth within the waste recycling services market.
North America benefits from corporate circularity programs and a pipeline of municipal pay-as-you-throw adoptions. Waste Management, Republic Services, and other majors are pursuing bolt-on acquisitions to secure specialty streams and build renewable-gas portfolios. Battery-recycling tie-ups, typified by BMW and Redwood Materials, illustrate how OEMs are closing critical-mineral loops domestically. However, the national recycling rate has hovered near 35% for a decade, and investment in domestic re-processing is needed to offset export restrictions and enhance competitiveness.
Mordor Intelligence provides coverage of the waste recycling services market across other key regional markets, including Europe and North America, each with their regulatory frameworks and demand patterns.

Competitive Landscape
Competition remains fragmented but is edging toward consolidation. Large integrated players are scaling vertically into hazardous and specialist niches to stabilise cash flows. Waste Management’s USD 7.2 billion Stericycle takeover broadens its footprint in regulated medical waste processing, while Republic Services declared USD 1 billion for additional acquisitions in 2025, Waste Dive. Vertical integration allows these firms to secure feedstock, deploy robotics at scale, and negotiate offtake agreements directly with brand owners, deepening competitive moats.
Technology leadership is the second pillar shaping rivalry. Operators deploying AI sorting, chemical-recycling reactors, and advanced fire-suppression systems achieve higher material-recovery rates and risk profiles that command better insurance terms. AMP Robotics installations illustrate how automation raises purity levels and reduces labour dependency, pushing lagging facilities to upgrade or exit. Marketplace platforms for secondary materials, such as Hitachi’s AI exchange, further reward processors that can certify traceability and quality, differentiating them in the waste recycling services market.
Commodity-price swings and tightening safety standards inject uncertainty that disadvantages under-capitalised regional firms. Recycled-commodity price volatility directly influences earnings, compelling large groups to hedge through diversified service portfolios. Facility fires linked to lithium-ion batteries surged in 2024, prompting insurers to raise premiums. Well-capitalised multinationals can absorb the added costs of upgraded suppression systems, while smaller firms face margin erosion or shutdown risk.
Waste Recycling Services Industry Leaders
Veolia Environnement S.A.
Waste Management, Inc.
SUEZ SA
Covanta Holding Corporation
Biffa plc
- *Disclaimer: Major Players sorted in no particular order

Recent Industry Developments
- May 2025: Basel Convention parties adopted 28 decisions that clarify disposal codes and set a 2025-2031 framework for transboundary textile waste management.
- April 2025: Republic Services posted 3.8% revenue growth to USD 495 million net income; recycled-commodity prices averaged USD 155/t, and a new renewable-natural-gas plant came online.
- February 2025: Curio and Energy Northwest signed an MOU to advance NuCycle nuclear-fuel recycling at Columbia Generating Station.
- January 2025: LyondellBasell and Genox opened a plastics-recycling JV and inked an LOI with EEW for advanced waste-sorting collaboration.


Research Methodology Framework and Report Scope
Market Definitions and Key Coverage
Our study counts revenue earned when licensed operators collect, sort, process, and return post-consumer and post-industrial solid wastes, including paper, plastics, glass, metals, organics, e-scrap, batteries, and demolition debris, to the raw-material economy through mechanical, chemical, biological, or thermal routes.
Scope Exclusion: Informal scavenging, energy-only incineration, and wastewater treatment fall outside our definition.
Segmentation Overview
- By Material Type
- Paper & Paperboard
- Plastics
- Metals
- Glass
- Electronics (E-waste)
- Batteries
- Organics & Compostables
- Construction & Demolition Debris
- Textiles
- Other Materials (Rubber, etc.)
- By Source
- Residential
- Commercial (Retail, Offices, etc.)
- Industrial (Hazardous & Non-hazardous)
- Other Sources (Institutional, Heatlhcare, Agricultural, etc.)
- By End-User Industry
- Packaging
- Automotive & Transportation
- Electrical & Electronics
- Food & Beverage
- Construction
- Retail (E-commerce, Fashion)
- Others (Agriculture, Energy, etc.)
- By Recycling Process
- Mechanical Recycling
- Chemical / Advanced Recycling
- Biological (Composting/Anaerobic Digestion)
- Thermal (Pyrolysis, Gasification)
- Others (Electrochemical & Metallurgical Processes, Semi-automated Sorting)
- By Geography
- North America
- United States
- Canada
- Mexico
- South America
- Brazil
- Argentina
- Rest of South America
- Europe
- Germany
- United Kingdom
- France
- Italy
- Spain
- BENELUX (Belgium, Netherlands, and Luxembourg)
- NORDICS (Denmark, Finland, Iceland, Norway, and Sweden)
- Rest of Europe
- Middle East and Africa
- Saudi Arabia
- United Arab Emirates
- Turkey
- South Africa
- Nigeria
- Egypt
- Rest of Middle East and Africa
- Asia-Pacific
- China
- India
- Japan
- South Korea
- ASEAN (Indonesia, Thailand, Philippines, Malaysia, Vietnam)
- Rest of Asia-Pacific
- North America
Detailed Research Methodology and Data Validation
Primary Research
Interviews with municipal waste officers, integrated recyclers, and equipment suppliers across key regions clarified gate fees, contamination losses, and upcoming Extended Producer Responsibility milestones.
Desk Research
We mined open datasets such as UN Comtrade trade codes, Eurostat circular-economy dashboards, the US EPA Material Flow tables, Japan's Ministry of Environment recycling surveys, and OECD plastics statistics to size generation volumes and recovery rates.
Company 10-Ks, sustainability reports, and procurement filings gathered via D&B Hoovers, plus shipment records from Volza and patent cues in Questel, helped price services and map technology uptake. These examples are illustrative, not exhaustive.
Market-Sizing & Forecasting
A top-down build multiplies country waste generation by verified recovery rates and average service fees. It then cross-checks totals against operator revenues, sample gate-fee-times-tonnage math, and facility capacity roll-ups. Inputs include per-capita waste generation, industrial share of waste, secondary material price index, urbanization rate, and EPR compliance deadlines. A multivariate regression on GDP, urbanization, and commodity prices projects values to 2030, while scenario analysis captures policy shocks. Proxy ratios agreed during expert calls bridge data gaps.
Data Validation & Update Cycle
Models pass through variance scans, peer review, and anomaly checks before sign-off. We refresh annually and reopen the file after major policy or M&A events, so clients always see the latest vetted view.
Why Mordor's Waste Recycling Services Baseline Commands Reliability
Published figures vary because firms pick different waste streams, fee bases, and refresh cadences.
External releases place 2024 revenue near USD 65 billion. Mordor Intelligence values the market at USD 220.94 billion for 2025, reflecting inclusion of industrial and hazardous streams, plus wider geographic coverage.
Benchmark comparison
| Market Size | Anonymized source | Primary gap driver |
|---|---|---|
| USD 220.94 B (2025) | Mordor Intelligence | - |
| USD 65.09 B (2024) | Global Consultancy A | Municipal focus, static service fee, limited country sample |
| USD 65.38 B (2024) | Industry Intelligence B | Revenue roll-up only, no material-price factor, triennial refresh |
Because our model integrates broader streams, dynamic pricing, and annual updates, decision-makers can rely on Mordor's baseline as a balanced, transparent starting point for strategy and investment planning.


Key Questions Answered in the Report
What is the current value of the waste recycling services market?
The market is worth USD 235.23 billion in 2026 and is projected to reach USD 321.65 billion by 2031.
Which material type commands the largest revenue share today?
Paper & paperboard leads with 32.35% of 2025 revenue, supported by mature collection networks and steady demand from packaging converters.
Why are lithium-ion batteries considered the fastest-growing recycling segment?
Battery waste is expanding at an 11.02% CAGR because EV adoption and take-back mandates require specialised, high-value metal recovery services.
Which region is expected to grow the quickest through 2031?
Asia-Pacific shows the highest 7.92% CAGR, driven by chemical-recycling investments and formalization of informal collection networks.
How are Extended Producer Responsibility (EPR) rules influencing the market?
EPR mandates in Europe shift disposal costs to producers, lock in long-term recycling contracts, and raise demand for high-quality secondary materials.
What risks could slow market growth in the next few years?
Volatile secondary-commodity prices and rising lithium-ion battery fire incidents can squeeze processor margins and increase insurance costs.
Page last updated on:


