Industrial Waste Management Market Size and Share
Market Overview
| Study Period | 2019 - 2030 |
|---|---|
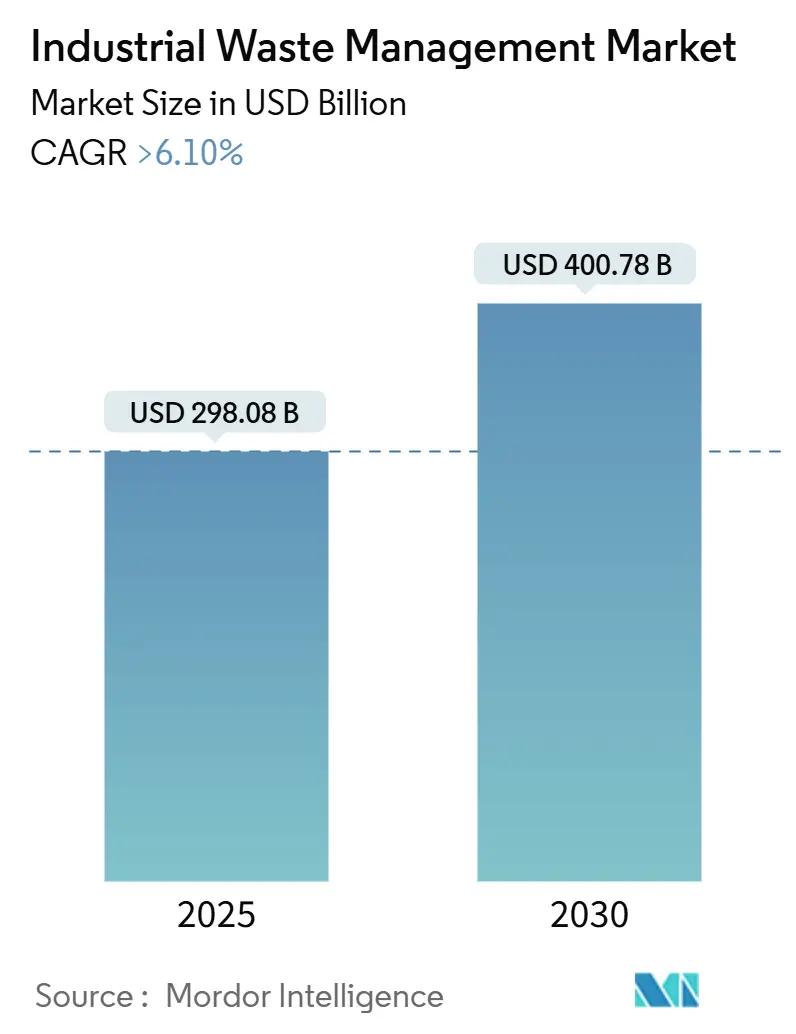
| Market Size (2025) | USD 298.08 Billion |
| Market Size (2030) | USD 400.78 Billion |
| Growth Rate (2025 - 2030) | 6.10% CAGR |
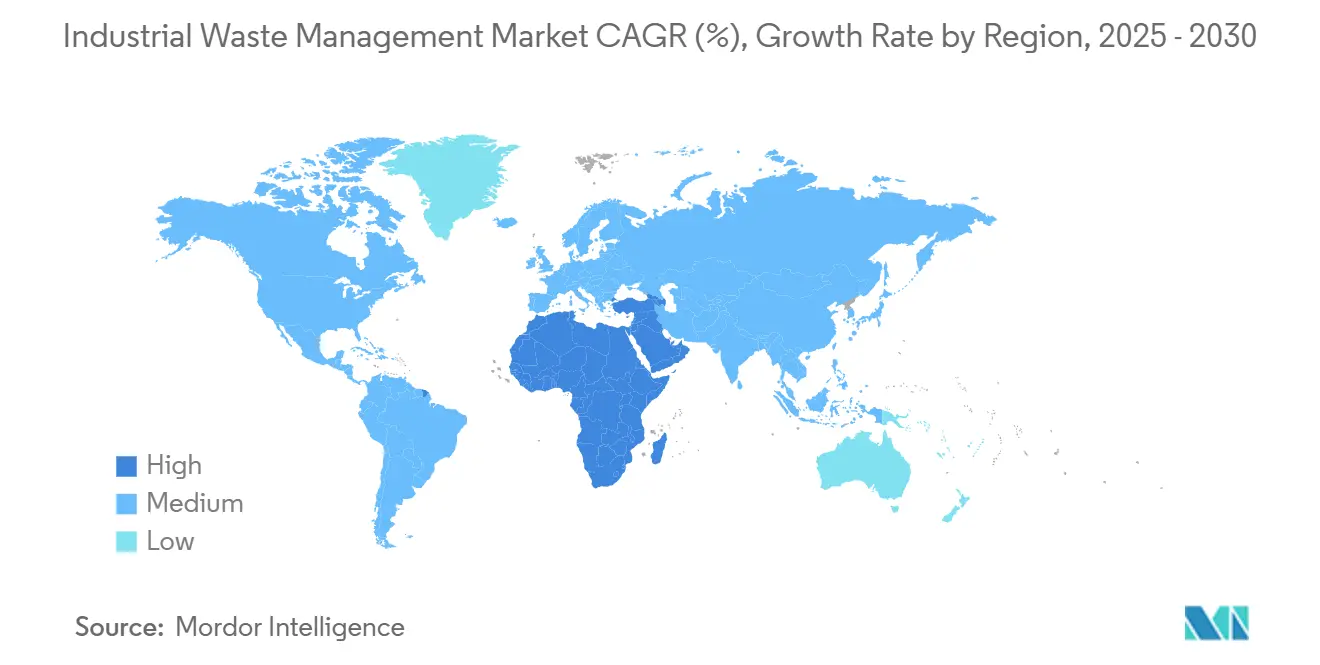
| Fastest Growing Market | Middle East and Africa |
| Largest Market | Asia Pacific |
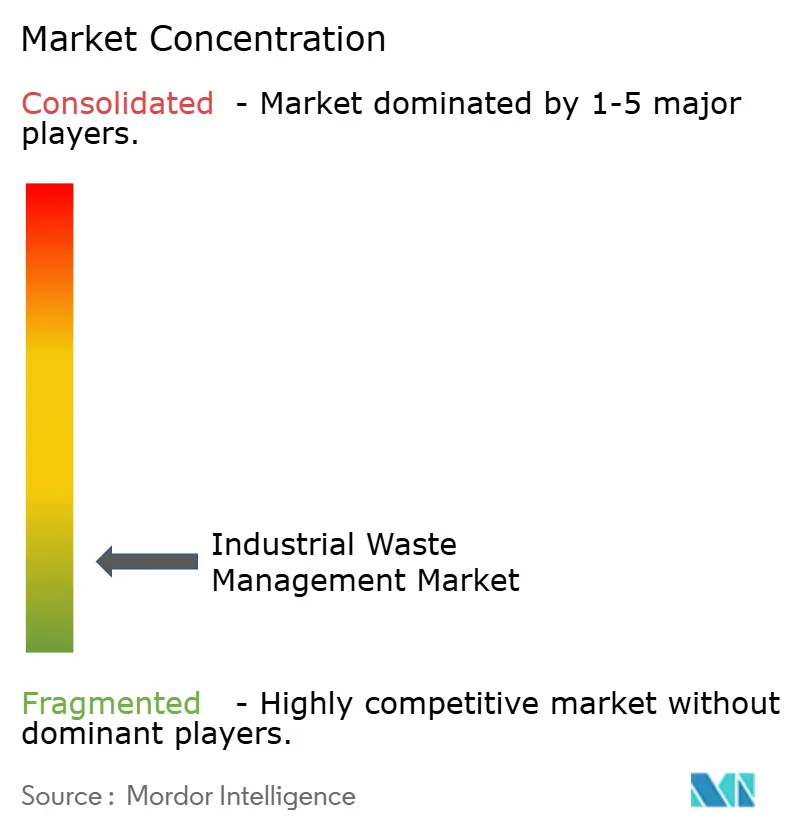
| Market Concentration | Low |
Major Players
*Disclaimer: Major Players sorted in no particular order Image © Mordor Intelligence. Reuse requires attribution under CC BY 4.0. |
|
Industrial Waste Management Market Analysis by Mordor Intelligence
The Industrial Waste Management Market size is estimated at USD 298.08 billion in 2025, and is expected to reach USD 400.78 billion by 2030, at a CAGR of greater than 6.10% during the forecast period (2025-2030). This trajectory signals rising expectations from regulators, investors, and communities that industrial operations internalize the true cost of waste. A material share of the upside comes from tighter rules on landfill diversion, which are already pushing manufacturers to embed resource efficiency into plant‐level key performance indicators. A further implication is that capital is shifting toward technologies that keep materials in productive use cycles, effectively treating waste streams as alternative feedstocks. The Industrial Waste Management industry is therefore evolving from a cost-centre orientation to a platform that supports industrial decarbonization through material circularity. As a result, financiers are beginning to view advanced treatment assets as infrastructure with utility-style risk profiles, a development that lowers the cost of capital for high-capex recovery plants. Market size expansion also signifies wider participation across regions, with Asia Pacific generating nearly half of global industrial waste yet capturing only a third of the industry’s profit pool. The scale imbalance indicates latent margin potential once advanced recovery infrastructure reaches critical mass in China, India, and Southeast Asia. Parallel to that, carbon-pricing schemes in Europe and North America continue to tilt the economics toward low-emission disposal methods, reshaping service demand by rewarding thermal treatments that capture energy and carbon. This policy pull is complemented by a demand-side push, as corporate zero-waste commitments gain traction among electronics, automotive, and food producers[1]U.S. Environmental Protection Agency. "Food: Material-Specific Data.". Consequently, market share is expected to redistribute toward service providers that blend on-site source segregation, AI-enabled sorting, and high-temperature chemical recycling all capabilities that improve recovery yields and unlock new revenue streams.
Key Report Takeaways
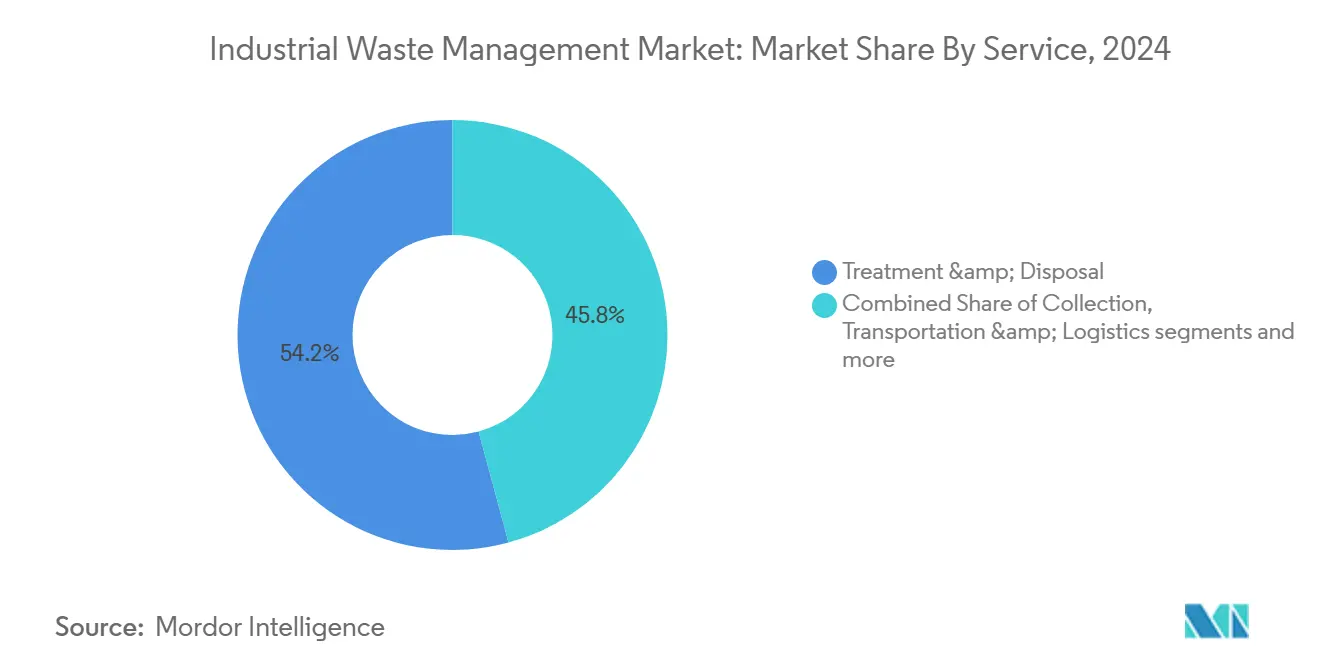
- By service, treatment, and disposal held 54.2% Industrial Waste Management market share in 2024, whereas the recycling and material recovery segment is forecast to expand at 8.1 % CAGR from 2025 to 2030.
- By disposal method, landfill accounted for 45% share of the Industrial Waste Management market in 2024, whereas the Incineration & Energy Recovery (RDF, SRF, WtE) segment is forecast to expand 8.7% from 2025 to 2030.
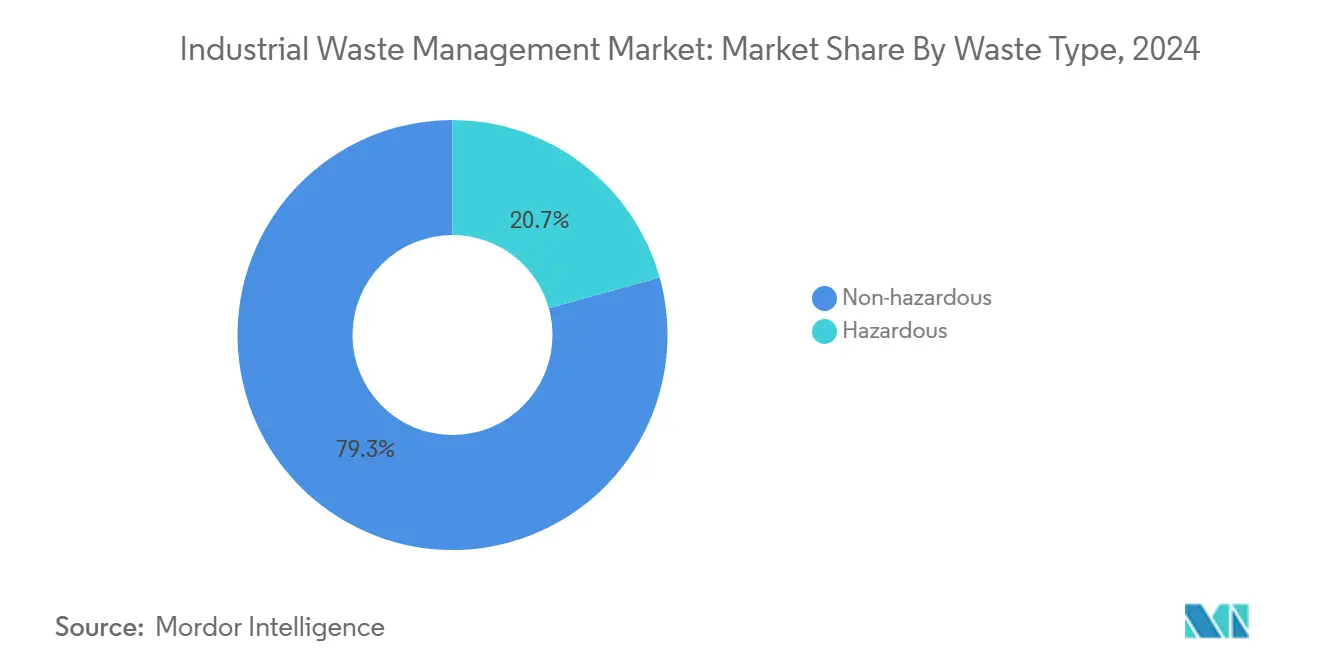
- By waste type, the non-hazardous waste segment occupied 79.3% share of the Industrial Waste Management market, whereas the hazardous waste segment is forecast to grow at 6.5 % CAGR through 2030.
- By industry, chemicals and petrochemicals held the largest share of the industrial waste textile market at 18.4% in 2024, whereas the electrical and electronics segment is set to grow 9.3% from 2025 to 2030.
- By geography, Asia accounted for 46.1% of the Industrial Waste Management market in 2024, whereas the Middle East is set to grow 8.5% through 2030.
Global Industrial Waste Management Market Trends and Insights
Drivers Impact Analysis*
| Driver | (~)% Impact on CAGR Forecast | Geographic Relevance | Impact Timeline |
|---|---|---|---|
| Growth of EU circular-economy regulations | +2.0 % | Europe, spillover globally | Medium term (2-4 years) |
| Decarbonization push for waste-derived fuels | +1.8 % | Global, focus on EU & NA | Long term (≥ 4 years) |
| Zero-waste-to-landfill mandates in North America | +1.5 % | North America, Europe | Medium term (2-4 years) |
| PPP infrastructure build-out in Middle East | +1.2 % | GCC economies | Medium term (2-4 years) |
| Expansion of hazardous-waste chemical recycling in Asia | +1.0 % | China, Japan, South Korea | Long term (≥ 4 years) |
| Source: Mordor Intelligence | |||
Growth of Circular-Economy Regulations in the EU Boosting Industrial Waste Valorization
Circular-economy statutes in the European Union increasingly require that industrial residuals be extracted for metals, solvents, and critical minerals before any thermal destruction or landfilling occurs. The European Commission’s latest implementation report shows a double-digit improvement in circular-material use since 2020, indicating rapid compliance uptake. As recovered feedstock volumes grow, manufacturers are redesigning products to accept secondary inputs, effectively widening the addressable market for high-purity recycles. One immediate outcome is rising inbound demand for specialty waste processors with hydrometallurgical and bioleaching capabilities, which positions the Industrial Waste Management market to capture a premium recovery margin.
Decarbonization Pressure Driving Demand for Waste-Derived Fuels in Heavy Industries
Cement, steel, and glass plants are co-firing refuse-derived fuel at substitution rates ranging from 18% to 35%, primarily to satisfy emerging carbon-cost pass-through clauses in long-term supply contracts. This fuel switch has spawned a specialty grade of engineered alternative fuel with tight calorific and moisture specifications, raising the bar for pre-treatment quality controls. Waste managers that deliver specification-ready pellets earn price premiums that exceed landfill tipping fees, creating a virtuous cycle of investment in shredding, drying, and densification assets. Consequently, the Industrial Waste Management industry is narrowing the historic divide between waste services and energy providers.
Zero-Waste-to-Landfill Mandates Accelerating in North American Manufacturing Hubs
Major North American factories, with 42% now adopting zero-waste targets, are generating a steady stream of source-segregated residuals. These residuals are subsequently funneled into private material recovery facilities. Those mandates shorten contract tenors for landfill disposal while extending multi-year service agreements for recycling and waste-derived fuel supply. Facilities that accomplish landfill elimination report notable cost reductions, underscoring that compliance can dovetail with competitive operating metrics. The unspoken benefit for the Industrial Waste Management industry lies in predictable feedstock flow, which de-risks capital spent on high-efficiency sorting and on-site preprocessing systems.
Expansion of Chemical Recycling Capacity for Hazardous Waste in Asia
China, Japan, and South Korea are commissioning solvent-recovery units and catalytic depolymerization lines that collectively lift Asian chemical recycling capacity by more than two-thirds between 2024 and 2027. These facilities target hazardous organic streams that contain embedded value yet demand stringent destruction controls. As break-even periods fall, mid-sized chemical producers are pivoting from incineration contracts to closed-loop solvent reuse, cutting virgin purchases and scope 3 emissions in tandem. The Industrial Waste Management market share of chemical recycling operators is set to climb as capacity relief removes geographic bottlenecks.
Restraints Impact Analysis*
| Restraint | (~)% Impact on CAGR Forecast | Geographic Relevance | Impact Timeline |
|---|---|---|---|
| Recyclate-price volatility | −1.5 % | Europe, North America | Short term (≤ 2 years) |
| Informal dumping in Africa & Asia | −1.2 % | Sub-Saharan Africa, South Asia | Long term (≥ 4 years) |
| Low segregation practices in South-American SMEs | −1.0 % | Brazil, Argentina | Medium term (2-4 years) |
| High capex for plasma gasification | −0.8 % | Developed markets | Medium term (2-4 years) |
| Source: Mordor Intelligence | |||
Limited Waste-Segregation Practices among South-American SMEs
Small and medium enterprises (SMEs) in South America continue to lag in waste segregation practices, with only 23% implementing comprehensive sorting systems in 2024. This operational gap significantly reduces the quality and value of recoverable materials, undermining the economics of downstream recycling processes. The challenge is compounded by fragmented regulatory frameworks that fail to provide consistent incentives or enforcement mechanisms for proper waste management. The knowledge and resource constraints faced by SMEs create a persistent barrier to adoption, despite the potential cost benefits of improved resource efficiency. This regional limitation has global implications for supply chains with South American manufacturing components, as multinational corporations increasingly require waste management compliance throughout their supplier networks.
*Our forecasts treat driver/restraint impacts as directional, not additive. The impact forecasts reflect baseline growth, mix effects, and variable interactions.
Segment Analysis
By Service: Material Recovery Outpaces Traditional Disposal
Although treatment and disposal held a 54.2% Industrial Waste Management market share in 2024, margin compression is evident where landfill gate fees remain static, yet compliance costs rise. Operators are modernizing with leachate recirculation and gas capture modules that earn carbon credits, creating new income streams even as tonnage declines. Meanwhile, transport services embed telematics that shrink empty mileage by 28%, sustaining profitability despite fuel-price volatility. Taken together, the stratification of service models suggests that high-tech recovery will absorb volume from low-tech disposal faster than historical trend lines imply.
The recycling and material recovery segment is forecast to expand at 8.1% CAGR from 2025 to 2030, outstripping the overall Industrial Waste Management market size growth. This surge reflects a regulatory pivot that penalizes disposal while creating tax incentives for closed-loop processing assets. Fresh data from plant audits indicates that AI-powered sorters now achieve 99 % identification accuracy, lifting bale purity and commanding higher commodity pricing. A secondary effect is that multi-service companies are restructuring route networks so that collection fleets feed directly into proprietary recovery plants, reducing logistics spend and tightening supply security.


By Disposal Method: Energy Recovery Challenges Landfill Dominance
In 2024, the landfill segment occupied a share of 45% of the market. Recycling sits between landfill and incineration in cost but leads in social license to operate, a factor that influences investment committee preferences at infrastructure funds. Operating data from Middle Eastern pilot plants shows pyrolysis oil yields exceeding 70% when feedstock consistency is maintained, a result that has accelerated funding commitments for scale-up facilities. The interplay of carbon pricing, energy insecurity, and corporate sustainability pledges thus pushes disposal economics toward solutions that both shrink waste volume and create dispatchable power.
Energy-from-waste solutions exhibit an 8.7% CAGR outlook to 2030, eroding landfills’ 45% Industrial Waste Management market share through a combination of energy revenue and carbon abatement value. Regulatory signals in Europe have already capped methane emissions per landfill cell, prompting operators to bolt on gasification units that convert residual organics to syngas. This retrofit model demonstrates that the boundary between landfill and thermal treatment is increasingly porous, enabling site owners to extract incremental returns from legacy assets[2]U.S. Environmental Protection Agency. "Key EPA Actions to Address PFAS.".
By Waste Type: Hazardous Waste Management Complexity Drives Growth
In 2024, the non-hazardous waste segment occupied the largest market share of 79.3%. Regulation now classifies PFAS and certain lithium battery chemistries as hazardous, instantly enlarging the addressable treatment pool. Specialized destruction technologies plasma arc, supercritical water oxidation, carry barriers to entry that protect margins, explaining why hazardous waste service providers consistently record EBITDA spreads above the industry median. One immediate inference is that multi-national waste groups are channeling capex disproportionately into hazardous treatment clusters, betting on long-run demand.
Hazardous waste is forecast to grow at a 6.5% CAGR through 2030, outpacing non-hazardous categories despite representing just 20.7% of the Industrial Waste Management market size in 2024. The hazardous segment also stimulates resource recovery, as spent solvents and high-value metals can offset processing costs. Emerging facilities integrate continuous emissions monitoring and blockchain tracking, raising transparency for regulators and clients alike. Such traceability advantages increasingly appear in procurement scoring, giving compliant operators a commercial edge. For Industrial Waste Management industry stakeholders, this means that capability in hazardous waste is becoming a prerequisite for participation in high-growth verticals such as battery recycling.
By Industry: Electronics Sector Leads Growth Amid Diversified Demand
Chemicals and petrochemicals were the single largest waste-generating industry at 18.4% Industrial Waste Management market share in 2024, reflecting not only sector size but also stringent compliance regimes. Process intensification in refineries yields higher concentrations of hazardous residuals that require advanced treatment, sustaining demand for specialized incineration and solvent regeneration. At the same time, food and beverage processors accelerate anaerobic digestion adoption, converting organic waste into biogas that substitutes natural gas inside plants. These diverse trajectories illustrate how industry-specific drivers cumulatively expand overall market size, reinforcing a view that no single vertical can saturate service capacity in the medium term.
The electrical and electronics sector is set to register a 9.3% CAGR through 2030, the fastest within the Industrial Waste Management market. Rapid device turnover and design miniaturization create complex waste streams rich in precious metals, motivating high-grade urban mining. Waste companies that deploy hydrometallurgical extraction see immediate revenue upside from metal spot-price appreciation, effectively hedging against landfill demand decline.
Geography Analysis
Asia Pacific commands 46.1% Industrial Waste Management market share in 2024, anchored by heavy manufacturing footprints in China and India. Local authorities that once relied on export channels for waste disposal now enforce domestic valorization, leading to a 43% rise in high-spec recycling capacity between 2022 and 2024. Capital expenditure tilts toward facilities capable of handling multi-material streams, an operational design that enables rapid adjustment to shifting industrial outputs. An emergent pattern shows state-owned utilities taking minority stakes in private waste enterprises, signaling official recognition that resource recovery is a quasi-strategic asset class.
The Middle East exhibits the highest regional CAGR at 8.5% to 2030, driven by national diversification plans that seek to monetize waste as feedstock for downstream industries. Saudi Arabia and the UAE are pairing PPP concessions with long-term offtake agreements, creating bankable revenue frameworks for greenfield plants. Early adopters employ leapfrog technologies such as low-oxygen gasification, bypassing phased modernization and achieving European-level emissions standards from day one. As industrial symbiosis parks gain traction, waste heat from plastics pyrolysis is now being piped to adjacent desalination units, illustrating integrated resource planning absent in legacy Western systems.
North America remains a mature but innovative market where zero-waste corporate programs translate into consistent feedstock for material recovery facilities. Federal grants worth USD 1.7 billion for advanced recycling pilots underscore policy support for next-generation infrastructure[3]UN Environment Programme. "Global Waste Management Outlook 2024: Beyond an Age of Waste – Turning Rubbish into a Resource." . Landfill operators respond by installing cell-level methane capture that sells into renewable natural gas contracts, effectively prolonging asset relevance while aligning with climate imperatives. Europe, though smaller in volume, continues to set the regulatory benchmark that others emulate, ensuring its influence on technology and service models far exceeds its tonnage share.
Mordor Intelligence provides coverage of the industrial waste management market across other key regional markets, including North America, Europe, and Middle East, each with their regulatory frameworks and demand patterns. Detailed country-level analysis extends to United Arab Emirates incorporating local coverage and market participation, as required.

Competitive Landscape
In 2024, the top five players in the Industrial Waste Management industry command control over approximately one-third of the global revenue, highlighting the industry's fragmented nature. Market incumbents refine competitive positioning by acquiring niche technology firms evident in Veolia’s recent USD 2 billion commitment to hazardous-waste assets. Technology investment focuses on AI sortation, robotics, and digital twins that forecast waste generation, providing clients granular data to fulfill ESG reporting obligations. These digital layers move the service proposition up the value chain, positioning providers as data partners rather than simple haulers.
White-space opportunities cluster around emergent waste types such as lithium-ion batteries, PFAS-laden sludges, and composite scrap from wind‐turbine blades. Service providers that master bespoke chemistries capture early-mover rents and erect knowledge barriers against fast followers. Concurrently, platform entrants leverage cloud marketplaces to optimize backhaul logistics, reducing cost-per-ton for small and mid-sized generators who were historically under-served. This democratization of access hints at a future where asset-light intermediaries coexist with asset-heavy processors, each carving distinctive market share niches.
Financial metrics reveal that integrated players report steadier cash flows than single-service firms, due largely to cross-subsidization among collection, processing, and energy-sale units. Bond rating agencies cite diversified earnings as a factor behind recent credit upgrades for major operators, enabling lower borrowing costs and further inorganic expansion. A telling indicator is the 27% improvement in recovery rates at Waste Management Inc.’s AI-equipped MRFs, which translates into stronger commodity sales and confirms that technology leadership can offset volume variability.
Industrial Waste Management Industry Leaders
-
Veolia Environment SA
-
Suez Environment S.A.
-
Republic Services, Inc.
-
Waste Connections
-
Biffa Group
- *Disclaimer: Major Players sorted in no particular order

Recent Industry Developments
- May 2025: Veolia committed USD 1.2 billion to expand hazardous-waste chemical recycling capacity across Asia Pacific; the multi-site program targets complex organics and includes on-site energy recovery.
- April 2025: Republic Services finalized the USD 2.2 billion acquisition of US Ecology, integrating a nationwide hazardous treatment network into its industrial client portfolio.
- March 2025: SUEZ and REMONDIS created a joint venture to scale electronic-waste recycling in Europe, pooling advanced hydrometallurgical extraction know-how and logistics assets.
- February 2025: Clean Harbors opened a USD 120 million high-temperature incinerator in Texas; the facility boosts annual hazardous-waste throughput by 60,000 tons and meets best-available control technology standards.


Research Methodology Framework and Report Scope
Market Definitions and Key Coverage
According to Mordor Intelligence, we define the industrial waste management market as the planning, collection, transport, treatment, material recovery, and final disposal of solid, liquid, or gaseous residues generated by manufacturing, processing, energy, and extractive activities, with revenues captured at the service-provider level during 2025 in constant 2024 US dollars. We deliberately count only fee-based services and do not include equipment sales or internal captive treatment costs.
Scope Exclusions: Household, municipal solid, and construction-demolition waste streams are excluded, as are sales of waste-processing machinery.
Segmentation Overview
-
By Service
- Collection
- Transportation & Logistics
- Treatment & Disposal
- Recycling & Material Recovery
-
By Disposal Method
- Landfill
- Recycling
- Incineration & Energy Recovery (RDF, SRF, WtE)
-
By Waste Type
- Non-hazardous
- Hazardous
-
By Industry
- Chemicals & Petrochemicals
- Oil & Gas
- Power Generation
- Metal & Mining
- Food & Beverage Processing
- Pharmaceuticals
- Electrical & Electronics
- Construction Materials
-
By Geography
-
North America
- United States
- Canada
- Mexico
-
South America
- Brazil
- Argentina
- Rest of South America
-
Europe
- United Kingdom
- Germany
- France
- Italy
- Spain
- Russia
- Nordics (Sweden, Norway, Denmark, Finland)
- Rest of Europe
-
Middle East and Africa
- Saudi Arabia
- United Arab Emirates
- Turkey
- South Africa
- Egypt
- Nigeria
- Rest of Middle East and Africa
-
Asia-Pacific
- China
- India
- Japan
- South Korea
- ASEAN (Indonesia, Malaysia, Philippines, Thailand, Vietnam)
- Australia
- Rest of Asia-Pacific
-
North America
Detailed Research Methodology and Data Validation
Primary Research
Mordor analysts interviewed environmental regulators, EHS managers at chemical, metal, and power plants, and senior executives of integrated waste contractors across Asia-Pacific, North America, Europe, and the Gulf. These discussions validated disposal cost ranges, landfill diversion targets, and region-specific recovery rates, filling gaps revealed during desk work.
Desk Research
We began with open data sets such as the US EPA Biennial Hazardous Waste Report, Eurostat waste statistics, Japan's Ministry of the Environment surveys, and UN Comtrade shipment codes that track secondary raw materials. Our analysts also consulted position papers from the International Solid Waste Association, Basel Convention technical guidelines, and national cement associations that disclose co-processing volumes. Company 10-Ks, sustainability filings, and global tender notices were mined via Dow Jones Factiva, while D&B Hoovers and Volza supported revenue benchmarking and cross-border flow checks. These sources are illustrative only; many other public and subscription assets informed data collection, validation, and clarification.
Market-Sizing & Forecasting
A top-down model converts industrial output and waste-generation intensity factors into a disposal demand pool, which is then checked with selective bottom-up roll-ups of operator revenues and sampled average service prices. Where facility-level data were sparse, ratios derived from interviews bridged gaps before final calibration. Key variables include hazardous-to-non-hazardous split, regulated landfill gate fees, waste-to-energy capacity utilization, recycling credit incentives, and regional manufacturing value added. We project the market through 2030 using a multivariate regression linking service revenues to industrial PMI trends, capital-expenditure cycles, and announced regulatory milestones.
Data Validation & Update Cycle
Our analysts subject every draft model to variance checks against historical disposal tonnage and operating margins, followed by peer review among senior team members. Reports refresh annually, and material events such as major regulatory amendments or large mergers trigger interim updates. A final pre-publication sweep ensures clients receive the latest view.
Why Mordor's Industrial Waste Management Baseline Offers Dependable Guidance
Published estimates often diverge because firms mix waste categories, apply different price bases, and update models at varying cadences.
Key Gap Drivers include inclusion of municipal streams, counting equipment sales as service revenue, unvetted conversion ratios, and aggressive escalation of average service prices, whereas Mordor's study limits scope to industrial clients and validates every price-volume pair through dual-source checks.
Benchmark comparison
| Market Size | Anonymized source | Primary gap driver |
|---|---|---|
| USD 298.08 billion (2025) | Mordor Intelligence | |
| USD 1,647.42 billion (2024) | Global Consultancy A | Combines municipal, construction, and household waste and adds equipment sales, inflating totals |
| USD 581.61 billion (2025) | Industry Journal B | Aggregates landfill operator earnings and applies uniform growth without segment checks |
In summary, Mordor's disciplined variable selection, transparent modeling steps, and timely updates give decision-makers a balanced, reproducible baseline they can confidently use for strategy and investment planning.


Key Questions Answered in the Report
What is the current Industrial Waste Management market size?
The market stands at USD 298.08 billion in 2025 and is projected to reach USD 422.65 billion by 2030.
Which region holds the highest Industrial Waste Management market share?
Asia Pacific leads with roughly 46% of global revenue in 2024 due to rapid industrialization and tightening environmental laws.
Which service segment is growing the fastest within the Industrial Waste Management industry?
Recycling and material recovery services are expanding at 8% CAGR, driven by circular-economy policies and rising commodity prices.
Why is hazardous waste management gaining prominence?
Stricter global regulations on chemicals such as PFAS and the growth of battery manufacturing require specialized destruction and recovery technologies.
Page last updated on:


