Radiology Services Market Size and Share
Market Overview
| Study Period | 2020 - 2031 |
|---|---|
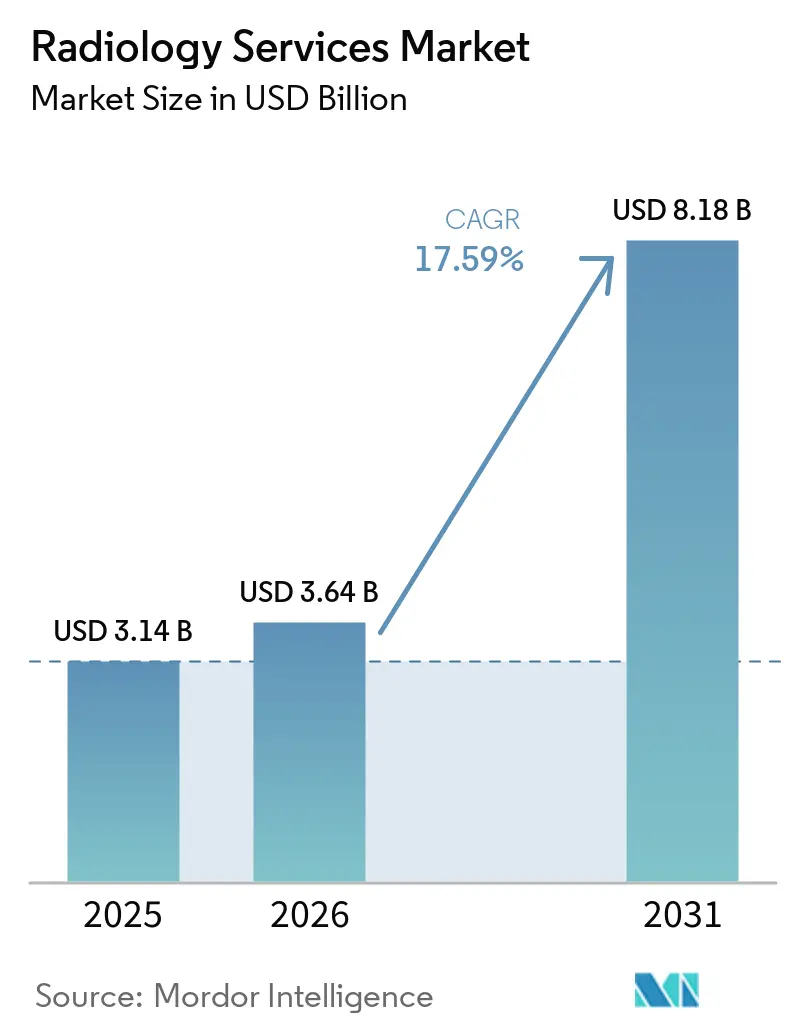
| Market Size (2026) | USD 3.64 Billion |
| Market Size (2031) | USD 8.18 Billion |
| Growth Rate (2026 - 2031) | 17.59% CAGR |
| Fastest Growing Market | Asia-Pacific |
| Largest Market | North America |
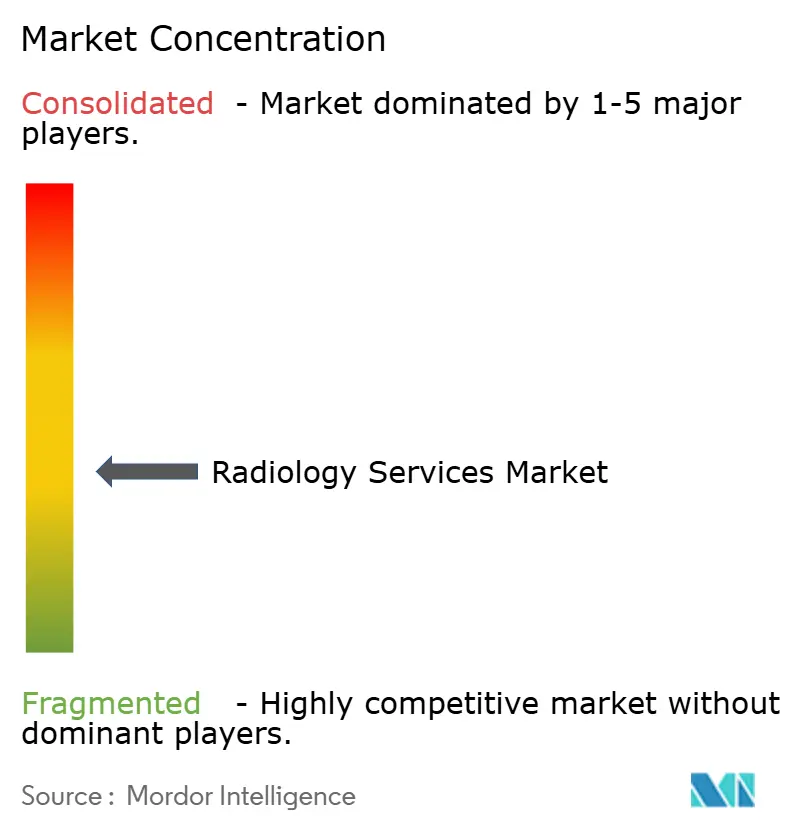
| Market Concentration | Medium |
Major Players *Disclaimer: Major Players sorted in no particular order Image © Mordor Intelligence. Reuse requires attribution under CC BY 4.0. | |
Radiology Services Market Analysis by Mordor Intelligence
The Radiology Services Market size was valued at USD 3.14 billion in 2025 and is estimated to grow from USD 3.64 billion in 2026 to reach USD 8.18 billion by 2031, at a CAGR of 17.59% during the forecast period (2026-2031).
The radiology services market is growing because imaging has become part of long treatment pathways rather than a one-time diagnostic step in many chronic conditions. The same market is also being reshaped by AI-assisted reading tools and broader teleradiology coverage, which allow larger provider networks to use radiologist capacity more efficiently than stand-alone centers. The shift of imaging volume toward outpatient and freestanding settings is changing referral patterns and site economics, which is pushing both hospital systems and independent operators to expand their footprints. Competition in the radiology services market is rising as operators pursue acquisitions, joint ventures, and digital workflow investments to protect utilization and retain referral volumes. Reimbursement pressure and workforce shortages are still limiting factors, but they are also strengthening the position of providers that can spread fixed costs across multi-site networks and use technology to support throughput.
Key Report Takeaways
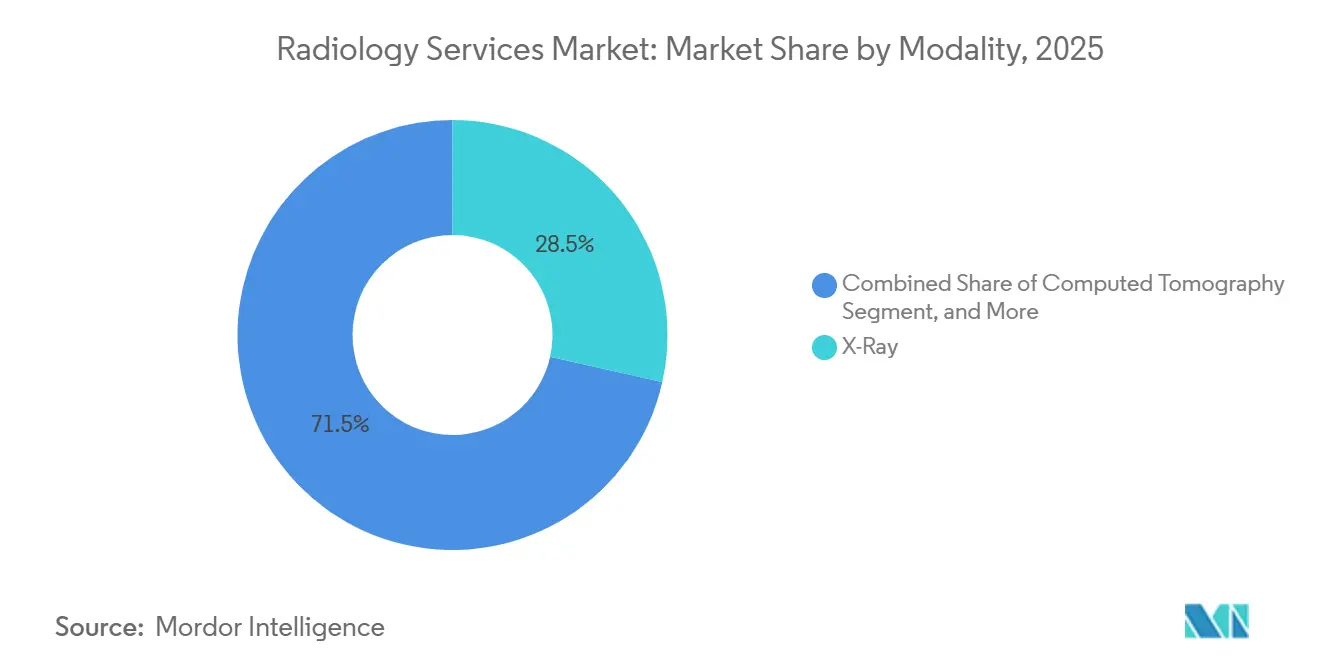
- By modality, X-ray accounted for 28.53% in 2025, while computed tomography is projected to record the fastest CAGR of 19.24% through 2031.
- By service type, diagnostic imaging services accounted for 37.38% of revenue in 2025, while interventional radiology is projected to expand at 22.82% CAGR through 2031.
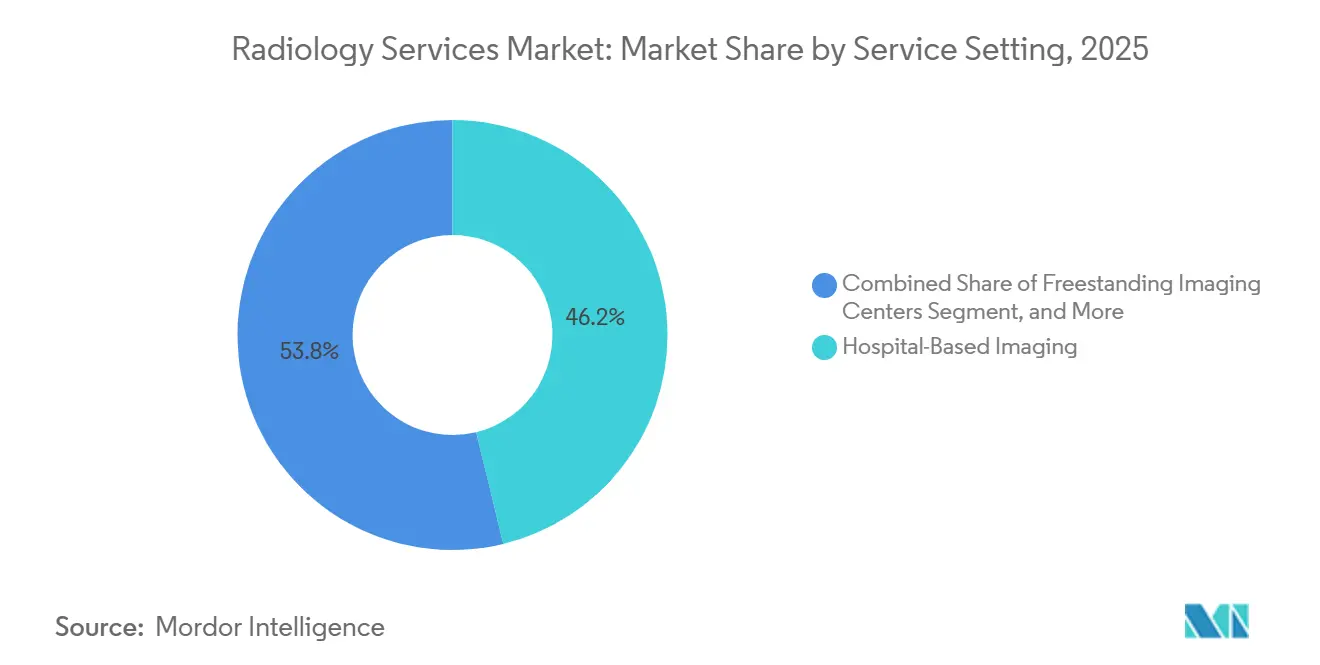
- By service setting, hospital-based imaging held 46.16% of revenue in 2025, while freestanding imaging centers are forecast to grow at 18.53% CAGR through 2031.
- By delivery model, owned and operated networks represented 49.12% of revenue in 2025, while teleradiology-enabled networks are projected to advance at 20.05% CAGR through 2031.
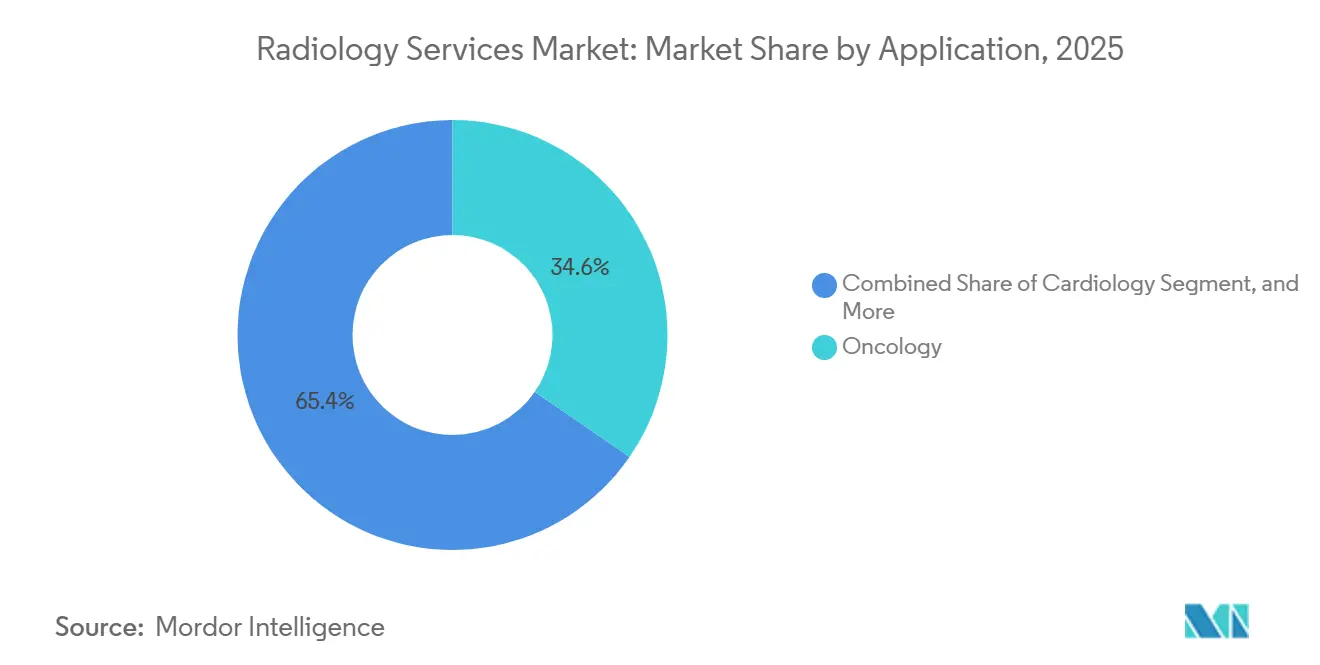
- By application, oncology accounted for 34.63% of revenue in 2025, while neurology and spine are projected to expand at 19.85% CAGR through 2031.
- By end user, hospitals held 52.81% of revenue in 2025, while diagnostic imaging centers are forecast to grow at 21.34% CAGR through 2031.
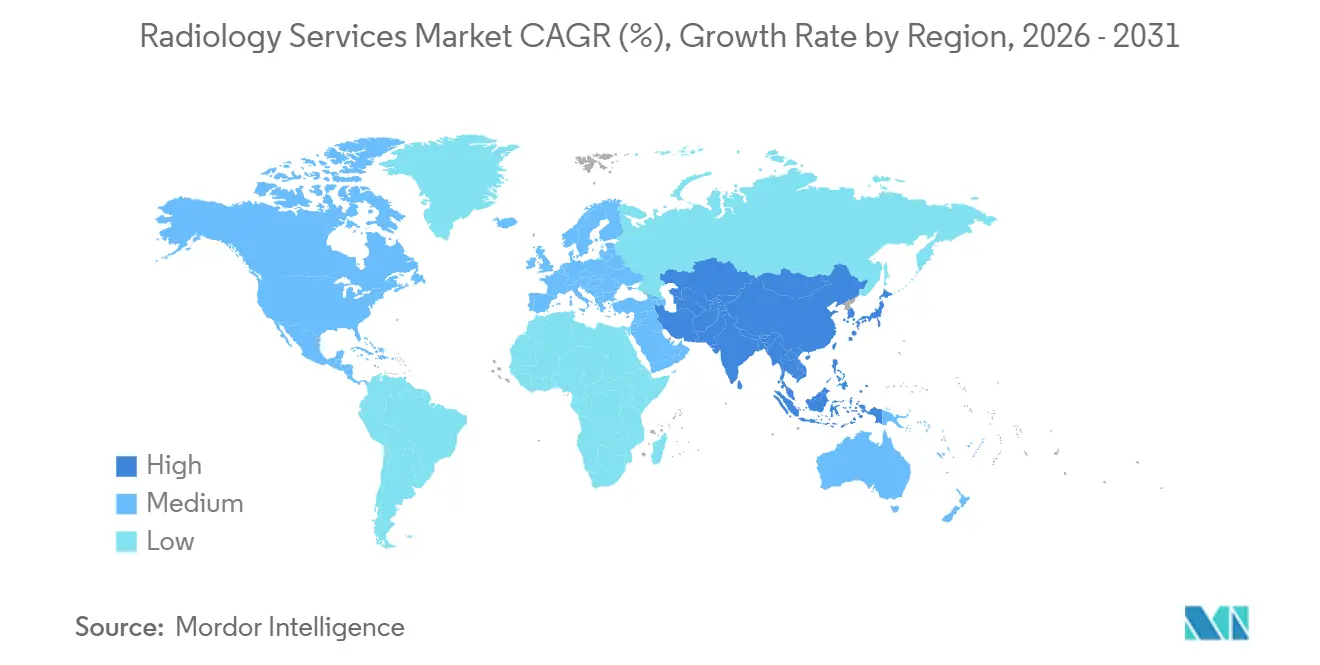
- By geography, North America led with 38.63% share in 2025, while Asia-Pacific is projected to grow at 20.38% CAGR through 2031.
Note: Market size and forecast figures in this report are generated using Mordor Intelligence’s proprietary estimation framework, updated with the latest available data and insights as of January 2026.
Global Radiology Services Market Trends and Insights
Drivers Impact Analysis*
| Driver | (~) % Impact on CAGR Forecast | Geographic Relevance | Impact Timeline |
|---|---|---|---|
| Rising Chronic Disease Burden and Repeat Imaging Demand | +4.2% | Global, with strongest intensity in North America, Western Europe, and aging Asia-Pacific markets | Long term (≥ 4 years) |
| Outpatient Shift of Imaging Volumes | +3.1% | North America and Europe, with spillover into Australia and South Korea | Medium term (2-4 years) |
| AI-Assisted Workflow Compression in Reading and Triage | +3.5% | North America, the European Union, and major Asia-Pacific urban hubs | Medium term (2-4 years) |
| Expansion of Teleradiology Coverage Across Underserved Facilities | +2.8% | Asia-Pacific, the Middle East and Africa, and South America | Long term (≥ 4 years) |
| Prior Authorization Friction Redirecting Volume to Networked Providers | +1.9% | North America, especially the United States, with early parallels in Australia | Short term (≤ 2 years) |
| Helium and Contrast Supply Resilience Becoming a Service Differentiator | +0.8% | Global, with sharper exposure in the Middle East and Africa and South and Southeast Asia | Short term (≤ 2 years) |
| Source: Mordor Intelligence | |||
Rising Chronic Disease Burden and Repeat Imaging Demand
The radiology services market is benefiting from a larger pool of patients who need repeated imaging over long periods of care. Cancer, cardiovascular disease, and neurodegenerative disorders often require several scans across diagnosis, treatment planning, response monitoring, and follow-up. That pattern increases the number of billable imaging episodes generated by each patient and raises the value of networks that can provide multiple modalities in one referral pathway. The radiology services market also gains when providers have subspecialty reading depth in oncology and neurology because those cases often require higher-acuity interpretation. This demand pattern favors multi-site operators that can keep patients inside the same network across CT, MRI, PET, and nuclear imaging over time.
Outpatient Shift of Imaging Volumes
The radiology services market is also being lifted by the continued movement of imaging volume away from hospital departments and into lower-cost outpatient settings. Providers and payers both benefit when appropriate studies move into freestanding centers because the service can be delivered with lower overhead and better scheduling flexibility. Hospital systems are not simply losing that volume, because many are building or buying their own outpatient networks to keep referral relationships intact. This is changing local competition in the radiology services market by placing hospital-backed centers in more direct competition with independent operators. The pace of this shift still varies by market because payer mix, local regulation, and certificate-of-need rules affect how quickly new capacity can be added.[1]American Journal of Roentgenology coverage via Radiology Business, “Shift Toward Imaging Outside the Hospital Could Save Billions,” Radiology Business, radiologybusiness.com
AI-Assisted Workflow Compression in Reading and Triage
The radiology services market is seeing meaningful productivity gains from AI tools that go beyond image detection and now support workflow coordination. These systems can prioritize urgent cases, automate routine parts of reporting, and reduce manual work in busy reading environments. Published research found that AI can lower radiologists' image interpretation workload by 53%, which supports better use of limited specialist capacity when the tools are deployed effectively.[2]Springer Nature, “The Role of AI in Mitigating the Impact of Radiologist Shortages, A Systematised Review,” Health and Technology, springer.com Regulatory pathways are also becoming clearer across the United States, Europe, and China, which gives larger operators more confidence to scale compliant AI deployments across sites. In the radiology services market, this creates a widening cost and throughput gap between large networks with integrated platforms and smaller providers that still depend on manual workflows.
Expansion of Teleradiology Coverage Across Underserved Facilities
The radiology services market is expanding into underserved areas because distributed reading models are improving access to radiologist coverage outside major urban centers. Teleradiology now supports more than overnight reading, because platforms increasingly combine remote interpretation with AI-based case triage and routing. That makes it easier for smaller hospitals and community sites to obtain subspecialty support without building a full in-house team. The radiology services market, therefore, gains new addressable demand in regions where equipment is present but radiologist availability remains limited. This is especially relevant in Asia-Pacific, parts of the Middle East and Africa, and some South American markets where workforce constraints are still more severe than equipment constraints.
Restraints Impact Analysis*
| Restraint | (~) % Impact on CAGR Forecast | Geographic Relevance | Impact Timeline |
|---|---|---|---|
| Radiologist and Technologist Shortages | -2.1% | North America, Western Europe, and Australia | Long term (≥ 4 years) |
| Reimbursement Compression in Advanced Imaging | -3.0% | North America and Western Europe | Short term (≤ 2 years) |
| High CAPEX and Replacement Cycle Dependency | -2.2% | Global, with stronger pressure in the Middle East and Africa, South America, and Southeast Asia | Medium term (2-4 years) |
| Data Privacy and Interoperability Burden Across Distributed Networks | -0.9% | The European Union, North America, and fragmented Asia-Pacific systems | Medium term (2-4 years) |
| Source: Mordor Intelligence | |||
Radiologist and Technologist Shortages
The radiology services market continues to face a structural staffing gap that limits how much demand can be converted into finished reads and billed procedures. A 2025 study in the American Journal of Neuroradiology documented a cumulative 10-year deficit of 21,645 anticipated diagnostic radiology graduates relative to job listings between 2014 and 2023.[3]American Journal of Neuroradiology, “In Plain Sight, A Radiology Workforce Crisis in the Making, Gap Between Job Growth and the Radiology Training Pipeline,” AJNR, ajnr.org A separate 2026 study reported that radiologist turnover in the United States rose from 5.3% to 8.5% between 2013 and 2022, which shows how workload pressure is affecting retention. The radiology services market is therefore growing faster than the available specialist pool in several mature regions. Providers that expand AI support, shared reading pools, and distributed staffing models are better positioned than operators that still rely only on local in-house teams.
Reimbursement Compression in Advanced Imaging
The radiology services market is also constrained by lower payment growth in diagnostic imaging, especially in publicly funded or tightly managed reimbursement systems. CMS finalized its 2026 Medicare Physician Fee Schedule with a 2.5% efficiency adjustment across non-time-based procedures and estimated a net impact of -2% for diagnostic radiology and -1% for nuclear medicine. The pressure is strategically important because interventional radiology received a positive 2% impact, which changes service-line economics inside the same provider organization. France reported that imaging spending rose 7.0% in 2024 while imaging prices fell 1.0%, which shows how operators are being pushed to rely on higher volumes to maintain revenue. In the radiology services market, this pricing pressure favors networks that can spread compliance, staffing, and equipment costs across a larger installed base.
*Our forecasts treat driver/restraint impacts as directional, not additive. The impact forecasts reflect baseline growth, mix effects, and variable interactions.
Segment Analysis
By Modality: CT Expansion Anchored by Next-Generation Photon-Counting Platforms
Computed tomography is the fastest-growing modality in the radiology services market at 19.24% CAGR from 2026 to 2031, while X-ray remained the leading modality by revenue with market share of 28.53% in 2025. CT is gaining ground because new photon-counting and spectral systems are widening its usefulness across oncology, stroke, cardiac assessment, and complex neurological workups. GE HealthCare received FDA clearance for Photonova Spectra in March 2026, while Philips received FDA clearance for Verida in early 2026, which reinforces commercial momentum behind next-generation CT platforms. These systems support higher clinical value per scan and strengthen the role of CT in fast-moving radiology services market referral pathways.
Ultrasound remains important in the radiology services industry because it supports real-time guidance in interventional settings and fits well with point-of-care workflows. MRI is also evolving as operators respond to helium supply concerns and long-term resilience needs in fleet planning. Siemens Healthineers received FDA clearance in 2025 for Magnetom Flow, and GE HealthCare received clearance in February 2026 for SIGNA Sprint with Freelium, both of which reduce dependence on traditional helium-intensive designs. Mammography and PET or CT are also gaining a larger role in cancer and neurology pathways, which supports a broader modality mix within the radiology services market as referral intensity rises in higher-acuity specialties.


By Service Type: Interventional Radiology Leading a Procedure-Based Revenue Shift
Diagnostic imaging services accounted for 37.38% of the radiology services market size in 2025, while interventional radiology is projected to grow at 22.82% CAGR through 2031. The share leadership of diagnostic imaging reflects its role across almost every routine and advanced clinical workflow, from emergency evaluation to chronic disease monitoring. Growth is stronger in interventional radiology because more procedures are moving from surgical settings into image-guided suites, where providers can offer less invasive care with shorter recovery times. This changes the revenue mix in the radiology services market by increasing the contribution of higher-value, procedure-based work rather than routine scan volumes alone.
CMS reinforced that shift by assigning interventional radiology a positive 2% impact in the 2026 Medicare Physician Fee Schedule while diagnostic imaging categories faced cuts. That payment signal encourages providers to add interventional capacity where referral depth and physician availability can support it. Radiation oncology support services remain smaller in scale, but they are benefiting from closer integration between imaging, targeted therapy planning, and precision treatment workflows. In the radiology services industry, operators with accredited suites, subspecialty physicians, and multi-modality coordination are more likely to capture that shift than general imaging providers with limited procedural capability.
By Service Setting: Freestanding Centres Disrupting Hospital Volume Economics
Hospital-based imaging held 46.16% of the radiology services market share in 2025, but freestanding imaging centers are projected to grow at 18.53% CAGR through 2031. Hospitals still lead because imaging is tightly embedded in acute care, emergency pathways, and specialist referral systems. That position is being challenged as more appropriate studies move into outpatient settings where the same exam can be delivered with lower overhead and better patient convenience. The radiology services market is therefore seeing a more direct contest between hospital-owned outpatient networks and independent center operators than it did a few years ago.
The American Journal of Roentgenology findings cited in 2024 showed that a meaningful share of hospital-based radiology volume could shift into outpatient centers, and provider strategy has increasingly moved in that direction. RadNet’s pace of freestanding center development also showed how quickly scaled operators are adding capacity when reimbursement and payer steering support the move. Community diagnostic centers and mobile imaging units are gaining importance in secondary and underserved markets where fixed-site expansion is slower or less economical. Akumin’s AXIS Drop Trailer, launched in December 2025, reflects how flexible deployment models are becoming part of the radiology services market response to rural access gaps and capital constraints.
By Delivery Model: Teleradiology Networks Redefining Geographic Reach
Owned and operated networks represented 49.12% of the radiology services market size in 2025, while teleradiology-enabled networks are forecast to expand at 20.05% CAGR through 2031. Large owned networks still lead because they control scheduling, equipment deployment, staffing models, and payer relationships across their sites. Teleradiology is growing faster because it allows providers to extend subspecialty reads across a much wider geographic footprint without building a full radiologist base at each location. This makes the radiology services market more scalable for groups that combine distributed reading, strong IT infrastructure, and multi-time-zone staffing.
Cross-border platform growth also points to increasing confidence in remote interpretation at an institutional scale. Everlight Radiology announced a global partnership with Sirona Medical in April 2026 that spans six markets, which shows how widely distributed reading networks can now operate across developed and emerging demand pools. RadNet’s April 2026 joint venture with Saint Alphonsus Health System also shows that hybrid models are becoming more important, where hospitals want partner support rather than full outsourcing. Managed services and outsourcing will likely keep growing in the radiology services market as health systems try to reduce capital ownership while keeping clinical programs active.
By Application: Oncology Anchors Volume, Neurology Commands Growth Premium
Oncology accounted for 34.63% of the radiology services market in 2025, while neurology and spine are expected to grow at 19.85% CAGR through 2031. Oncology leads because patients often move through repeated imaging at diagnosis, staging, treatment assessment, recurrence checks, and long-term surveillance. That sequence creates steady demand across CT, MRI, PET, and nuclear imaging rather than in one modality alone. The radiology services market, therefore, continues to depend heavily on cancer-related imaging volumes as a core utilization base.
Neurology and spine are expanding faster because aging populations are increasing disease burden, while imaging requirements in neurodegenerative care are becoming more frequent and more specialized. New radiopharmaceutical development is also broadening the clinical role of PET in cardiology and neurology, which supports higher-value application growth beyond traditional oncology-heavy use patterns. Women’s health remains a major support category, especially where digital breast tomosynthesis and AI-assisted review tools are being added to high-volume screening networks. Akumin selected Lunit INSIGHT DBT for nationwide deployment in August 2025, which shows how commercial providers are using AI to strengthen breast imaging workflows inside the radiology services market.
By End User: Diagnostic Imaging Centers Outpacing Hospitals on Growth Metrics
Hospitals held 52.81% share in 2025, while diagnostic imaging centers are projected to grow at 21.34% CAGR through 2031. Hospitals remain the largest end-user group because radiology is integrated into inpatient care, emergency services, and advanced specialty treatment. Diagnostic imaging centers are growing faster because they benefit from lower operating costs, more convenient access, and payer support for lower-cost care settings. The radiology services market is unusual in that hospitals are both the largest end-user group and active competitors through their own freestanding network expansion.
Ambulatory centers and clinics are also increasing their use of portable and point-of-care imaging, especially in ultrasound-led workflows. Research and academic institutions play a smaller revenue role, but they still influence which technologies move into commercial use first. SimonMed Imaging partnered with Lunit in December 2025 to deploy a custom AI foundation model for chest X-ray report generation across more than 175 locations, showing how research-linked deployment is moving into operational scale. In the radiology services market, those early deployments can shape adoption patterns well beyond the institutions where the tools first launch.
Geography Analysis
North America accounted for 38.63% of the radiology services market share in 2025, which kept it as the largest regional contributor. The region benefits from high imaging procedure density, deep reimbursement infrastructure, and a large installed base of advanced equipment. The radiology services market in the United States is also seeing more consolidation as national operators expand through acquisitions, joint ventures, and digital health investments. RadNet’s 2026 guidance pointed to 17% to 19% imaging center revenue growth and 46% to 56% digital health revenue growth, which shows how large operators are broadening their business models beyond core scanning services. CMS rules that require faster prior authorization response times for Medicare Advantage from 2026 may also reduce imaging delays and improve throughput in parts of the North American radiology services market.
Europe remains strategically important in the radiology services market because imaging demand is high, but reimbursement systems vary widely across countries. France reported 7.0% growth in imaging expenditure in 2024, even as imaging prices declined 1.0%, which highlights the importance of scale and utilization in maintaining revenue. Germany still anchors market depth in Europe, while pan-European groups continue to balance mature-market optimization with selective expansion into underpenetrated markets. The radiology services market in Europe also faces heavier data and interoperability obligations, which raise compliance costs but can strengthen long-term platform quality for operators that adapt early.
Asia-Pacific is the fastest-growing region in the radiology services market at 20.38% CAGR from 2026 to 2031. Growth is being supported by healthcare infrastructure spending, rising chronic disease incidence, and a continuing shortage of radiologists in several countries. Those conditions make teleradiology and digital workflow tools especially relevant across both developed and emerging Asia-Pacific systems. China is drawing investment into digital radiology infrastructure that improves cloud-based image sharing between hospitals and off-site radiologists. The Middle East and Africa remain smaller in scale, but Gulf markets are supporting premium equipment demand while MRI-heavy providers remain exposed to helium supply volatility. South America offers selective growth potential, with Brazil continuing to account for the largest part of regional demand through private diagnostic center networks and growing middle-income utilization.

Competitive Landscape
The radiology services market remains moderately fragmented at the global level, but it is consolidating faster at the national level in the United States, Australia, and parts of Europe. Large operators are trying to build scale through acquisitions, hospital partnerships, and digital workflow platforms that can support higher throughput across multi-site networks. The radiology services market is therefore becoming more difficult for smaller stand-alone providers that cannot spread staffing, IT, and compliance costs over a broader base. RadNet has been especially active, with acquisitions in Southwest Florida and Indiana in early 2026, followed by the March 2026 acquisition of Gleamer to strengthen its DeepHealth AI platform. That combination of physical network expansion and proprietary software investment is becoming a defining model in the radiology services market.
Hospital joint ventures are another important route to scale because they allow operators to secure referral volume while hospitals keep a local care presence. RadNet’s April 2026 venture with Saint Alphonsus in Boise shows how this model can be used as a template for future regional growth. In Australia, Jardine Matheson agreed in May 2026 to acquire I-MED Radiology Network for AUD 3.4 billion, with a disclosed value of USD 2.4 billion, which signals continued investor confidence in scaled imaging platforms. The radiology services market is therefore attracting both strategic buyers and long-term capital, where operators already hold strong network positions.
Equipment manufacturers are also pushing deeper into the service layer through managed services, AI subscriptions, and broader workflow offerings. GE HealthCare, Siemens Healthineers, and Philips already have strong equipment relationships with providers, which gives them a natural channel to expand bundled support models. This creates a more complex competitive structure in the radiology services market because service operators now compete not only with peers, but also with technology vendors that influence equipment, software, and maintenance decisions at the same time. White-space opportunities still remain in rural mobile imaging, community teleradiology coverage, and subspecialty support for interventional and nuclear medicine workflows. Providers that move early in those areas can still build local advantages before the radiology services market becomes more tightly consolidated.
Radiology Services Industry Leaders
GE HealthCare Technologies Inc.
Koninklijke Philips N.V.
Fujifilm Holdings Corporation
Siemens Healthineers AG
Unilabs
- *Disclaimer: Major Players sorted in no particular order

Recent Industry Developments
- May 2026: Jardine Matheson Holdings agreed to acquire I-MED Radiology Network, Australia's largest diagnostic imaging provider operating 215 clinics, for AUD 3.4 billion (USD 2.4 billion) from private equity firm Permira, signalling institutional investor conviction in the structural growth of networked diagnostic imaging.
- April 2026: RadNet formed a joint venture with Trinity Health's Saint Alphonsus Health System, acquiring a majority equity stake in Intermountain Medical Imaging across five outpatient centers in Boise, Idaho, and the venture is projected to generate USD 30 million in annual revenue.
- March 2026: RadNet acquired Gleamer SAS, a Paris-based radiology AI company, integrating it into DeepHealth to become the largest provider of radiology clinical AI solutions globally.
- March 2026: GE HealthCare received FDA 510(k) clearance for Photonova Spectra, its photon-counting CT system powered by Deep Silicon detector technology, offering wide-coverage ultra-high-definition spatial and spectral imaging across clinical applications.


Global Radiology Services Market Report Scope
The radiology services market refers to the global industry providing diagnostic imaging and related services such as X-rays, CT scans, MRI, ultrasound, and nuclear medicine. It encompasses hospital-based, outpatient, and tele-radiology services, driven by rising demand for early disease detection, technological advancements, and the expansion of healthcare infrastructure.
The market is segmented by modality, which includes X-ray, computed tomography (CT), magnetic resonance imaging (MRI), ultrasound, nuclear imaging, mammography, positron emission tomography (PET), and other modalities. By service type, it covers diagnostic imaging, interventional radiology, and radiation oncology support services. By service setting, the market spans hospital-based imaging, freestanding imaging centers, community diagnostic centers, and mobile imaging units. By delivery model, it includes owned and operated networks, teleradiology-enabled networks, hospital joint ventures, and managed services or outsourcing. By application, radiology services are applied in oncology, neurology and spine, cardiology, orthopedics and musculoskeletal, chest and pulmonary imaging, women’s health and obstetrics, and general imaging. By end user, the market serves hospitals, diagnostic imaging centers, ambulatory centers, clinics, and research or academic institutions.
By geography, it is divided into North America (United States, Canada, Mexico), Europe (Germany, United Kingdom, France, Italy, Spain, Rest of Europe), Asia-Pacific (China, Japan, India, Australia, South Korea, Rest of Asia-Pacific), Middle East & Africa (GCC, South Africa, Rest of Middle East & Africa), and South America (Brazil, Argentina, Rest of South America).
| X-Ray |
| Computed Tomography |
| Magnetic Resonance Imaging |
| Ultrasound |
| Nuclear Imaging |
| Mammography |
| Positron Emission Tomography |
| Other Modalities |
| Diagnostic Imaging |
| Interventional Radiology |
| Radiation Oncology Support Services |
| Hospital-Based Imaging |
| Freestanding Imaging Centers |
| Community Diagnostic Centers |
| Mobile Imaging Units |
| Owned and Operated Networks |
| Teleradiology-Enabled Networks |
| Hospital Joint Ventures |
| Managed Services and Outsourcing |
| Oncology |
| Neurology and Spine |
| Cardiology |
| Orthopedics and Musculoskeletal |
| Chest and Pulmonary Imaging |
| Women's Health and Obstetrics |
| General Imaging |
| Hospitals |
| Diagnostic Imaging Centers |
| Ambulatory Centers |
| Clinics |
| Research and Academic Institutions |
| North America | United States |
| Canada | |
| Mexico | |
| Europe | Germany |
| United Kingdom | |
| France | |
| Italy | |
| Spain | |
| Rest of Europe | |
| Asia-Pacific | China |
| Japan | |
| India | |
| Australia | |
| South Korea | |
| Rest of Asia-Pacific | |
| Middle East & Africa | GCC |
| South Africa | |
| Rest of Middle East & Africa | |
| South America | Brazil |
| Argentina | |
| Rest of South America |
| By Modality | X-Ray | |
| Computed Tomography | ||
| Magnetic Resonance Imaging | ||
| Ultrasound | ||
| Nuclear Imaging | ||
| Mammography | ||
| Positron Emission Tomography | ||
| Other Modalities | ||
| By Service Type | Diagnostic Imaging | |
| Interventional Radiology | ||
| Radiation Oncology Support Services | ||
| By Service Setting | Hospital-Based Imaging | |
| Freestanding Imaging Centers | ||
| Community Diagnostic Centers | ||
| Mobile Imaging Units | ||
| By Delivery Model | Owned and Operated Networks | |
| Teleradiology-Enabled Networks | ||
| Hospital Joint Ventures | ||
| Managed Services and Outsourcing | ||
| By Application | Oncology | |
| Neurology and Spine | ||
| Cardiology | ||
| Orthopedics and Musculoskeletal | ||
| Chest and Pulmonary Imaging | ||
| Women's Health and Obstetrics | ||
| General Imaging | ||
| By End User | Hospitals | |
| Diagnostic Imaging Centers | ||
| Ambulatory Centers | ||
| Clinics | ||
| Research and Academic Institutions | ||
| By Geography | North America | United States |
| Canada | ||
| Mexico | ||
| Europe | Germany | |
| United Kingdom | ||
| France | ||
| Italy | ||
| Spain | ||
| Rest of Europe | ||
| Asia-Pacific | China | |
| Japan | ||
| India | ||
| Australia | ||
| South Korea | ||
| Rest of Asia-Pacific | ||
| Middle East & Africa | GCC | |
| South Africa | ||
| Rest of Middle East & Africa | ||
| South America | Brazil | |
| Argentina | ||
| Rest of South America | ||


Key Questions Answered in the Report
What is the 2031 value forecast for radiology services?
The sector is projected to reach USD 8.18 billion by 2031, up from USD 3.64 billion in 2026, at a 17.59% CAGR.
Which modality is growing the fastest through 2031?
Computed tomography is projected to record the fastest modality growth at 19.24% CAGR, supported by newer photon-counting and spectral CT platforms.
Why are freestanding imaging centers gaining ground?
Freestanding centers are growing at 18.53% CAGR because they offer lower-cost delivery, better scheduling convenience, and strong alignment with payer site-of-care preferences.
Which application area generates the most demand?
Oncology led with 34.63% of revenue in 2025 because cancer care requires repeated imaging across diagnosis, treatment response, and surveillance.
What is driving rapid growth in diagnostic imaging centers?
Diagnostic imaging centers are projected to grow at 21.34% CAGR as volume shifts away from hospitals and patients seek easier access and faster scheduling.
Which region is expanding the fastest?
Asia-Pacific is forecast to grow at 20.38% CAGR through 2031, supported by infrastructure investment, rising chronic disease incidence, and radiologist shortages that favor teleradiology.
Page last updated on:


