
Diagnostic Imaging Services Market Size and Share
Market Overview
| Study Period | 2020 - 2031 |
|---|---|
| Market Size (2026) | USD 624.82 Billion |
| Market Size (2031) | USD 822.44 Billion |
| Growth Rate (2026 - 2031) | 5.65 % |
| Fastest Growing Market | Asia-Pacific |
| Largest Market | North America |
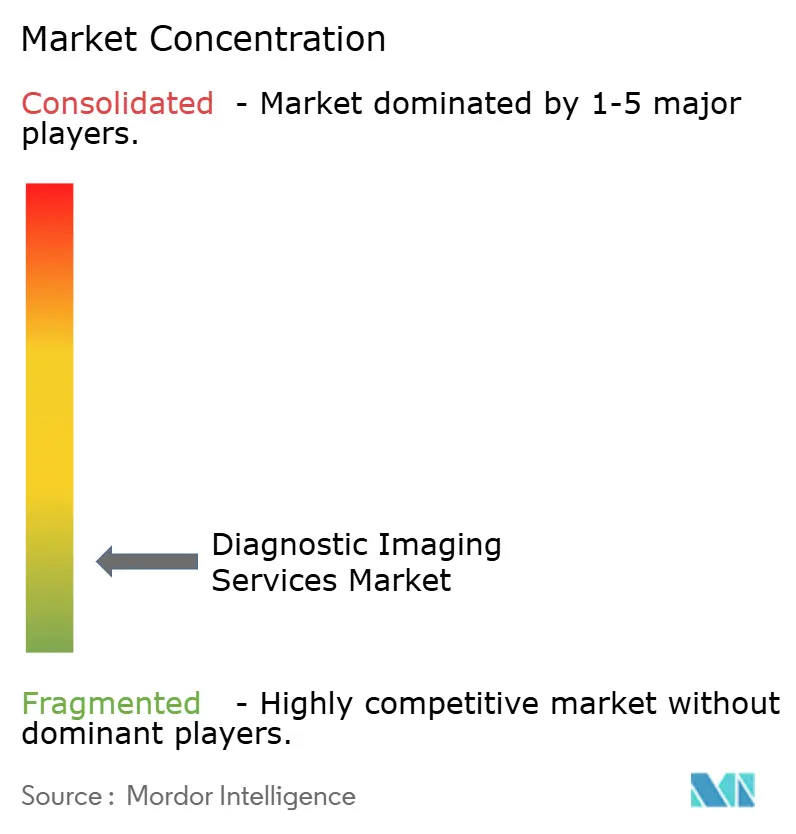
| Market Concentration | Low |
Major Players *Disclaimer: Major Players sorted in no particular order Image © Mordor Intelligence. Reuse requires attribution under CC BY 4.0. | |
Diagnostic Imaging Services Market Analysis by Mordor Intelligence
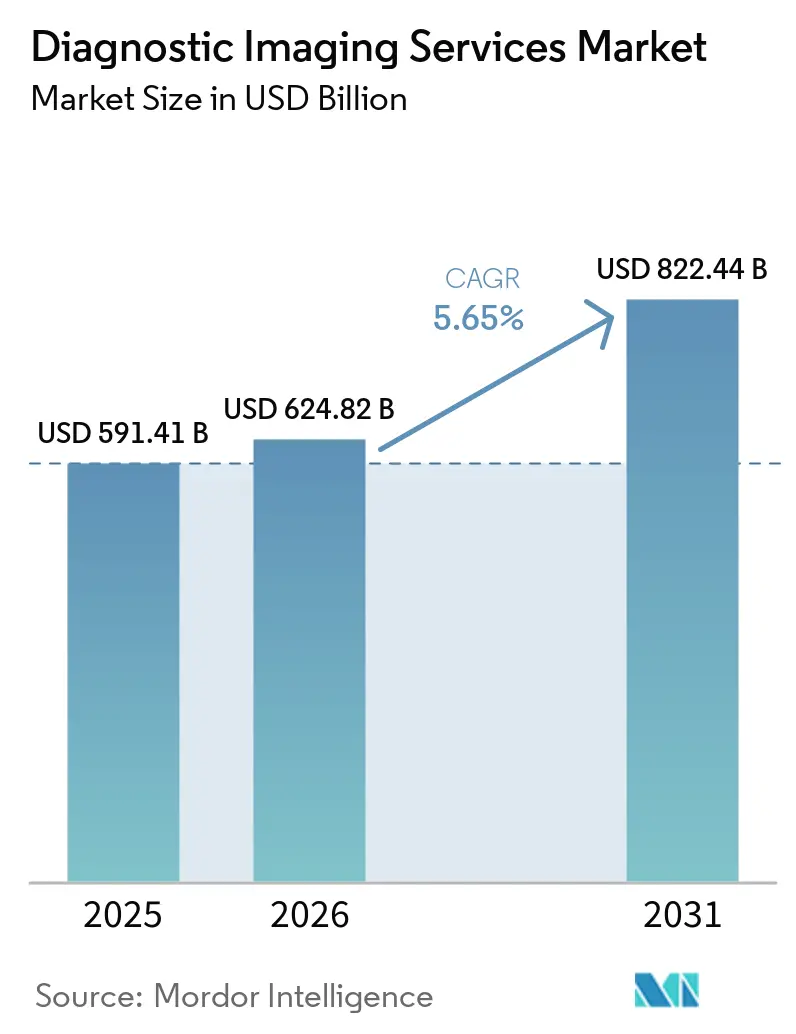
The Diagnostic Imaging Services Market size is projected to be USD 591.41 billion in 2025, USD 624.82 billion in 2026, and reach USD 822.44 billion by 2031, growing at a CAGR of 5.65% from 2026 to 2031.
Demand remains durable because imaging use rises with age, cancer pathways require repeated scanning, and older patients tend to present with multiple conditions that increase total study volumes. The move toward outpatient and ambulatory settings is also changing how capacity is added, because stand-alone centers and community-based models run on different staffing, referral, and equipment economics than hospital departments. AI-enabled workflow is becoming a practical capacity tool rather than an optional add-on, which is important for the diagnostic imaging services market as providers try to handle more studies with limited specialist labor. North America held the largest revenue base in 2025, while Asia-Pacific is set to grow faster as infrastructure investment, equipment rollout, and service access expand across large health systems in the diagnostic imaging services market. Competitive conditions remain moderate to high because scaled networks are using acquisitions, software-led productivity, and partnership models to widen the gap with smaller operators across the diagnostic imaging services market.
Key Report Takeaways
- By modality, X-ray led with 28.5% revenue share in 2025, while computed tomography is forecast to expand at a 6.4% CAGR through 2031.
- By application, oncology accounted for 32.2% of revenue in 2025, while neurology and spine is projected to record the highest CAGR at 7.5% through 2031.
- By service setting, hospital-based imaging departments held 45.3% of revenue in 2025, while freestanding imaging centers are expected to grow fastest at a 6.3% CAGR through 2031.
- By delivery model, owned and operated networks held 46.1% of revenue in 2025, while teleradiology-enabled networks are projected to advance at a 9.3% CAGR through 2031.
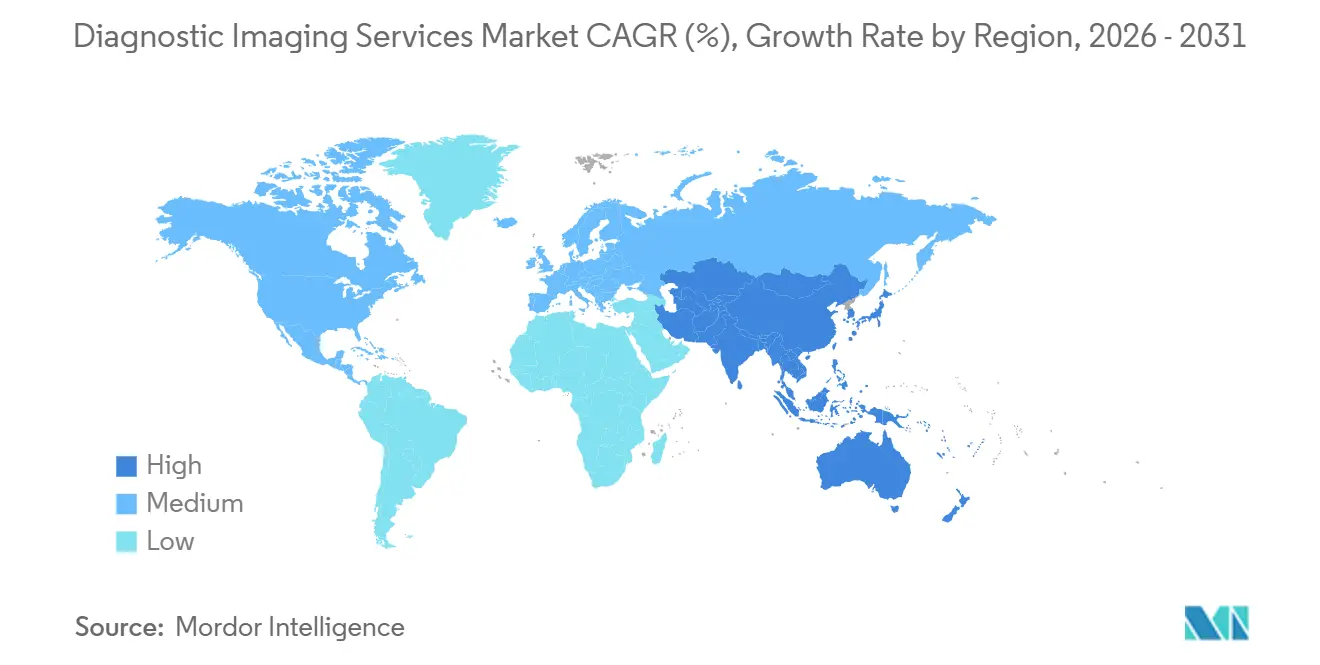
- By geography, North America held 39.2% of global revenue in 2025, while Asia-Pacific is forecast to expand at a 6.8% CAGR through 2031.
Note: Market size and forecast figures in this report are generated using Mordor Intelligence’s proprietary estimation framework, updated with the latest available data and insights as of January 2026.
Market Trends and Insights
Drivers Impact Analysis of Diagnostic Imaging Services Market*
| Driver | (~) % Impact on CAGR Forecast | Geographic Relevance | Impact Timeline |
|---|---|---|---|
| Aging chronic-disease imaging volumes | +1.5% | Global, concentrated in North America, Western Europe, and Japan | Long term (≥ 4 years) |
| Screening-led early diagnosis demand | +0.8% | North America, Europe, with spill-over to urban APAC and GCC | Medium term (2-4 years) |
| AI-enabled workflow and scan productivity | +1.0% | Global, early gains in North America and Western Europe | Short term (≤ 2 years) |
| Outpatient imaging migration | +0.7% | North America and EU, with early gains in Australia and GCC | Medium term (2-4 years) |
| Remote contrast supervision expansion | +0.5% | North America, with spill-over to UK and Australia | Short term (≤ 2 years) to Medium term (2-4 years) |
| Theranostics-led PET-CT mix upgrade | +0.6% | North America, Western Europe, Japan | Medium term (2-4 years) to Long term (≥ 4 years) |
| Source: Mordor Intelligence | |||
Aging Chronic-Disease Imaging Volumes
The demographic case for sustained imaging demand remains unusually strong. A February 2025 projection published in the Journal of the American College of Radiology showed that the 85 to 94 age cohort in the United States is expected to grow by 149.6% by 2055, while the population aged 95 and above is projected to grow by 282.1%[1]Eric W. Christensen, Jay R. Parikh, Alexandra R. Drake, Eric M. Rubin, and Elizabeth Y. Rula, “Projected US Radiologist Supply, 2025 to 2055,” Journal of the American College of Radiology, jacr.org. Older adults also consume imaging at structurally higher rates than younger populations, which means demand growth is linked to age mix rather than only headline population growth. Multimorbidity strengthens that effect because diabetes, cardiovascular disease, cancer, and musculoskeletal degeneration often appear in the same patient and generate multiple imaging episodes over time. This makes aging one of the most durable demand supports in the diagnostic imaging services market, especially for providers with broad CT, MRI, and general imaging coverage.
Screening-Led Early Diagnosis Demand
Early diagnosis pathways continue to increase the need for repeated imaging across several service lines. In oncology, imaging no longer sits only at the first diagnosis, because modern care pathways also require staging, treatment selection, therapy monitoring, and recurrence follow-up. That pattern is becoming more pronounced in radiotheranostics, where paired diagnostic scans are tied directly to treatment decisions and post-therapy assessment. The result is a larger recurring scan base rather than a one-time study profile, which lifts utilization even when scanner growth is gradual. This repeated-use pattern is adding steadier volume to the diagnostic imaging services market because it connects imaging demand to ongoing clinical protocols rather than isolated acute events.
AI-Enabled Workflow and Scan Productivity
AI is improving throughput in a way that helps providers stretch limited staffing capacity. RadNet reported that its DeepHealth subsidiary recorded a 41.1% revenue increase in 2025, showing that software and workflow tools are moving into a more material part of the operating model. The company also stated in May 2026 that more than 70% of its studies could run through clinical AI by the end of 2026, which points to a broad effort to embed automation inside routine imaging workflows. AI can support faster triage, better protocol consistency, and shorter turnaround times, which matters most where radiologist and technologist capacity is already tight. For the diagnostic imaging services market, this shifts AI from a feature discussion into a productivity discussion that directly affects margins and service availability.
Outpatient Imaging Migration
Imaging volume continues to move toward outpatient settings as providers look for lower-cost access points and more flexible scheduling. RadNet expanded that footprint further in 2026 with acquisitions in Southwest Florida and Indiana, showing that established operators still see room to add local outpatient density. HCA Healthcare also reported a network of approximately 2,500 ambulatory facilities in 2025, which shows how large health systems are maintaining substantial non-inpatient capacity alongside hospitals. In the UK, a late-night remote MRI pilot by Philips and Imperial College Healthcare NHS Trust added capacity for 1,356 additional patients over six months, illustrating how nontraditional operating models can widen access outside standard hospital scheduling. This migration is changing referral capture, scanner placement, and workforce deployment across the diagnostic imaging services market.
Restraints Impact Analysis of Diagnostic Imaging Services Market*
| Restraint | (~) % Impact on CAGR Forecast | Geographic Relevance | Impact Timeline |
|---|---|---|---|
| Radiologist and technologist shortages | -0.7% | Global, most acute in North America and Western Europe | Long term (≥ 4 years) |
| Reimbursement and margin pressure | -0.6% | North America, with spill-over to Western Europe | Medium term (2-4 years) |
| Prior-authorization friction in advanced imaging | -0.4% | North America, Medicare Advantage and commercial payers | Short term (≤ 2 years) to Medium term (2-4 years) |
| Isotope and imported-equipment input volatility | -0.5% | Global, with immediate impact on nuclear imaging operators | Short term (≤ 2 years) to Medium term (2-4 years) |
| Source: Mordor Intelligence | |||
Radiologist and Technologist Shortages
The imaging labor gap now looks structural rather than temporary. A February 2025 study projected that imaging utilization could rise by 17% to 27% over the next 30 years while radiologist supply growth remains constrained, creating a persistent mismatch between demand and reading capacity. The same research noted that post-COVID attrition among radiologists rose to 3%, and if that pattern persists the workforce could be 3,116 radiologists smaller by 2055 than under historical attrition assumptions. The training pipeline is not closing that gap quickly, and the American Journal of Neuroradiology warned in 2025 that job growth is running ahead of radiology training capacity. This keeps a hard ceiling on service expansion in the diagnostic imaging services market, even when scanner access and software tools improve.
Reimbursement and Margin Pressure
Payment pressure continues to compress economics for imaging providers. The 2026 Medicare Physician Fee Schedule final rule introduced a 2.5% efficiency adjustment applied to image interpretation services, reinforcing the need for higher throughput and tighter cost control[2]Centers for Medicare & Medicaid Services, “Medicare and Medicaid Programs, CY 2026 Payment Policies Under the Physician Fee Schedule,” Federal Register, federalregister.gov. When reimbursement growth slows, providers with heavier exposure to public payer mix have less room to absorb wage inflation, equipment costs, and compliance overhead. Larger operators are responding by widening their outpatient presence, adding software, and extending partnership structures that can stabilize referral flow and utilization. As a result, reimbursement pressure is widening the performance gap between scaled and subscale providers in the diagnostic imaging services market.
*Our forecasts treat driver/restraint impacts as directional, not additive. The impact forecasts reflect baseline growth, mix effects, and variable interactions.
Diagnostic Imaging Services Market Segment Analysis
By Modality:
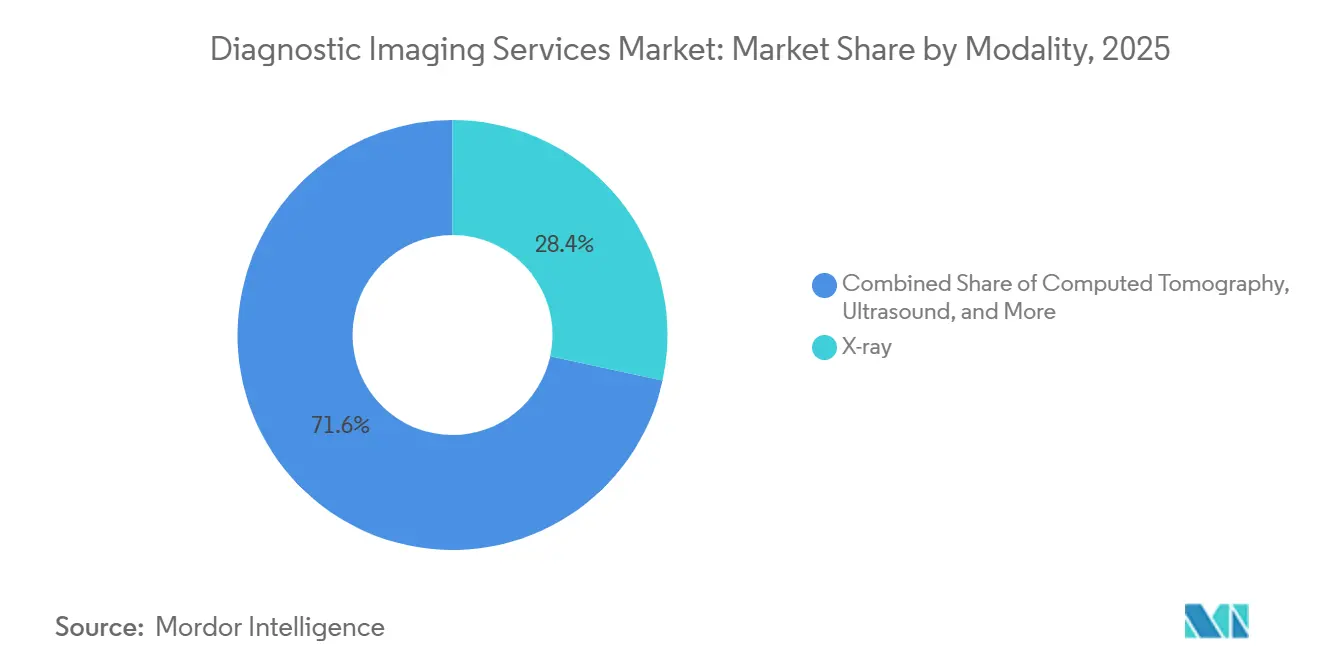
CT Growth Reshapes the Scanner EstateX-ray held 28.5% of the diagnostic imaging services market share in 2025, while computed tomography is projected to record the fastest 6.4% CAGR through 2031. X-ray remained the largest modality because it stays essential in emergency medicine, primary care, orthopedics, and high-throughput routine diagnostics where quick access matters. CT is expanding faster because oncology staging, trauma assessment, and cardiac evaluation rely on detailed cross-sectional imaging that standard radiography cannot replace. AI-supported workflow is also making advanced scanners more productive, which strengthens the role of CT inside the diagnostic imaging services market.
MRI and ultrasound continue to anchor broad chronic and routine diagnostic demand across the diagnostic imaging services industry. Nuclear imaging remains smaller in base, but its strategic importance is rising because radiotheranostic care ties diagnostic PET activity more directly to treatment selection and follow-up. Mammography also remains a core part of women's imaging service lines because screening and follow-up studies still generate large recurring volumes even when growth is steadier than CT. The modality mix therefore favors operators that can balance high-volume conventional imaging with selected investment in premium scanners across the diagnostic imaging services market.



By Application:
Neurology Overtakes Legacy Segments in GrowthOncology accounted for 32.2% of the diagnostic imaging services market size in 2025, giving it the largest application base, while neurology and spine is projected to grow at 7.5% CAGR through 2031. Oncology leads because imaging is involved across screening, diagnosis, staging, treatment planning, and response assessment. The use of radiotheranostic pathways strengthens this position because many patients need imaging before therapy and again during follow-up, which creates repeat demand instead of a single diagnostic event. This makes oncology one of the most dependable recurring revenue pools in the diagnostic imaging services market.
Neurology and spine is expanding faster because tracer-based brain imaging and advanced neurodiagnostic workups are widening the need for repeated studies in complex disease management. Cardiac imaging is also supporting growth as CT-based assessment becomes more embedded in advanced cardiovascular evaluation. Orthopedics, women's health, and general imaging provide stable baseline volume that keeps service portfolios diversified across the diagnostic imaging services industry. The application mix therefore combines a large oncology base with rising specialty demand that helps premium imaging systems achieve stronger utilization in the diagnostic imaging services market.
By Service Setting:
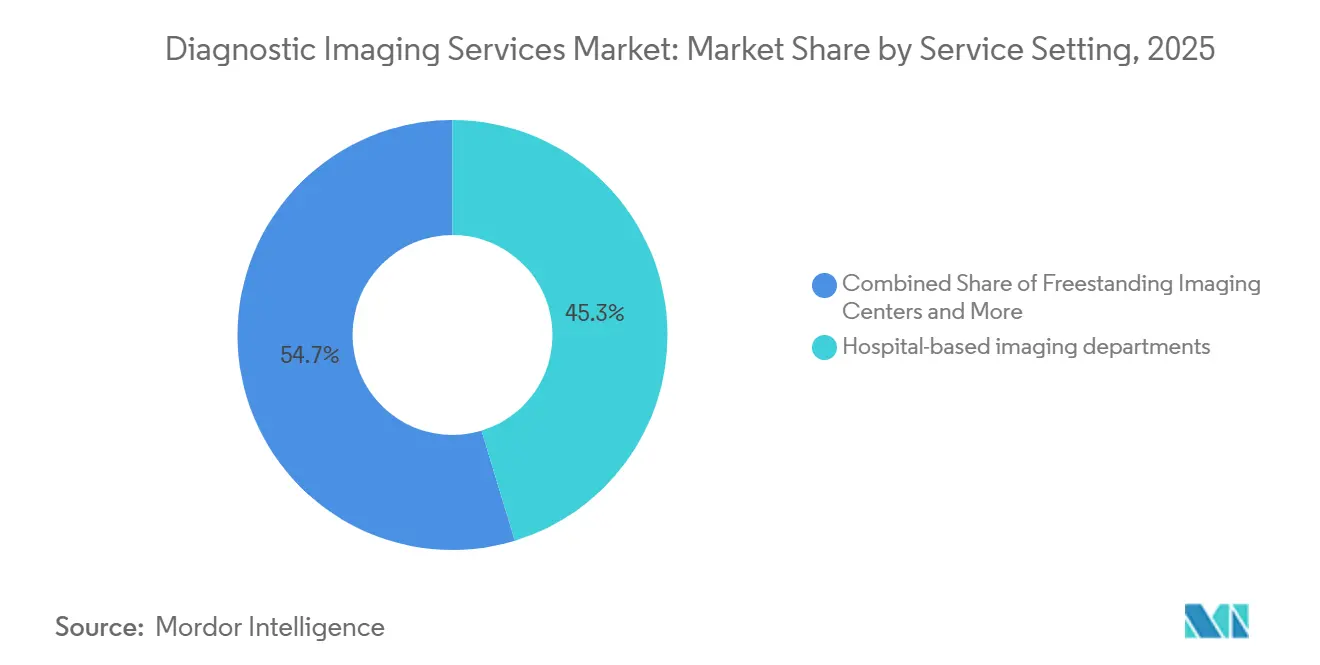
Freestanding Centers Gain Against Hospital DepartmentsHospital-based imaging departments held 45.3% share in 2025, while freestanding imaging centers are projected to expand at 6.3% CAGR through 2031. Hospitals keep the largest position because they handle emergency work, inpatient demand, and higher-acuity referrals that many community sites cannot fully absorb. Freestanding centers are still taking incremental share because they offer a more convenient outpatient route for many routine and advanced studies. As this shift continues, local network density and referral capture matter more across the diagnostic imaging services market.
Community diagnostic centers and polyclinic-style hubs are emerging as a middle layer between the hospital model and pure-play outpatient centers. In the UK, the Philips and Imperial College Healthcare NHS Trust pilot showed that late-night remote MRI scanning added 1,356 patients over six months and cut the did-not-attend rate to 1.1% versus a typical 5% to 7%. Mobile imaging units also remain useful where rural demand or temporary overflow does not justify permanent site build-out. The service setting mix is broadening, but execution still depends on staffing depth, scheduling flexibility, and local demand concentration in the diagnostic imaging services market.
By Delivery Model:
Teleradiology Closes the Workforce GapOwned and operated networks held 46.1% of the diagnostic imaging services market size in 2025, while teleradiology-enabled networks are projected to grow at 9.3% CAGR through 2031. Direct ownership remains the largest format because it offers full control over scheduling, patient experience, branding, and economics. Teleradiology is growing faster because it expands reading capacity across sites without requiring the same increase in local headcount. That makes remote interpretation one of the clearest labor responses in the diagnostic imaging services market.
Hospital joint ventures sit between pure ownership and outsourced reading by combining outpatient economics with health system referral flow. RadNet disclosed that 36.1% of its centers were in health system partnerships at the end of 2025, which shows how important this structure has become for network expansion. Managed services and outsourcing also help smaller hospitals maintain specialist coverage when full in-house staffing is not practical. Across delivery models, the strongest operators are building hybrid networks that combine physical centers, remote reading, and software-based workflow inside the diagnostic imaging services market.
Geography Analysis
North America Diagnostic Imaging Services Market
North America accounted for 39.2% of the diagnostic imaging services market share in 2025. The United States drives most of that base because advanced modalities are widely used and outpatient imaging networks are well developed. RadNet reported USD 2.04 billion in revenue in 2025, up 11.5% from the prior year, which shows continued scale expansion by large imaging operators. HCA Healthcare also reported USD 75.6 billion in revenue for 2025 and operated diagnostic and imaging centers within a network of approximately 2,500 ambulatory facilities. The 2026 Physician Fee Schedule adds pressure through a 2.5% efficiency adjustment on image interpretation services, which keeps productivity and scale central in this part of the diagnostic imaging services market.
Europe Diagnostic Imaging Services Market
Europe remains the second-largest regional cluster in the diagnostic imaging services market. NHS England processed 4.03 million imaging procedures in January 2025, and MRI recorded a median wait of 23 days between request and examination. This backlog is pushing providers toward remote and extended-hours operating models that can add capacity without full hospital expansion. Affidea widened its European footprint through the October 2024 acquisition of Nu-Med Group in Poland and the February 2025 acquisition of histopathology laboratories in Switzerland, which tightened its position along the oncology diagnostics pathway.
APAC, Middle East and South America Diagnostic Imaging Services Market
Asia-Pacific is projected to grow at 6.8% CAGR through 2031, giving the diagnostic imaging services market size a faster expansion profile there than in more mature Western regions. China remains the largest revenue base in the region, and United Imaging stated in early 2025 that its products were deployed across 14,000 hospitals in more than 75 countries. The Middle East is also becoming more strategic, with Burjeel Holdings acquiring an 80% stake in Advanced Care Oncology Center for AED 92 million, or USD 25 million, in February 2025 to expand radiation oncology capacity in the GCC. South America remains smaller in absolute terms, but urban private providers and public access programs continue to support steady diagnostic demand. Across these regions, infrastructure build-out, equipment rollout, and access to specialist reading capacity will shape the next phase of the diagnostic imaging services market.

Competitive Landscape
The diagnostic imaging services market is fragmented, with a small group of scaled networks competing alongside a long tail of regional operators and independent centers. This structure keeps pricing power uneven and makes local density, referral access, staffing depth, and payer relationships more important than global brand alone. RadNet was notably active in 2026, expanding in Southwest Florida in January and entering Indiana in February through outpatient imaging acquisitions. Affidea also continued to widen its position through acquisitions in Poland and Switzerland that linked imaging more closely with adjacent oncology diagnostics. These moves show that consolidation is still happening market by market across the diagnostic imaging services market.
Technology is becoming a sharper competitive divider in the diagnostic imaging services market. RadNet reported strong expansion in DeepHealth during 2025 and said clinical AI could cover more than 70% of its studies by the end of 2026. SimonMed reinforced the same direction in April 2026 by deploying AIRS Medical's SwiftMR platform across its network to reduce MRI scan times and improve image quality without additional hardware. Operators that embed AI across scheduling, acquisition, and interpretation can create faster turnaround and better labor productivity than peers that depend only on scanner count.
Partnership structures are also reshaping competition in the diagnostic imaging services market. RadNet disclosed that 36.1% of its centers were in health system partnerships at the end of 2025, which shows that joint ventures have become a meaningful route to outpatient growth. This model helps health systems preserve referral flow while giving specialist operators access to patient volume, local credibility, and staffing support. At the same time, the large number of smaller providers means consolidation can continue without quickly removing local competition. The main competitive divide is therefore the ability to combine site growth, partnership access, and workflow productivity inside the diagnostic imaging services market.
Diagnostic Imaging Services Industry Leaders
RadNet
Unilabs
Alliance Medical Group
I-MED Radiology Network
Sonic Healthcare Australia - Radiology
- *Disclaimer: Major Players sorted in no particular order
Diagnostic Imaging Services Market Companies Covered in this Report
- Affidea
- Akumin
- Alliance Medical Group
- Apollo Hospitals
- Capitol Health / Capital Radiology
- CommonSpirit Health
- HCA Healthcare
- I-MED Radiology Network
- InHealth Group
- Lumus Imaging
- MedQuest Imaging
- Novant Health
- RadNet
- Ramsay Health Care
- RAYUS Radiology
- SimonMed Imaging
- Sonic Healthcare Australia - Radiology
- Spire Healthcare
- Unilabs

Recent Industry Developments in Diagnostic Imaging Services Market
- April 2026: RadNet and Trinity Health's Saint Alphonsus Health System launched a multi-site joint venture in Boise, Idaho, deploying RadNet's DeepHealth OS AI platform across five outpatient imaging centers. The partnership also included an expanded GE HealthCare mammography collaboration for global access to AI-powered breast cancer screening.
- April 2026: SimonMed Imaging deployed AIRS Medical's SwiftMR, an FDA-cleared AI MRI enhancement platform, enterprise-wide across its 170+ center network, with the aim of reducing scan times and improving image quality without additional hardware investment.
- February 2026: RadNet acquired 6 outpatient imaging centers in Indianapolis from Northwest Radiology Network for USD 9 million, marking its entry into the Midwest and adding an estimated USD 18 million in annualized revenue.


Global Diagnostic Imaging Services Market Report Scope
As per the scope of the report, diagnostic imaging services refer to medical procedures that utilize various imaging technologies to create visual representations of the interior of the body. These services assist healthcare providers in diagnosing, monitoring, and sometimes treating medical conditions.
The diagnostic imaging services market is segmented by modality into x-ray imaging, computed tomography scans, magnetic resonance imaging, ultrasound imaging, nuclear imaging techniques, and mammography procedures. By application, the market is categorized into oncological imaging, cardiac imaging, neurological and spinal imaging, orthopedic and musculoskeletal imaging, women's health and obstetric imaging, and general imaging procedures. By service setting, the segmentation includes hospital imaging departments, independent imaging centers, community diagnostic centers and polyclinics, and mobile imaging services. By delivery model, the market is divided into owned imaging networks, joint ventures with hospitals, outsourced managed services, and teleradiology networks. Geographically, the market is analyzed across the North American region, European region, Asia-Pacific region, Middle Eastern and African region, and South American region. The market report also covers the estimated market sizes and trends for 17 countries across major regions globally. For each segment, the market size and forecast are provided in terms of value (USD).
| X-ray |
| Computed Tomography |
| Magnetic Resonance Imaging |
| Ultrasound |
| Nuclear Imaging |
| Mammography |
| Oncology |
| Cardiology |
| Neurology and Spine |
| Orthopedics and Musculoskeletal |
| Women's Health and Obstetrics |
| General Imaging |
| Hospital-based Imaging Departments |
| Freestanding Imaging Centers |
| Community Diagnostic Centres and Polyclinic Hubs |
| Mobile Imaging Units |
| Owned and Operated Networks |
| Hospital Joint Ventures |
| Managed Services and Outsourcing Contracts |
| Teleradiology-enabled Networks |
| North America | United States |
| Canada | |
| Mexico | |
| Europe | Germany |
| United Kingdom | |
| France | |
| Italy | |
| Spain | |
| Rest of Europe | |
| Asia-Pacific | China |
| India | |
| Japan | |
| South Korea | |
| Australia | |
| Rest of Asia-Pacific | |
| Middle East and Africa | GCC |
| South Africa | |
| Rest of Middle East and Africa | |
| South America | Brazil |
| Argentina | |
| Rest of South America |
| By Modality | X-ray | |
| Computed Tomography | ||
| Magnetic Resonance Imaging | ||
| Ultrasound | ||
| Nuclear Imaging | ||
| Mammography | ||
| By Application | Oncology | |
| Cardiology | ||
| Neurology and Spine | ||
| Orthopedics and Musculoskeletal | ||
| Women's Health and Obstetrics | ||
| General Imaging | ||
| By Service Setting | Hospital-based Imaging Departments | |
| Freestanding Imaging Centers | ||
| Community Diagnostic Centres and Polyclinic Hubs | ||
| Mobile Imaging Units | ||
| By Delivery Model | Owned and Operated Networks | |
| Hospital Joint Ventures | ||
| Managed Services and Outsourcing Contracts | ||
| Teleradiology-enabled Networks | ||
| By Geography | North America | United States |
| Canada | ||
| Mexico | ||
| Europe | Germany | |
| United Kingdom | ||
| France | ||
| Italy | ||
| Spain | ||
| Rest of Europe | ||
| Asia-Pacific | China | |
| India | ||
| Japan | ||
| South Korea | ||
| Australia | ||
| Rest of Asia-Pacific | ||
| Middle East and Africa | GCC | |
| South Africa | ||
| Rest of Middle East and Africa | ||
| South America | Brazil | |
| Argentina | ||
| Rest of South America | ||


Key Questions Answered in the Report
What is the projected value of diagnostic imaging services by 2031?
The diagnostic imaging services market is projected to reach USD 822.44 billion by 2031, rising from USD 624.82 billion in 2026 at a 5.65% CAGR over 2026 to 2031.
Which modality is leading, and which one is growing fastest?
X-ray held the largest revenue share at 28.5% in 2025, while computed tomography is expected to grow fastest at a 6.4% CAGR through 2031.
Why is oncology such an important revenue contributor for imaging providers?
Oncology held 32.2% of application revenue in 2025 because imaging is used across screening, diagnosis, staging, treatment planning, and follow-up, with newer theranostic pathways adding more repeat scans.
What is driving faster growth in freestanding imaging centers?
Freestanding centers are projected to grow at 6.3% CAGR through 2031 because outpatient care models, access convenience, and lower-cost delivery are supporting steady migration away from hospital-heavy settings.
Which region is expanding the fastest?
Asia-Pacific is forecast to post the highest regional CAGR at 6.8% through 2031 as infrastructure investment and equipment deployment expand across large healthcare systems.
How are leading providers responding to labor shortages and margin pressure?
Larger operators are using AI workflow tools, outpatient acquisitions, and health system partnerships to increase productivity and protect utilization, as seen in RadNet's acquisition activity and SimonMed's SwiftMR rollout.
Page last updated on:





