Hospital Services Market Size and Share
Market Overview
| Study Period | 2019 - 2030 |
|---|---|
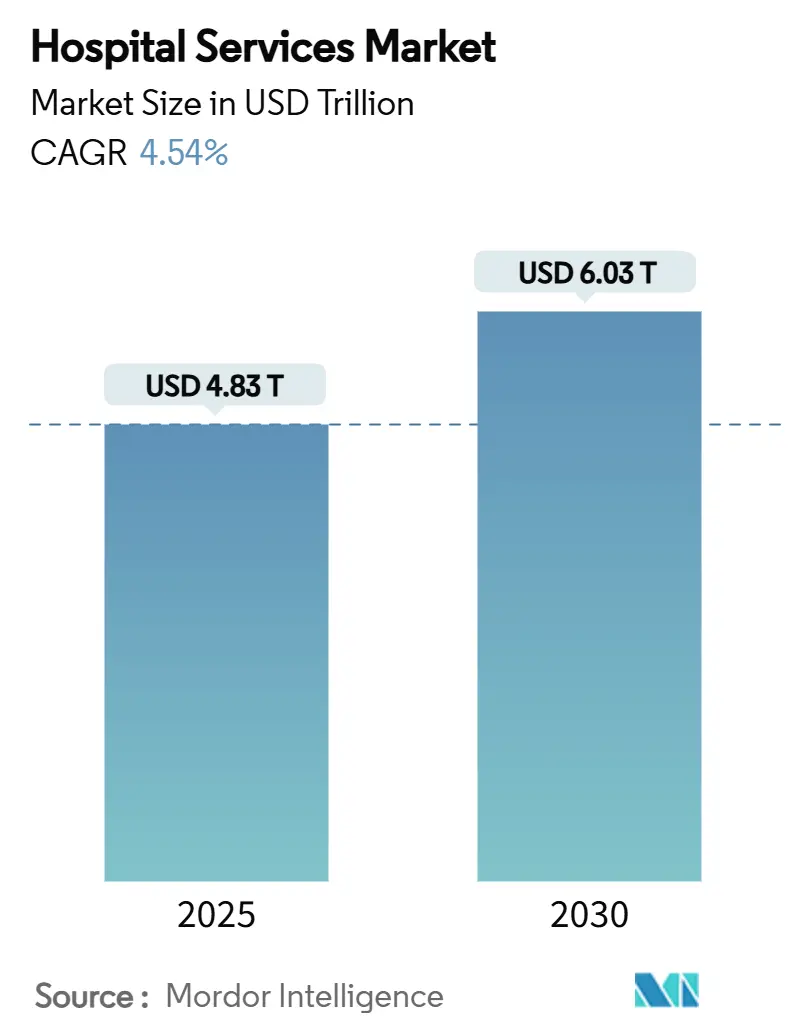
| Market Size (2025) | USD 4.83 Trillion |
| Market Size (2030) | USD 6.03 Trillion |
| Growth Rate (2025 - 2030) | 4.54% CAGR |
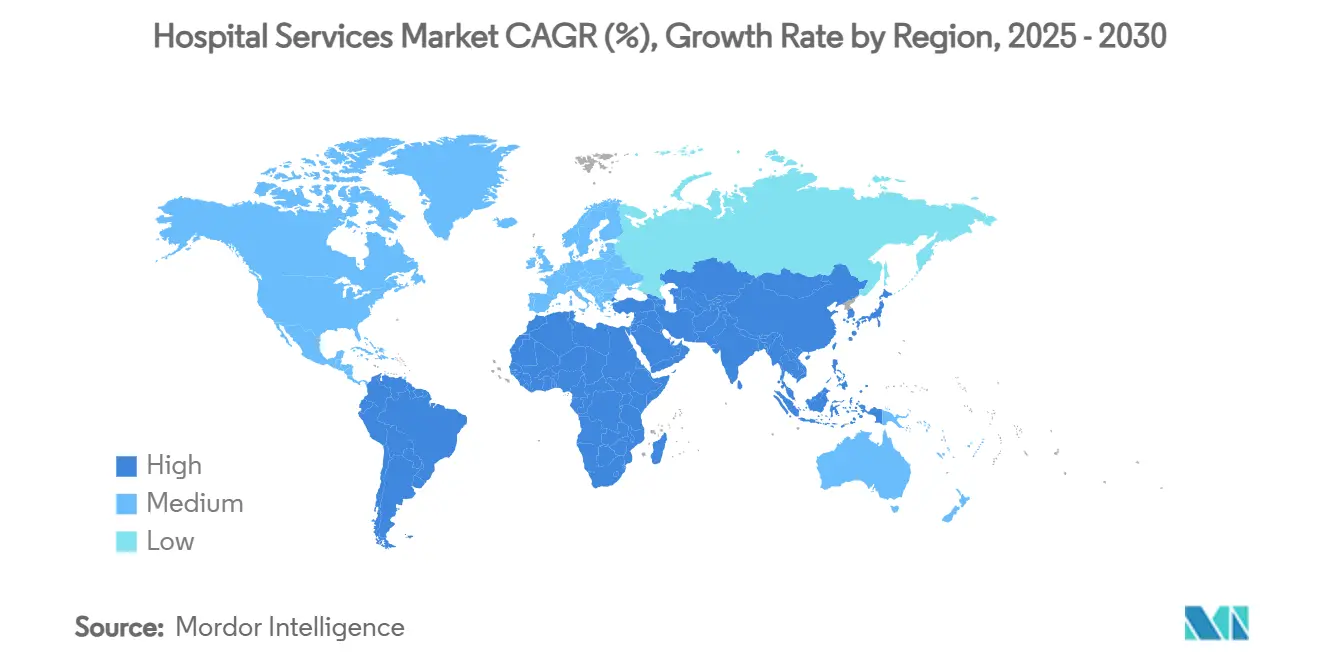
| Fastest Growing Market | Asia Pacific |
| Largest Market | North America |
| Market Concentration | Low |
Major Players
*Disclaimer: Major Players sorted in no particular order Image © Mordor Intelligence. Reuse requires attribution under CC BY 4.0. |
|
Hospital Services Market Analysis by Mordor Intelligence
The global hospital services market size is USD 4.83 trillion in 2025 and is forecast to reach USD 6.03 trillion by 2030, reflecting a 4.54% CAGR over the period. This steady expansion is underpinned by three simultaneous forces: population ageing that lengthens average inpatient days, escalating prevalence of chronic multi-morbid conditions that intensify service complexity, and accelerating insurance penetration in emerging economies that channels new patient volumes into formal hospital networks. At the same time, rapid uptake of AI-enabled operational tools and the widening acceptance of hospital-at-home programs are reshaping care pathways and cost structures, while mounting cybersecurity and workforce risks temper profit momentum. Advancing consolidation among for-profit chains, the spread of micro-hospitals, and payer mix shifts toward Medicare Advantage collectively redefine competitive dynamics across every region of the global hospital services market.
Key Report Takeaways
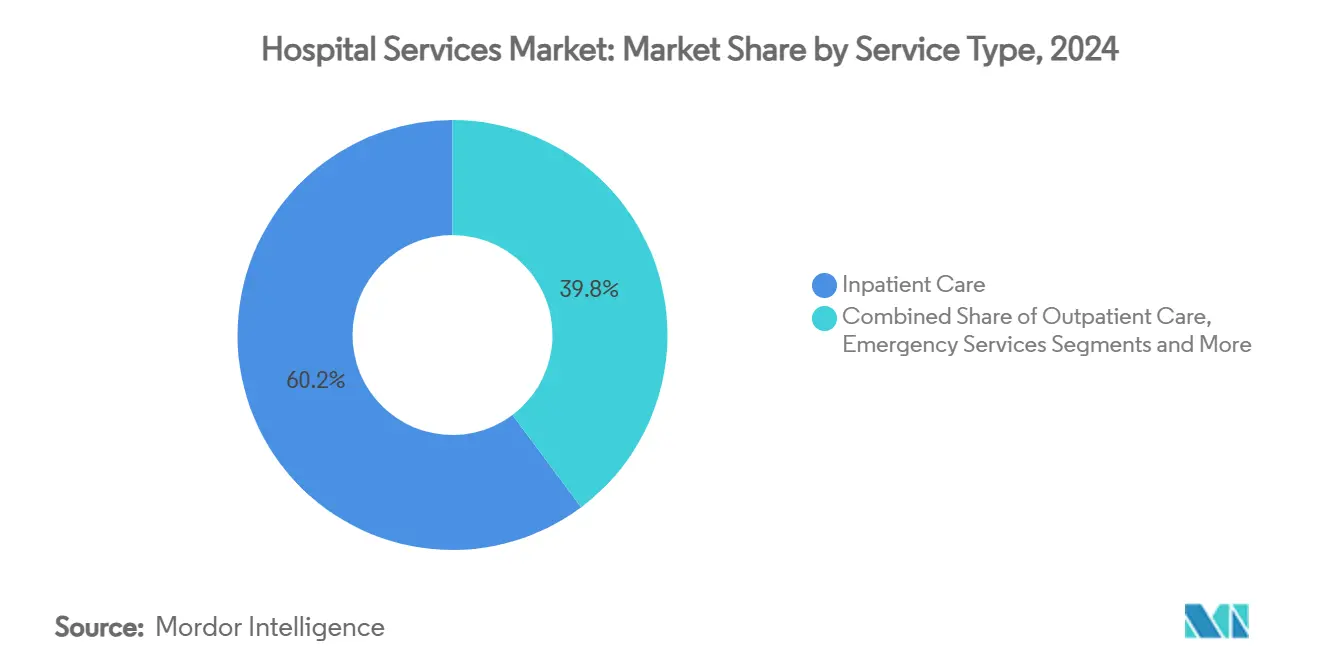
- By service type, inpatient care continued to lead with 60.22% of global hospital services market share in 2024, whereas the home and hospital-at-home care segment is projected to expand at a 7.56% CAGR through 2030.
- By ownership, private non-profit hospitals controlled 55.23% revenue share in 2024, while private for-profit chains are advancing at a 6.78% CAGR to 2030.
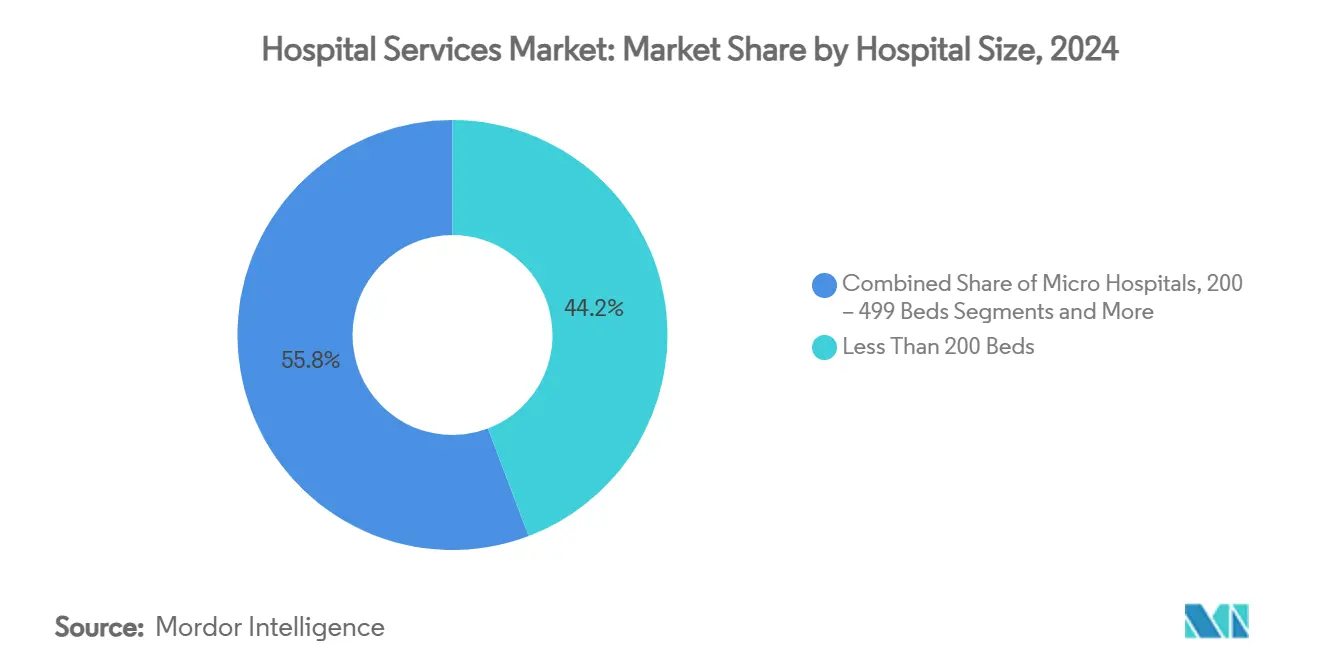
- By hospital size, facilities under 200 beds held 44.23% share of the global hospital services market in 2024; micro-hospitals are growing fastest at an 8.69% CAGR.
- By payer type, private insurance and managed care accounted for 34.23% of the global hospital services market size in 2024, but Medicare Advantage and other public insurance plans record the highest 6.94% CAGR through 2030.
- By geography, North America captured 31.37% of 2024 revenue, while Asia-Pacific is projected to post the strongest 8.05% CAGR to 2030.
Global Hospital Services Market Trends and Insights
Drivers Impact Analysis*
| Driver | (~) % Impact on CAGR Forecast | Geographic Relevance | Impact Timeline |
|---|---|---|---|
| Rising prevalence of chronic multi-morbidity | +1.2% | Global, concentrated in North America and Europe | Long term (≥ 4 years) |
| Rapid expansion of health-insurance coverage | +0.8% | Asia-Pacific core, spill-over in MEA and Latin America | Medium term (2-4 years) |
| Ageing populations driving higher inpatient days | +1.0% | Global, early gains in Japan, Germany, United States | Long term (≥ 4 years) |
| Hospital-at-home and micro-hospital adoption | +0.7% | North America, European Union, expanding to Asia-Pacific | Medium term (2-4 years) |
| AI-enabled throughput and cost-to-serve optimisation | +0.5% | Global, fastest in developed markets | Short term (≤ 2 years) |
| Expansion of outsourced ancillary and clinical services | +0.4% | Global, most active in North America and Europe | Medium term (2-4 years) |
| Source: Mordor Intelligence | |||
Rising Prevalence of Chronic Multi-Morbidity Diseases
Long-term epidemiological transition is reshaping demand as hospitals encounter larger cohorts of patients with two or more chronic conditions. CDC data show the share of US adults with multiple chronic conditions increasing from 26.6% in 2019 to 27.1% in 2023, with particularly steep growth among 18-44-year-olds. Multimorbid diabetes patients illustrate the operational strain: 94.4% present with at least one additional disease and over half require hospital resources, driving longer average length of stay and higher per-encounter costs.[1]Jin Li, Hou Hou, Yong Zhang, and Jing Li, “Multimorbidity Patterns and Their Associated Factors Among Patients With Type 2 Diabetes in China: A Hospital-Based Observational Study,” Heliyon, sciencedirect.com Hospitals are therefore redesigning clinical pathways toward integrated management while embedding social determinants screening to mitigate readmission risk.
Rapid Expansion of Health-Insurance Coverage in Emerging Markets
Insurance liberalisation in Asia-Pacific is unlocking substantial latent demand. India’s regulator removed age caps for individual health policies in 2024, while leading insurer TATA AIG will raise its contracted hospital panel from 11,500 to more than 14,000 facilities by fiscal 2027 with 35% targeted at Tier 2–3 cities. Coupled with 14% medical inflation and 11.35% average claim growth in 2023, coverage gains translate directly into rising hospital revenues, although they also compel providers to refine utilisation controls.
Ageing Populations Driving Higher Inpatient Days
By 2030, more than 20% of US residents will be 65 years or older, pushing total inpatient days up by 9% to 170 million and discharges by 3% to 31 million.[2]American Hospital Association Staff, “Providers Betting Big on Future of Hospital-at-Home,” American Hospital Association, aha.org Japan faces even sharper pressures; inpatient demand peaks in 2040 and health expenditures approach ¥89 trillion, creating a projected ¥27 trillion funding gap.[3]Shotaro Kinoshita and Taishiro Kishimoto, “Updating the Japanese Healthcare System to Meet the Needs of an Aging Society,” JMA Journal, jmaj.jp Older patients arrive with higher acuity and complex comorbidities that need extended recovery periods, prompting hospitals worldwide to retrofit infrastructure for age-friendly care and train staff in geriatric protocols.
Hospital-at-Home & Micro-Hospital Adoption
More than 320 US hospitals now hold CMS waivers for Acute Hospital Care at Home, and evidence suggests 30-40% of inpatient days can be delivered safely in domestic settings. Mass General Brigham targets shifting 10% of medical patients home, while Emerus has treated 4 million patients in micro-hospitals that average under 10 minutes to physician consult. Ongoing legislative certainty will decide the long-term trajectory, yet early adopters report reduced readmissions and higher patient satisfaction.
Restraints Impact Analysis*
| Restraint | (~) % Impact on CAGR Forecast | Geographic Relevance | Impact Timeline |
|---|---|---|---|
| Escalating labour & supply-chain costs | −0.9% | Global, acute in North America and Europe | Short term (≤ 2 years) |
| Reimbursement pressure from public payers | −0.6% | North America & EU, emerging markets to follow | Medium term (2-4 years) |
| Cybersecurity-related service disruptions | −0.4% | Global, highest in digitally advanced health systems | Short term (≤ 2 years) |
| Worsening clinician shortages & burnout | −0.7% | Global, severe in developed economies | Long term (≥ 4 years) |
| Source: Mordor Intelligence | |||
Escalating Labour & Supply-Chain Costs
Total hospital labour spend reached 60% of budgets in 2023, with wage growth of 10.1% exceeding reimbursement by fourfold. Supply inflation added another 12.4% in 2023, and MRI acquisitions now average USD 3.2 million per unit while cash reserves have fallen 28.3%. These twin pressures have pushed more than half of US hospitals into negative margins, prompting aggressive cost-containment programs and renewed interest in shared-service purchasing groups.
Reimbursement Pressure From Public Payers
Medicare pays hospitals roughly 82 cents on the dollar, generating a USD 100 billion annual deficit that must be offset with commercial revenues. The 2025 physician fee schedule proposes a further 2.8% conversion-factor cut, while inpatient and outpatient updates lag far behind inflation. France offers a cautionary analogue: public hospitals booked a €2.4 billion deficit in 2023, extending average debt payback to 16.8 years drees.solidarites-sante.gouv.fr.
*Our forecasts treat driver/restraint impacts as directional, not additive. The impact forecasts reflect baseline growth, mix effects, and variable interactions.
Segment Analysis
By Service Type: Home-Based Models Accelerate Care Decentralisation
In 2024, inpatient services retained 60.22% of global hospital services market share, yet the home and hospital-at-home segment is forecast to register a 7.56% CAGR through 2030, the fastest among all modalities. Research finds that 30–40% of traditional inpatient episodes can transition to monitored home settings without compromising outcomes, unlocking both capacity relief and cost savings. DispatchHealth has passed 1 million at-home patient visits, demonstrating replicable scalability and clinician acceptance.
Across the wider continuum, outpatient surgical volumes continue migrating from hospitals to ambulatory centres, projected to climb 17% to 5.82 billion encounters by 2034 aha.org. Emergency departments face higher acuity caseloads fueled by chronic disease incidence, whereas diagnostic imaging leverages teleradiology and AI to sustain service access. Rehabilitation and post-acute providers are integrating with home-health operators to support seamless discharge pathways. Collectively, these shifts deepen the reach of the global hospital services market while stretching traditional capacity planning assumptions.


By Ownership Type: For-Profit Chains Drive Capital Intensity
Private non-profit systems held 55.23% of global hospital services market share in 2024 owing to long-standing community roots and tax-advantaged financing mechanisms. However, private for-profit chains such as HCA Healthcare and Tenet are expanding more rapidly, posting a 6.78% CAGR to 2030 as they pursue tuck-in acquisitions and invest USD 5–6 billion annually in facilities and digital platforms. Kaiser Permanente’s Risant Health illustrates the integrated network model, targeting 5–6 additional community systems after closing Geisinger and Cone transactions.
Government hospitals worldwide confront chronic funding shortfalls and often struggle to modernise infrastructure, while specialty chains reap margin benefits by focusing narrowly on orthopaedics, cardiology, or oncology. Competitive asymmetry grows as for-profit operators leverage scale to negotiate supply contracts and pilot AI workflow modules earlier than smaller peers. Nonetheless, mission-driven non-profits retain strong patient loyalty, positioning the ownership mix as an ongoing balancing act of efficiency, equity, and community trust across the global hospital services market.
By Hospital Size: Micro-Hospitals Reinvent Local Access
Facilities under 200 beds accounted for 44.23% of the global hospital services market size in 2024, reflecting their prevalence in suburban and rural regions. Yet micro-hospitals with fewer than 25 beds are expanding at 8.69% CAGR, propelled by consumer preference for quick-access emergency care and lower operating costs. Emerus, the category pioneer, reports average door-to-doctor times below 10 minutes and heavy reliance on tele-specialist networks.
Mid-tier hospitals (200–499 beds) function as regional referral hubs, pairing community reach with specialty depth, while mega-centres above 500 beds concentrate on quaternary services requiring costly capital and elite talent pools. The resulting three-tier architecture delivers right-sized capacity for population needs, though questions remain about economic sustainability in low-volume geographies. Micro-hospital momentum suggests that agility and targeted scope can rival traditional economies of scale in the evolving global hospital services market.
By Payer Type: Public Programs Widen Coverage Footprint
Private insurance and managed care held 34.23% revenue share in 2024, yet Medicare Advantage and other public schemes are growing at 6.94% CAGR as populations age and policy frameworks expand. Public reimbursement does not fully meet cost, but rising enrolment still elevates absolute hospital revenue even as margin compression persists. Meanwhile, high-deductible health plans are boosting patient out-of-pocket exposure, intensifying revenue-cycle pressure for providers.
International medical tourism remains a niche but lucrative segment; Thailand’s Bumrungrad International treats more than 1.1 million foreign patients annually, proving cross-border demand for high-specialty procedures and premium amenities. The payer mix shift has strategic implications for service design, as hospitals invest in patient-navigation and chronic-care management capabilities to succeed under value-linked public contracts within the expansive global hospital services market.
Geography Analysis
North America retained 31.37% of 2024 revenue thanks to high per-capita spend and dense health infrastructure, yet Asia-Pacific is forecast to compound at 8.05% annually through 2030, making it the undisputed volume engine of the global hospital services market. China’s 2024 decision to permit foreign-owned hospitals in select provinces has already tempted Cleveland Clinic and UPMC, signalling policy appetite for advanced international expertise.
Europe presents divergent patterns: the UK’s private-care outlays hit a record GBP 12.4 billion in 2023 amid NHS waiting-list strain, whereas France’s hospital deficit widened despite €122 billion in spending. Japan’s super-aging society spurs ongoing capacity realignment, while Gulf Cooperation Council nations accelerate green-field mega-hospital projects under public-private partnership formats. South America and Africa still lag in infrastructure density, but insurance expansion and urbanisation pave the way for catch-up growth that will broaden the geographic footprint of the global hospital services market.

Competitive Landscape
Consolidation remains moderate but is intensifying as scale advantages in purchasing, digital investment, and brand recognition widen. For-profit giants such as HCA Healthcare posted USD 5.2 billion in 2023 net income, enabling capital programmes that smaller rivals cannot match. Ascension’s USD 3.9 billion acquisition of AmSurg’s 250 ambulatory surgery centres in June 2025 epitomises the strategic pivot toward outpatient settings that complement core hospital assets.
Vertical integration shapes many deals; pay-vider Kaiser Permanente uses Risant Health to fold community systems into its insurance-backed network, while Tenet’s USPI subsidiary operates more than 460 surgery centres that generated USD 3.865 billion revenue in 2024. Technology is an increasingly decisive differentiator: AI-enhanced scheduling, predictive supply analytics, and omnichannel patient portals distinguish early adopters in cost and experience metrics. Start-ups offering hospital-at-home orchestration or AI-driven diagnostics create new forms of competition beyond bricks-and-mortar, compelling incumbents to innovate or cede share within the dynamic global hospital services market.
Hospital Services Industry Leaders
-
HCA Healthcare
-
Kaiser Permanente
-
Ascension Health
-
Fresenius Helios
-
IHH Healthcare
- *Disclaimer: Major Players sorted in no particular order

Recent Industry Developments
- June 2025: Ascension completes USD 3.9 billion AmSurg acquisition, integrating 250 outpatient surgery centres across 34 states.
- May 2025: Ascension Saint Thomas announces USD 148.5 million full-service hospital in Clarksville, Tennessee, with 44 initial beds and 250 new jobs.
- April 2025: Ascension agrees to purchase Community Health Systems’ stake in a Texas facility for USD 460 million as CHS pursues debt reduction.


Global Hospital Services Market Report Scope
| Inpatient Care |
| Outpatient Care |
| Emergency Services |
| Diagnostic & Imaging Services |
| Rehabilitation & Post-acute Care |
| Home & Hospital-at-Home Care |
| Public / Government Hospitals |
| Private Non-profit Hospitals |
| Private For-profit Hospitals |
| Specialty Hospital Chains |
| < 200 Beds |
| 200 – 499 Beds |
| ≥ 500 Beds |
| Micro-hospitals (< 25 Beds) |
| Public Insurance (Medicare/Medicaid/NHS etc.) |
| Private Insurance & Managed Care |
| Self-pay / Out-of-Pocket |
| International Medical Tourists |
| North America | United States |
| Canada | |
| Mexico | |
| Europe | Germany |
| United Kingdom | |
| France | |
| Italy | |
| Spain | |
| Rest of Europe | |
| Asia-Pacific | China |
| Japan | |
| India | |
| Australia | |
| South Korea | |
| Rest of Asia-Pacific | |
| Middle East and Africa | GCC |
| South Africa | |
| Rest of Middle East and Africa | |
| South America | Brazil |
| Argentina | |
| Rest of South America |
| By Service Type | Inpatient Care | |
| Outpatient Care | ||
| Emergency Services | ||
| Diagnostic & Imaging Services | ||
| Rehabilitation & Post-acute Care | ||
| Home & Hospital-at-Home Care | ||
| By Ownership Type | Public / Government Hospitals | |
| Private Non-profit Hospitals | ||
| Private For-profit Hospitals | ||
| Specialty Hospital Chains | ||
| By Hospital Size – Bed Capacity | < 200 Beds | |
| 200 – 499 Beds | ||
| ≥ 500 Beds | ||
| Micro-hospitals (< 25 Beds) | ||
| By Payer Type | Public Insurance (Medicare/Medicaid/NHS etc.) | |
| Private Insurance & Managed Care | ||
| Self-pay / Out-of-Pocket | ||
| International Medical Tourists | ||
| By Geography | North America | United States |
| Canada | ||
| Mexico | ||
| Europe | Germany | |
| United Kingdom | ||
| France | ||
| Italy | ||
| Spain | ||
| Rest of Europe | ||
| Asia-Pacific | China | |
| Japan | ||
| India | ||
| Australia | ||
| South Korea | ||
| Rest of Asia-Pacific | ||
| Middle East and Africa | GCC | |
| South Africa | ||
| Rest of Middle East and Africa | ||
| South America | Brazil | |
| Argentina | ||
| Rest of South America | ||


Key Questions Answered in the Report
1. What is the current size of the global hospital services market?
The global hospital services market size stands at USD 4.83 trillion in 2025 and is projected to rise to USD 6.03 trillion by 2030.
2. Which service segment is growing fastest?
Home and hospital-at-home care shows the highest growth, advancing at a 7.56% CAGR through 2030 as tele-monitoring, remote diagnostics, and supportive reimbursement policies gain traction.
3. Why are micro-hospitals gaining popularity?
Micro-hospitals deliver rapid emergency access and focused acute care with fewer than 25 beds, lowering capital costs and improving patient experience; they are growing at an 8.69% CAGR.
4. How will ageing populations affect hospital demand?
Rising shares of adults aged 65 years and above are expected to drive inpatient days higher by 9% in the United States by 2030, increasing demand for geriatric-focused care models.
5. What cybersecurity risks do hospitals face?
High-profile ransomware and system outages, such as the 2024 Change Healthcare attack, threaten revenue streams and patient safety, prompting hospitals to bolster cyber-resilience strategies.
Page last updated on:


