
United States Diagnostic Imaging Services Market Size and Share
Market Overview
| Study Period | 2020 - 2031 |
|---|---|
| Forecast Data Period | 2026 - 2031 |
| Base Year Market Size (2025) | USD 193.69 Billion |
| Market Size (2026) | USD 203.09 Billion |
| Market Size (2031) | USD 257.35 Billion |
| Growth Rate (2026 - 2031) | 4.85 % |
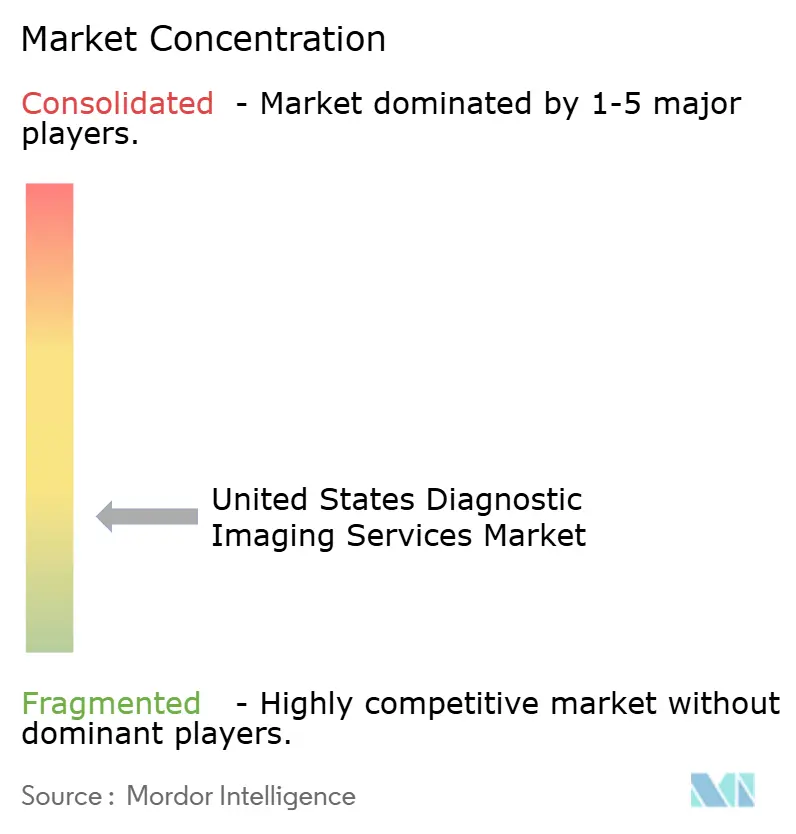
| Market Concentration | Low |
Major Players *Disclaimer: Major Players sorted in no particular order Image © Mordor Intelligence. Reuse requires attribution under CC BY 4.0. | |
United States Diagnostic Imaging Services Market Analysis by Mordor Intelligence
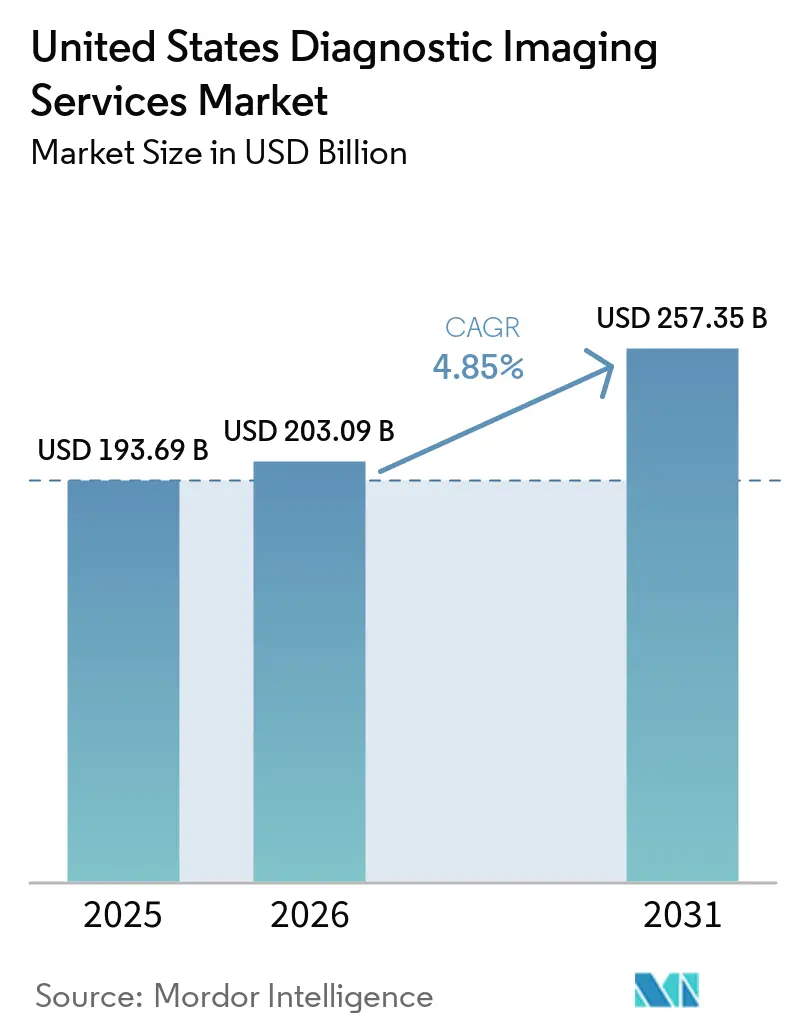
The United States Diagnostic Imaging Services Market size was valued at USD 193.69 billion in 2025 and is estimated to grow from USD 203.09 billion in 2026 to reach USD 257.35 billion by 2031, at a CAGR of 4.85% during the forecast period (2026-2031).
The United States (US) diagnostic imaging services market continues to benefit from a demand base that stays resilient because older patients, cancer care pathways, and chronic disease management each require repeat imaging over long treatment timelines. Growth in the US diagnostic imaging services market is also being shaped by a higher mix of advanced studies, as providers add more CT, MRI, PET, and contrast procedures into routine care pathways while basic modalities still carry large volumes. The US diagnostic imaging services market is also seeing a steady redistribution of volumes toward outpatient settings, where freestanding centers and partnership models can often combine lower cost, easier scheduling, and scalable technology deployment. Reimbursement pressure remains a meaningful constraint, especially where Medicare exposure is high, and this is widening the performance gap between larger networks with purchasing leverage and smaller independent operators that face tighter margins. Competitive positioning in the US diagnostic imaging services market is therefore moving toward scale, AI-supported workflow, and network density, while supply risks around isotopes, staffing shortages, and administrative friction continue to reward operators that can spread fixed costs across larger study volumes.
Key Report Takeaways
- By modality, X-ray held 28.31% of revenue in 2025, while Computed Tomography is projected to expand at a 6.38% CAGR through 2031.
- By application, Oncology accounted for 33.24% of revenue in 2025, while Neurology and Spine is forecast to grow at a 7.52% CAGR through 2031.
- By site of care, hospital-based imaging departments held 44.52% of the US diagnostic imaging services market share in 2025, while Freestanding Imaging Centers are projected to advance at a 6.25% CAGR through 2031.
- By delivery model, Owned and Operated Networks represented 45.62% of revenue in 2025, while Teleradiology-enabled Networks are expected to grow at an 8.25% CAGR through 2031.
- By payor, Commercial and Employer-sponsored Plans contributed 48.84% of revenue in 2025, while Medicare is forecast to expand at a 6.61% CAGR through 2031.
Note: Market size and forecast figures in this report are generated using Mordor Intelligence’s proprietary estimation framework, updated with the latest available data and insights as of January 2026.
United States Diagnostic Imaging Services Market Trends and Insights
Drivers Impact Analysis*
| Driver | (~) % Impact on CAGR Forecast | Geographic Relevance | Impact Timeline |
|---|---|---|---|
| Aging Chronic-Disease Imaging Volumes | +1.8% | National, with disproportionate volume concentration in Florida, Arizona, Pennsylvania, and the broader Sunbelt corridor | Long term (≥ 4 years) |
| Screening-Led Early Diagnosis Demand | +0.9% | National, early gains in Sunbelt and Metro Northeast where screening-center density is highest | Medium term (2-4 years) |
| Outpatient Imaging Migration and Site-Neutral Economics | +0.7% | National, with rapid freestanding growth in Texas, Florida, Ohio, Indiana, and Georgia | Medium term (2-4 years) |
| AI-Enabled Workflow and Scan Productivity | +0.6% | National, adoption concentrated in multi-site networks and large health systems in California, Texas, New York | Short term (≤ 2 years) |
| Virtual Direct Supervision for Contrast Imaging | +0.3% | National, highest immediate impact in non-metropolitan IDTFs and rural imaging sites | Short term (≤ 2 years) |
| Theranostics-Led PET/CT Mix Upgrade | +0.4% | National, anchored in academic and regional cancer centers across Northeast, Southeast, and Pacific Coast | Medium term (2-4 years) |
| Source: Mordor Intelligence | |||
Aging Chronic-Disease Imaging Volumes
The US diagnostic imaging services market has a durable demand floor because chronic disease prevalence remains high in adults age 45 and older, and those conditions often require repeated imaging across diagnosis, monitoring, and follow-up care[1]Xun Wang and Lindsey I. Black, “Prevalence of Selected Chronic Conditions Among Adults Age 45 and Older, by Age and Urbanization Level, United States, 2024,” NCHS Data Brief, cdc.gov. Heart disease, cancer, COPD, and stroke all become more common with age, which means imaging demand rises not only because the population is aging, but also because older patients tend to move through several imaging pathways at the same time. This pattern supports study growth across CT, MRI, nuclear imaging, ultrasound, and X-ray, because multimorbidity increases the number of scans attached to a single episode of care. The US diagnostic imaging services market therefore benefits from a patient mix where recurring surveillance matters as much as first diagnosis, especially in oncology, cardiology, and neurology. That demand base is difficult to displace because it is linked to long-cycle care needs rather than discretionary procedure use.
Screening-Led Early Diagnosis Demand
The US diagnostic imaging services market is also benefiting from broader screening pathways that enlarge the pool of patients entering imaging earlier in the care journey. The 2024 USPSTF breast cancer screening update lowered the recommended start age to 40 for biennial mammography, which should support a larger screening population over time. A 2024 JAMA Network Open study also showed that broader age-based lung cancer screening could prevent 26,124 deaths annually and be 6 times more cost-effective than current screening approaches, which points to further procedure upside if eligibility expands in future policy cycles. These changes favor operators with strong outpatient screening capacity, because mammography, CT, and follow-on imaging referrals tend to build around dense, convenient access points. Solis Mammography’s October 2025 acquisition of the St. Louis Breast Center shows how specialized screening providers are expanding into additional metropolitan areas to capture that volume growth.
AI-Enabled Workflow and Scan Productivity
AI deployment is shifting from a pilot activity into operating infrastructure across the US diagnostic imaging services market. A 2025 JAMA Network Open study found that a generative AI system used across Northwestern Medicine improved documentation efficiency by 15.5%, with some radiologists recording gains of up to 40%, while peer review found no decline in text quality or clinical accuracy. A separate 2025 study in npj Digital Medicine reported that a keyword-based AI reporting approach reduced radiology resident reporting time by a median of 28%. RadNet stated that more than 70% of its studies could run through clinical AI by the end of 2026, and the company reported a 35.2% year-on-year increase in PET/CT volumes in Q1 2026, which shows how workflow software is being used to support higher-acuity growth without matching headcount growth one for one. Microsoft’s Dragon Copilot launch for radiologists at RSNA 2025 adds another signal that large software vendors now view radiology workflow as a recurring platform category rather than a temporary feature set.
Virtual Direct Supervision for Contrast Imaging
Regulatory change is opening a practical access lever for the US diagnostic imaging services market, especially outside major metro areas. Reed Smith noted that CMS made virtual direct supervision permanent from January 1, 2026 for Level 2 diagnostic tests, including CT and MRI with contrast, through real-time two-way audio and video capability in office and hospital outpatient settings. This matters because independent diagnostic testing facilities and freestanding centers had faced a harder path to contrast study retention when physical physician presence was required. The rule should support better revenue mix at rural and semi-urban sites by allowing them to keep cases that might otherwise have been redirected to hospital outpatient departments. The effect is likely to be strongest in geographies where imaging demand exists but staffing density remains thin. Implementation will still vary because state boards and professional bodies can impose added requirements, so operators with stronger compliance infrastructure are better placed to capture the benefit.
Restraints Impact Analysis*
| Restraint | (~) % Impact on CAGR Forecast | Geographic Relevance | Impact Timeline |
|---|---|---|---|
| Radiologist and Technologist Shortages | -0.6% | National, most acute in rural and non-metropolitan areas, with disparities ranging from 9 to 25 radiologists per 100,000 population across states | Long term (≥ 4 years) |
| Reimbursement and Margin Pressure | -0.5% | National, amplified in Medicare-heavy markets and rural HOPDs affected by site-neutral payment reforms | Medium term (2-4 years) |
| Prior-Authorization Friction in Advanced Imaging | -0.3% | National, highest concentration of friction in states with high Medicare Advantage penetration | Short term (≤ 2 years) |
| Isotope and Imported-Equipment Input Volatility | -0.2% | National, with supply disruption risk concentrated in the Northeast and Midwest nuclear medicine programs | Short term (≤ 2 years) |
| Source: Mordor Intelligence | |||
Radiologist And Technologist Shortages
Workforce shortage remains one of the clearest structural constraints on the US diagnostic imaging services market. Research published in the American Journal of Neuroradiology in April 2025 reported 31,825 ACR Career Center listings against 10,180 anticipated diagnostic radiology residency graduates through the NRMP period reviewed, which implies a large mismatch between demand and training output[2]American Journal of Neuroradiology, “In Plain Sight, a Radiology Workforce Crisis in the Making,” American Journal of Neuroradiology, ajnr.org. The pressure is most visible in advanced imaging and subspecialty reads, where delays can reduce throughput, stretch turnaround times, and weaken referral retention. This is one reason the US diagnostic imaging services market is leaning more heavily on automation, centralized reading platforms, and network models that can move studies across a broader clinician base. The shortage also tilts bargaining power toward larger organizations that can offer better compensation, deeper support teams, and more flexible reading arrangements.
Reimbursement And Margin Pressure
Margin pressure remains a steady restraint on the US diagnostic imaging services market even as procedure demand rises. CMS set the CY 2025 Medicare Physician Fee Schedule conversion factor at USD 32.35 per RVU, down 2.83% from CY 2024, and interventional radiology faced an even steeper 4.83% reduction. KFF also described the November 2025 move toward site-neutral payment reform as modest but directionally important, which means reimbursement alignment pressure could continue to spread across hospital outpatient economics. Smaller independent groups are more exposed because labor costs have been rising at the same time that Medicare-linked rates have been moving lower. This gap between rising volume and tighter unit economics is supporting consolidation, especially where larger networks can use AI, preferred contracts, and centralized operations to protect margins.
*Our forecasts treat driver/restraint impacts as directional, not additive. The impact forecasts reflect baseline growth, mix effects, and variable interactions.
Segment Analysis
By Modality: X-Ray Holds The Largest Revenue Base While CT Advances Fastest
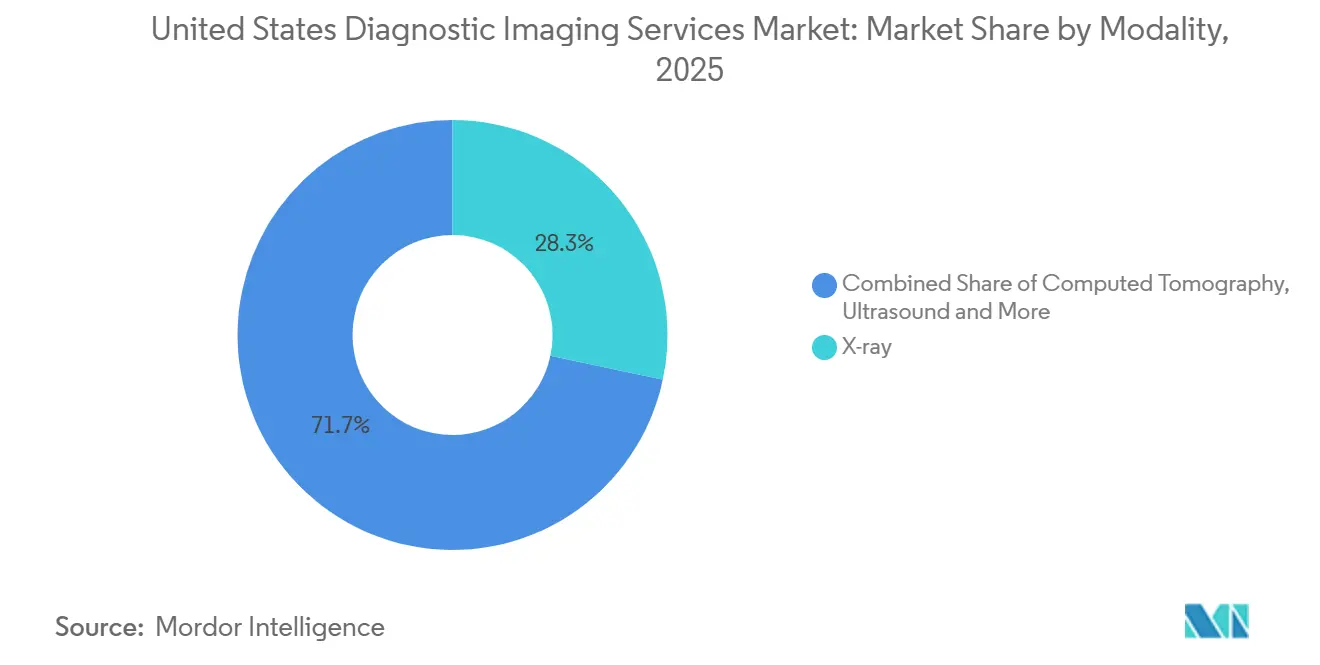
X-ray accounted for 28.31% of revenue in 2025, which kept it as the largest modality in the US diagnostic imaging services market because it remains essential across emergency care, orthopedics, and chest evaluation. The segment’s scale rests on procedure breadth rather than on high ticket pricing, which means revenue share remains strong even though CT and MRI often generate more value per exam. This wide clinical footprint gives X-ray a stabilizing role in the US diagnostic imaging services market because it supports both acute and routine imaging demand across hospitals and outpatient sites. AI adoption is also beginning to improve throughput in this modality, especially where report generation and documentation can be standardized. SimonMed Imaging’s December 2025 partnership with Lunit to deploy multimodal foundation models for chest X-ray report generation shows that even high-volume, lower-ticket categories are becoming part of the next operating model.
Computed Tomography is the fastest-growing modality, with the US diagnostic imaging services market size for CT projected to expand at a 6.38% CAGR through 2031. CT is gaining share of incremental study growth because it sits at the center of lung screening, cardiovascular imaging, trauma evaluation, and many oncology pathways. RadNet reported a 17.7% year-on-year increase in CT procedural volumes in Q1 2026, while same-center CT volumes rose 4.7%, which indicates that demand is growing both organically and through network expansion. MRI is also expanding on the back of neurological, musculoskeletal, and cardiac use, and RadNet stated that same-center MRI volume rose 10.0% in Q1 2026. Ultrasound and mammography remain important growth supports because they benefit from portability, lower patient friction, and stronger preventive screening use, while SimonMed’s January 2025 partnership with Siemens Healthineers for liver disease screening reflects continued modality-specific investment in ultrasound workflows.



By Application: Oncology Leads Revenue While Neurology And Spine Grow Fastest
Oncology represented 33.24% of revenue in 2025, giving it the largest application position in the US diagnostic imaging services market. That leadership reflects the longitudinal structure of cancer care, where patients often move through staging, restaging, treatment response monitoring, and recurrence surveillance across several modalities. The segment also benefits from the way screening expansion feeds downstream advanced imaging, especially when suspicious findings generate follow-up CT, MRI, ultrasound, or nuclear imaging. Oncology volumes therefore support both baseline utilization and higher-value cross-sectional procedures across provider networks. Radiology Partners’ October 2025 launch of Mammo Enhance Heart also shows how screening infrastructure can be used to widen clinical value capture from existing imaging touchpoints.
Neurology and Spine is the fastest-growing application, with the US diagnostic imaging services market size for this segment expected to rise at a 7.52% CAGR through 2031. MRI demand is a major driver because stroke workup, multiple sclerosis follow-up, degenerative spine disease, and cognitive decline assessment all depend on repeated imaging over time. Cardiology imaging remains an important adjacent volume stream, but the ASNC-reported Tc-99m pyrophosphate shortage in early 2025 showed how nuclear cardiology can be disrupted by supply issues outside provider control. Orthopedics and musculoskeletal imaging continue to provide high-frequency demand because aging patients and outpatient joint procedures support recurring diagnostic needs. Women’s Health and Obstetrics also stand to gain from expanded screening and supplemental follow-up pathways, while General Imaging remains a dependable base because emergency departments and primary care referrals continue to generate broad study volume.
By Site Of Care: Hospitals Retain Scale While Freestanding Centers Capture Incremental Growth
Hospital-based imaging departments held 44.52% of the US diagnostic imaging services market share in 2025, which kept them in the lead because they control emergency, inpatient, and high-acuity referral streams. That position remains difficult to dislodge because hospitals manage many of the care settings where imaging is tied directly to urgent decision making and downstream treatment coordination. The US diagnostic imaging services market still depends heavily on these departments for complex and time-sensitive imaging pathways, even as more non-acute volumes move outward. Hospital systems are also adapting by building satellite access points and partnership structures rather than relying only on centralized campus-based imaging. HCA-backed expansion in Florida and Solis Mammography’s continued center rollout in Texas both illustrate how hospital-linked or referral-linked outpatient capacity is being added in fast-growth areas.
Freestanding Imaging Centers are the fastest-growing site of care, with a 6.25% CAGR projected through 2031. Their momentum comes from convenience, lower-cost positioning, and their ability to scale scheduling and equipment use more efficiently in many outpatient settings. Lumexa Imaging shows the model at scale, as the company completed its IPO in December 2025, operated more than 190 centers across 13 states by May 2026, and stated that MRI and CT generated 52% of consolidated revenue in 2025. Community diagnostic centers and polyclinic hubs are also gaining relevance because they can serve suburban and semi-urban populations with broader specialty access. Mobile imaging units continue to fill access gaps in rural and institutional settings, but their expansion remains limited by fleet capacity and reading coverage rather than by a lack of demand.
By Delivery Model: Owned Networks Lead Revenue While Teleradiology-Enabled Models Scale Fastest
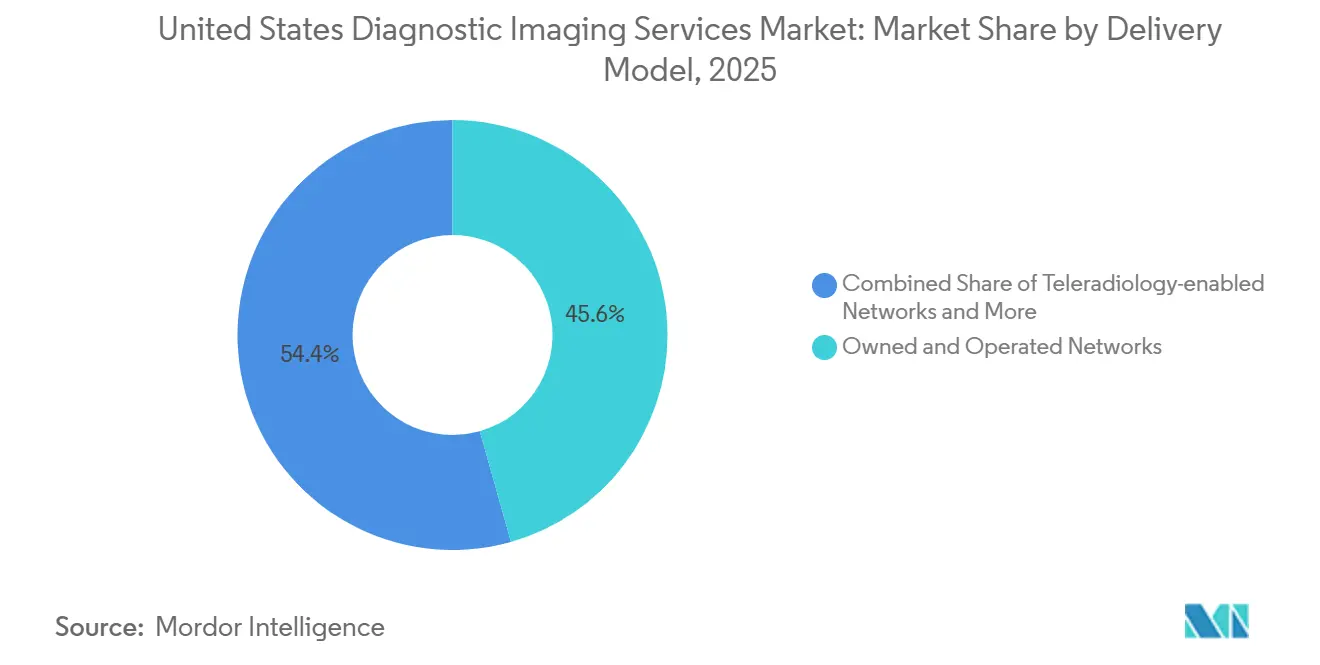
Owned and Operated Networks retained 45.62% of revenue in 2025, which reflected the capital intensity and operating leverage built into the US diagnostic imaging services industry. Larger owned networks can centralize purchasing, spread technology costs, negotiate broader contracts, and deploy workflow tools across multiple centers, which gives them advantages in both growth and margin defense. This operating model is especially well suited to the US diagnostic imaging services market because high fixed assets and staffing pressure make density and utilization important profit drivers. RadNet’s Q1 2026 revenue reached USD 575.6 million, up 22.1% year on year, while Adjusted EBITDA rose 36.3% to USD 63.3 million, which supports the view that scale continues to improve financial resilience in network-based imaging. Hospital joint ventures are also becoming more common, and RadNet’s April 2026 arrangement with Trinity Health’s Saint Alphonsus Health System shows how AI deployment is increasingly part of the partnership case rather than an optional add-on.
Teleradiology-enabled Networks are the fastest-growing delivery model, with a projected CAGR of 8.25% through 2031. Their growth is tied to staffing shortages, the need for round-the-clock read capacity, and the January 2026 permanence of virtual direct supervision for relevant diagnostic tests. This widens the addressable opportunity because smaller imaging sites can retain more advanced studies while still using distributed physician oversight. Managed services and outsourcing contracts also remain important where health systems want clinical continuity but prefer not to run all imaging operations directly. Radiology Partners’ April 2025 agreement to support the transition of approximately 95 client sites and onboard up to 400 radiologists from Envision Healthcare’s exiting radiology division illustrates how outsourcing can become a consolidation path for large service platforms.
By Payor: Commercial Plans Hold The Largest Revenue Base While Medicare Expands Fastest
Commercial and Employer-sponsored Plans contributed 48.84% of revenue in 2025, which made them the largest payor category in the US diagnostic imaging services market. Higher reimbursement levels relative to government programs remain the main reason this segment leads revenue, even though utilization growth is not always highest in commercially insured populations. Administrative friction has historically weighed on this category, especially for advanced imaging, but reform efforts are beginning to target that burden directly. HHS and CMS announced in June 2025 that insurers covering nearly 80% of Americans committed to reduce prior authorization volumes and improve related processes, with demonstrated results targeted by January 2026[3]U.S. Department of Health and Human Services, “HHS Secretary Kennedy, CMS Administrator Oz Secure Industry Pledge to Fix Broken Prior Authorization System,” HHS, hhs.gov. A more standardized electronic prior authorization pathway should particularly help high-volume outpatient operators, because fewer approval delays translate directly into better scanner utilization and lower scheduling waste.
Medicare is the fastest-growing payor segment, with the US diagnostic imaging services market size for this category projected to increase at a 6.61% CAGR through 2031. KFF reported that Medicare Advantage enrollment reached 35 million beneficiaries in 2026, up from 34 million in 2025, which confirms the continued rise in the elderly insured population most likely to use imaging frequently. The same KFF analysis also noted 67% growth in Chronic Special Needs Plan enrollment from 2024 to 2025, which indicates stronger concentration of high-acuity patients in managed products. Self-pay imaging remains smaller, but it is receiving some support from cash-pay transparency and direct-to-consumer screening offers at freestanding sites. Medicaid, TRICARE, and workers’ compensation continue to provide stable baseline volume, though they do not currently represent the same growth engine as Medicare in the US diagnostic imaging services industry.
Geography Analysis
The United States functions as a multi-speed geography for the US diagnostic imaging services market, and the fastest expansion is occurring across the Sunbelt because population inflows, outpatient buildout, and older patient concentration all support stronger imaging demand. Texas, Florida, Arizona, and the broader Southeast continue to stand out because these markets combine population growth with a site-of-care mix that is favorable to freestanding and hybrid outpatient expansion. HCA-backed investment of USD 134.5 million in Lee County, Florida and Solis Mammography’s continued Houston-area expansion show how providers are building local density in areas where screening, elective care, and retiree-driven demand continue to rise. RadNet also stated that it was operating 14 centers in the Houston metropolitan area in early 2026 after doubling its footprint since entering the market in 2024, which underscores how quickly large operators are trying to build network density in high-growth Sunbelt corridors.
The Northeast and Mid-Atlantic remain the deepest hospital-based imaging corridor in the country, with strong academic medical center presence and dense urban referral networks supporting advanced modality use. New York, New Jersey, Maryland, Pennsylvania, and Massachusetts continue to offer strong volume depth, but they also face heavier workforce strain because high-acuity imaging demand and subspecialty reading needs remain difficult to staff consistently. RadNet’s established positions in California, New York, New Jersey, and Maryland keep it well placed in these dense referral markets, where access to radiologists and advanced AI tools can be a more important differentiator than simple site count. At the same time, the Midwest is becoming a clearer expansion frontier for the US diagnostic imaging services market because it has historically had less outpatient chain penetration than coastal metros. RadNet’s February 2026 acquisition of Northwest Radiology Network’s six Indianapolis-area centers marked its entry into Indiana and added projected annualized revenue of USD 18 million, which highlights how aggregators are now moving into underpenetrated regional hubs.
Rural markets across the Mountain West and the rural South remain the most underserved parts of the US diagnostic imaging services market, largely because radiologist supply and on-site supervision coverage are thinner than in major metro areas. Workforce variation remains wide, with published 2025 data showing state-level radiologist density ranging from 9 to 25 per 100,000 people, and that gap directly affects access, turnaround times, and the economic viability of advanced imaging outside urban cores. The permanent virtual supervision framework from January 2026 should improve the ability of rural and semi-urban centers to retain contrast procedures instead of referring them outward. That change does not eliminate the underlying staffing gap, but it does improve access economics in geographies where demand exists and the traditional supervision model had been a practical barrier.
Competitive Landscape
The US diagnostic imaging services market remains regionally fragmented, but national structure is becoming more stratified as a small group of scaled operators extends its reach through acquisitions, joint ventures, and technology investment. Thousands of independent practices and hospital-affiliated sites still account for a large share of activity, yet the strongest strategic moves are being made by networks that can combine capital access, workflow technology, and broader contracting leverage. RadNet remains the clearest public-market example of this model, with record Q1 2026 revenue of USD 575.6 million and more than 430 centers across nine states, which places it at the leading edge of multi-site outpatient imaging scale. The company’s March 2026 acquisition of Gleamer for up to EUR 230 million (USD 248 million) also shows that competitive advantage is no longer based only on center count, because ownership of AI capability is increasingly part of the long-term platform strategy.
Lumexa Imaging is another major consolidator in the US diagnostic imaging services market, and its December 2025 IPO raised USD 462.5 million, giving it additional funding for de novo buildout, acquisitions, and joint venture growth. By May 2026, Lumexa had surpassed 190 operating locations nationally, which confirms that outpatient imaging remains a capital-attractive roll-up space when operators can build enough density and partnership depth. Radiology Partners represents a different form of scale, built more around physician network reach and service platform breadth than around owned site count. The company stated in July 2025 that it had secured approximately USD 750 million in new growth equity, and it continues to position MosaicOS and related workflow tools as core operating infrastructure. This separation between owned-center operators and service-platform consolidators means competition is not playing out through one model alone, but through several ways of controlling volume, referrals, reads, and data flows.
Open space still exists in rural and semi-urban markets where independent providers remain common and technology adoption is harder to fund. Specialized screening is also emerging as a more distinct growth lane, with Solis Mammography expanding across major markets and SimonMed rolling out targeted AI deployments in chest X-ray and liver screening workflows. Data and AI assets are becoming part of competitive positioning as well, because operators that process high study volumes are in a better position to train, validate, and deploy software across real-world clinical workflows. Accreditation requirements and FDA clearance pathways also support incumbent advantage, since they raise the bar for new entrants that lack capital, compliance depth, and established referral relationships.
United States Diagnostic Imaging Services Industry Leaders
RadNet
Lumexa Imaging
RAYUS Radiology
Akumin
SimonMed Imaging
- *Disclaimer: Major Players sorted in no particular order

Recent Industry Developments
- May 2026: Lumexa Imaging added four new centers (Spartanburg SC, Concord NC, Wexford PA, Niceville FL) through acquisitions with JV partners Advocate Health and UPMC, surpassing 190 operating locations nationally.
- April 2026: RadNet formed a joint venture with Trinity Health's Saint Alphonsus Health System in Boise, Idaho, acquiring a majority stake in Intermountain Medical Imaging's five outpatient centers, with projected USD 30 million annual revenue and full DeepHealth OS deployment.


United States Diagnostic Imaging Services Market Report Scope
As per the scope of the report, diagnostic imaging services refer to medical procedures that utilize various imaging techniques to create visual representations of the interior of the body. These services are essential for detecting, diagnosing, and monitoring various health conditions and diseases. Common types include X-rays, CT scans, MRI scans, ultrasound, and nuclear imaging.
The United States diagnostic imaging services market is segmented by modality into x-ray, computed tomography, magnetic resonance imaging, ultrasound, mammography, and nuclear imaging. By application, the market is categorized into oncology, cardiology, neurology and spine, orthopedics and musculoskeletal, women’s health and obstetrics, and general imaging. By site of care, the segmentation includes hospital imaging departments, freestanding imaging centers, community diagnostic centers and polyclinic hubs, and mobile imaging units. By delivery model, the market is divided into owned and operated networks, hospital joint ventures, managed services and outsourcing contracts, and teleradiology networks. By payor, the segmentation comprises commercial and employer-sponsored plans, Medicare, Medicaid, self-pay, and others. For each segment, the market size and forecast are provided in terms of value (USD).
| X-ray |
| Computed Tomography |
| Magnetic Resonance Imaging |
| Ultrasound |
| Mammography |
| Nuclear Imaging |
| Oncology |
| Cardiology |
| Neurology and Spine |
| Orthopedics and Musculoskeletal |
| Women's Health and Obstetrics |
| General Imaging |
| Hospital-based Imaging Departments |
| Freestanding Imaging Centers |
| Community Diagnostic Centers and Polyclinic Hubs |
| Mobile Imaging Units |
| Owned and Operated Networks |
| Hospital Joint Ventures |
| Managed Services and Outsourcing Contracts |
| Teleradiology-enabled Networks |
| Commercial and Employer-sponsored Plans |
| Medicare |
| Medicaid |
| Self-pay |
| Others |
| By Modality | X-ray |
| Computed Tomography | |
| Magnetic Resonance Imaging | |
| Ultrasound | |
| Mammography | |
| Nuclear Imaging | |
| By Application | Oncology |
| Cardiology | |
| Neurology and Spine | |
| Orthopedics and Musculoskeletal | |
| Women's Health and Obstetrics | |
| General Imaging | |
| By Site of Care | Hospital-based Imaging Departments |
| Freestanding Imaging Centers | |
| Community Diagnostic Centers and Polyclinic Hubs | |
| Mobile Imaging Units | |
| By Delivery Model | Owned and Operated Networks |
| Hospital Joint Ventures | |
| Managed Services and Outsourcing Contracts | |
| Teleradiology-enabled Networks | |
| By Payor | Commercial and Employer-sponsored Plans |
| Medicare | |
| Medicaid | |
| Self-pay | |
| Others |


Key Questions Answered in the Report
What is the 2026 size of US diagnostic imaging services?
The US diagnostic imaging services market stands at USD 203.09 billion in 2026 and is projected to reach USD 257.35 billion by 2031 at a 4.85% CAGR.
Which modality is growing the fastest in diagnostic imaging services in the United States?
Computed Tomography is the fastest-growing modality, with a projected 6.38% CAGR through 2031, while X-ray remains the largest modality by 2025 revenue share at 28.31%.
Which application generates the most imaging revenue in the United States?
Oncology leads with 33.24% of revenue in 2025 because cancer care typically requires repeated imaging across screening, staging, treatment response, and follow-up.
Why are freestanding imaging centers expanding faster than hospitals?
Freestanding Imaging Centers are projected to grow at 6.25% CAGR through 2031 because they combine outpatient convenience, lower-cost positioning, and scalable scheduling and technology deployment.
How is Medicare affecting imaging provider economics in 2026?
Medicare is the fastest-growing payor at 6.61% CAGR through 2031, but reimbursement pressure remains a challenge because the CY 2025 Medicare conversion factor fell to USD 32.35 per RVU.
What are the biggest competitive shifts taking place in U.S. imaging services?
Consolidation, AI deployment, and joint venture expansion are the main shifts, with RadNet, Lumexa Imaging, and Radiology Partners using capital, technology, and network reach to strengthen their positions.
Page last updated on:





