Green DevOps and Carbon-Aware CI/CD Software Market Size and Share
Market Overview
| Study Period | 2020 - 2031 |
|---|---|
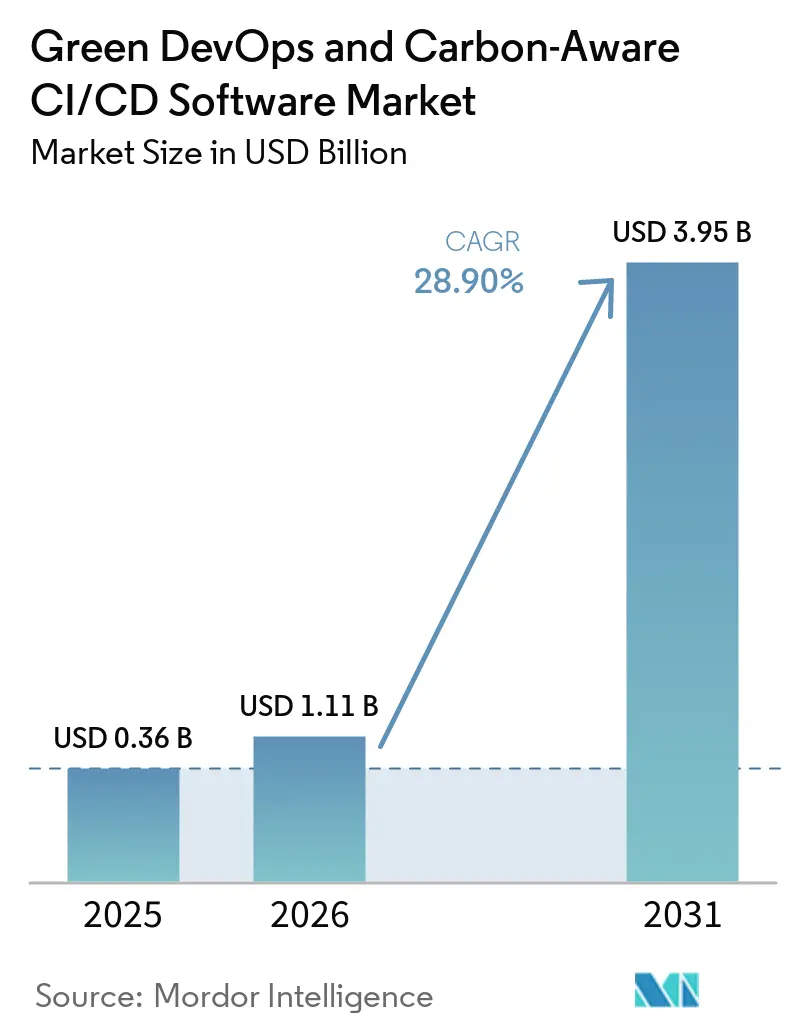
| Market Size (2026) | USD 1.11 Billion |
| Market Size (2031) | USD 3.95 Billion |
| Growth Rate (2026 - 2031) | 28.90% CAGR |
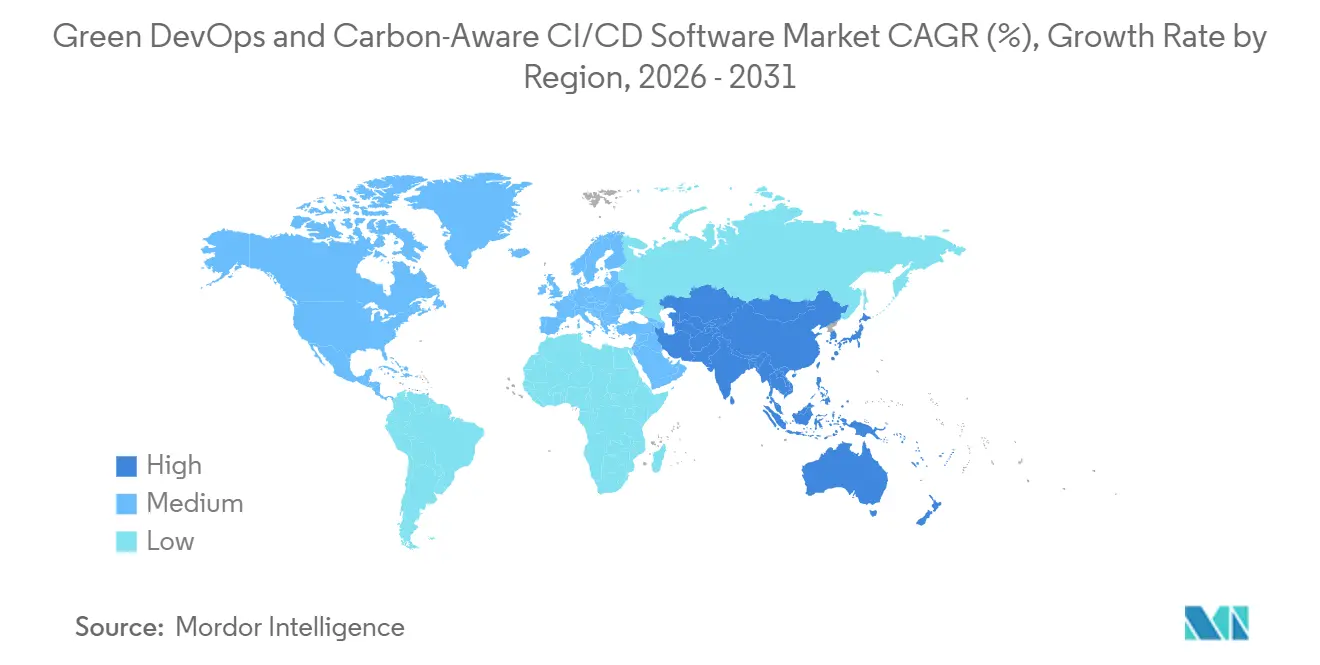
| Fastest Growing Market | Asia-Pacific |
| Largest Market | Europe |
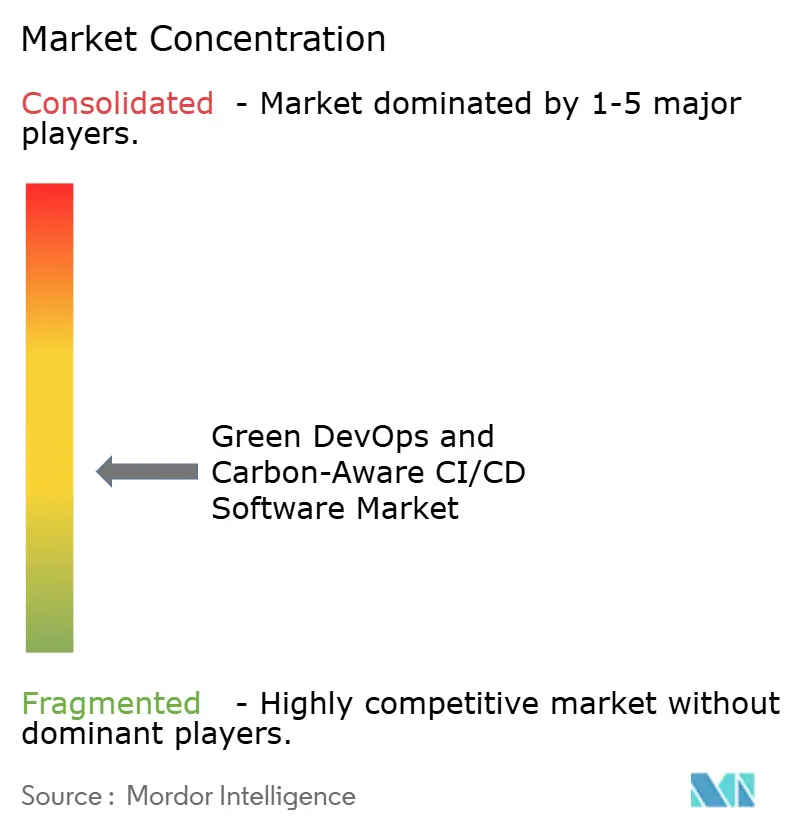
| Market Concentration | Medium |
Major Players *Disclaimer: Major Players sorted in no particular order Image © Mordor Intelligence. Reuse requires attribution under CC BY 4.0. | |
Green DevOps and Carbon-Aware CI/CD Software Market Analysis by Mordor Intelligence
The Green DevOps and Carbon-Aware CI/CD Software Market size is expected to increase from USD 0.36 billion in 2025 to USD 1.11 billion in 2026 and reach USD 3.95 billion by 2031, growing at a CAGR of 28.90% over 2026-2031. The sharp rise in scale between 2025 and 2026 reflected stronger enterprise awareness of the ISO/IEC 21031:2024 Software Carbon Intensity standard and the move toward auditable measurement of software emissions. At the same time, the EU Corporate Sustainability Reporting Directive pushed software emissions from a discretionary topic into a reporting and compliance issue for many large enterprises with European exposure. Buying decisions also started to shift because green DevOps tools increasingly sat between engineering, sustainability, and FinOps teams rather than remaining a niche engineering purchase. Data quality differences across regions and cloud providers still slowed adoption in some cases, but they also increased the value of platforms that could normalize carbon data and connect it to reporting workflows. The Green DevOps and Carbon-Aware CI/CD Software Market is also benefiting from the closer link between cloud cost control and carbon reduction, which is making these tools easier to justify within standard operating budgets.
Key Report Takeaways
- By geography, Europe held 34.56% of the Green DevOps and Carbon-Aware CI/CD Software Market in 2025, while Asia-Pacific is projected to expand at a 29.78% CAGR through 2031.
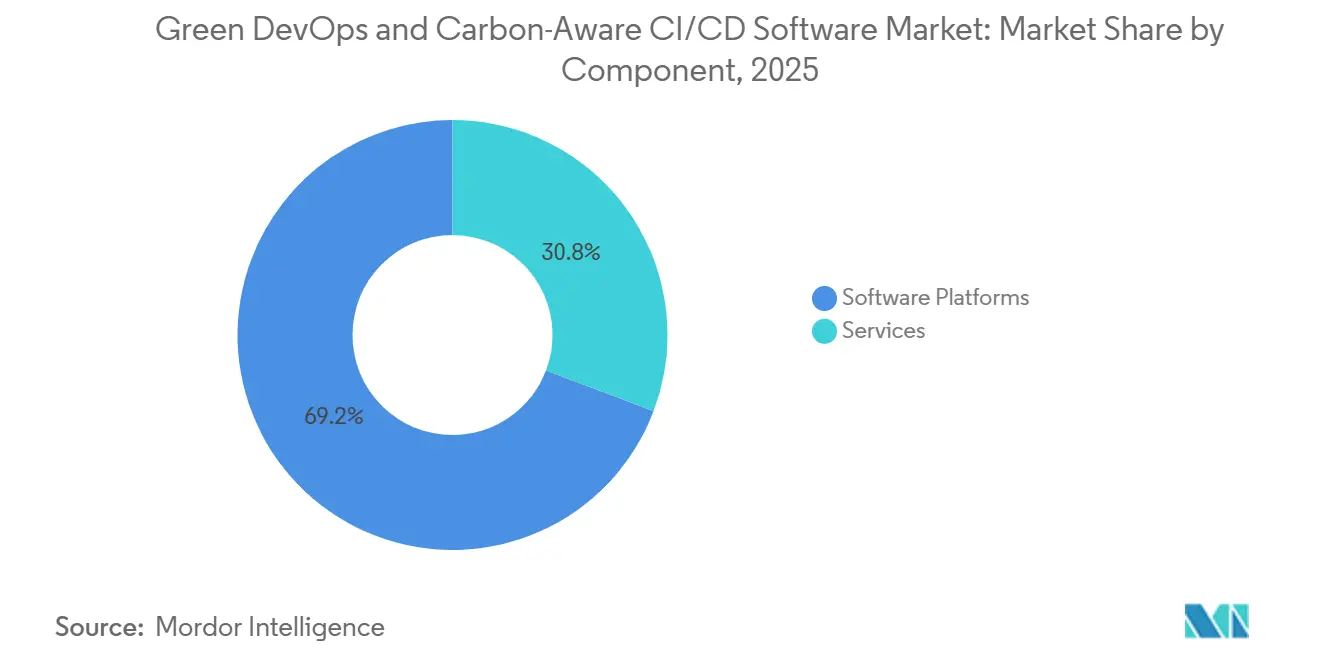
- By component, Software Platforms accounted for 69.24% of revenue in 2025, while Governance and Policy Automation is projected to grow at a 29.45% CAGR through 2031.
- By technology, Carbon Measurement and Observability held 28.74% share in 2025, while Green DevOps Toolchain Integration is expected to expand at a 30.12% CAGR through 2031.
- By enterprise size, Large Enterprises accounted for 65.34% of revenue in 2025, while SMEs are projected to grow at a 29.87% CAGR through 2031.
- By deployment mode, Cloud-Based deployment captured 67.84% of the market in 2025, while Hybrid deployment is forecast to grow at a 29.12% CAGR through 2031.
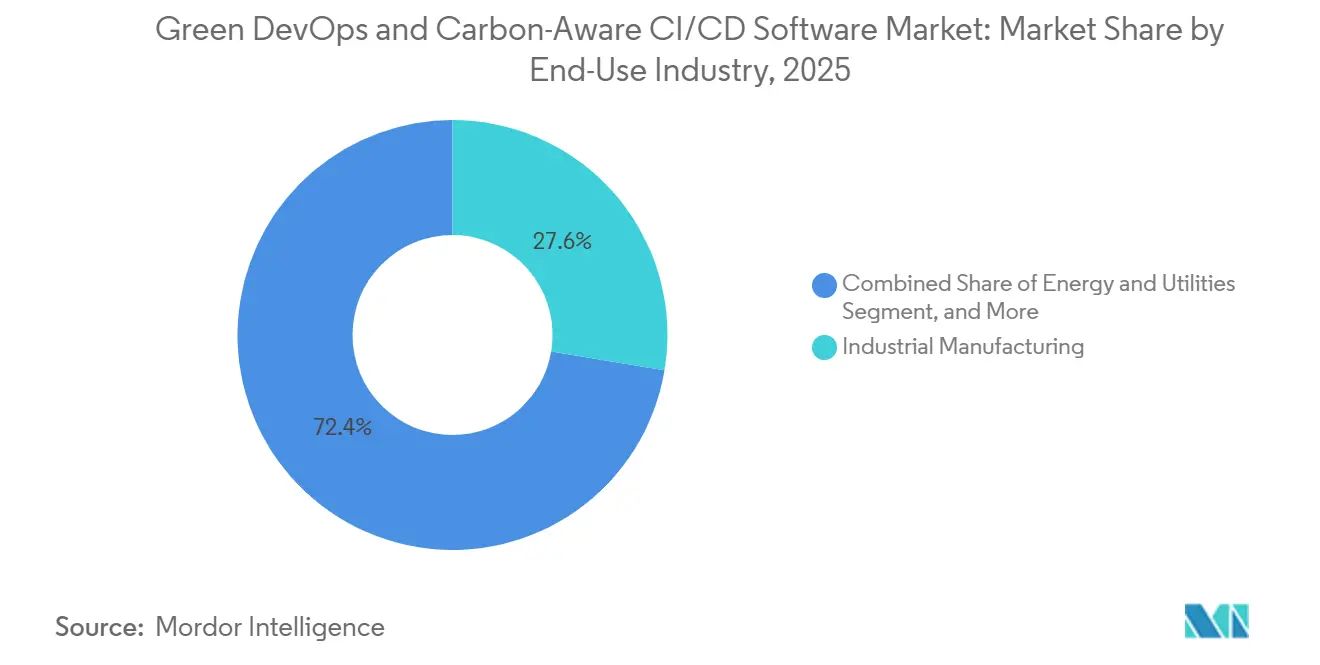
- By end-use industry, Industrial Manufacturing led with 27.63% share in 2025, while Energy and Utilities is projected to record a 28.97% CAGR through 2031.
Note: Market size and forecast figures in this report are generated using Mordor Intelligence’s proprietary estimation framework, updated with the latest available data and insights as of January 2026.
Global Green DevOps and Carbon-Aware CI/CD Software Market Trends and Insights
Drivers Impact Analysis*
| Driver | (~) % Impact on CAGR Forecast | Geographic Relevance | Impact Timeline |
|---|---|---|---|
| Rising Demand for Auditable Software Emissions Reduction | 5.2% | Global, with highest intensity in EU and UK | Short term (≤ 2 years) |
| Integration of Carbon Metrics Into CI/CD Governance | 4.8% | Global, spearheaded by North America and EU | Short term (≤ 2 years) |
| Shift Toward Carbon-Aware Workload Scheduling in Cloud-Native Pipelines | 4.5% | North America, EU, APAC core | Medium term (2-4 years) |
| Growing Enterprise Preference for Green FinOps and Sustainability Reporting Convergence | 3.9% | North America and EU, spill-over to APAC | Medium term (2-4 years) |
| Expansion of Policy-Driven DevSecOps and Sustainability Controls | 3.4% | EU and UK, emerging in APAC | Medium term (2-4 years) |
| Adoption of Low-Latency Carbon Intensity APIs and Automated Decision Engines | 2.8% | Global, led by North America and EU | Long term (≥ 4 years) |
| Source: Mordor Intelligence | |||
Rising Demand for Auditable Software Emissions Reduction
The Green DevOps and Carbon-Aware CI/CD Software Market is gaining from the fact that enterprise software pipelines now sit much closer to Scope 3 disclosure needs under the EU CSRD.[1]European Commission, “Corporate Sustainability Reporting - CSRD,” European Commission, ec.europa.eu ESRS E1 requires disclosure of material Scope 3 categories, which increases the need for records traceable to specific software workloads rather than broad companywide estimates. A 2024 study of the GitHub Actions ecosystem estimated annual emissions of 456.9 metric tons of CO2e in its most likely scenario, which helped make CI/CD emissions visible as a measurable operational issue rather than an abstract sustainability topic. ISO/IEC 21031:2024 provided enterprises with a common method for converting job-level telemetry into a consistent Software Carbon Intensity score, making internal reporting and audit preparation much easier to structure. As a result, the Green DevOps and Carbon-Aware CI/CD Software Market is moving faster because companies that cannot produce per-pipeline carbon records face a higher risk of weak assurance outcomes and slower compliance workflows.
Integration of Carbon Metrics Into CI/CD Governance
The Green DevOps and Carbon-Aware CI/CD Software Market is also expanding because carbon metrics are being embedded into CI/CD governance alongside security, quality, and cost controls.[2]GitLab, “Pipeline Sustainability,” GitLab Docs, docs.gitlab.com GitLab’s pipeline sustainability documentation showed that Eco CI can calculate SCI scores for CI/CD jobs by mapping CPU utilization to established power curves, providing engineering teams with a direct way to measure emissions within familiar workflows. This changes operating behavior because carbon gates can be applied at the merge request stage, which lets teams prevent avoidable emissions before code reaches production instead of reviewing the problem after the reporting period closes. A 2025 study focused on Siemens described a Green DevOps framework that used sustainability-based KPIs across DevOps teams and prioritized the operations phase, where SCI measurement could yield the clearest near-term results. That pattern supports stronger demand in the Green DevOps and Carbon-Aware CI/CD Software Market, as buyers increasingly want governance features within the delivery pipeline rather than a separate carbon reporting layer bolted on later.
Shift Toward Carbon-Aware Workload Scheduling in Cloud-Native Pipelines
The Green DevOps and Carbon-Aware CI/CD Software Market is further supported by the shift toward moving CI/CD workloads across time and regions to use cleaner electricity without changing application code. The Carbon Aware SDK, which reached Graduated status and has been deployed by UBS and Vestas, demonstrated that carbon-aware scheduling can reduce SCI scores by nearly 15% for comparable workloads. The ratification of the Real Time Energy and Carbon Standard for Cloud Providers in April 2025 established a shared format for how AWS, Microsoft Azure, and Google Cloud can expose energy and carbon data, which is important because schedulers need consistent inputs across clouds. Electricity Maps and WattTime provide the data layer for this process, with real-time carbon intensity coverage, extended forecast capabilities, and updated emissions models that improve routing accuracy for software workloads. Google’s use of Electricity Maps hourly carbon intensity forecasts to route compute workloads confirmed that the scheduling model behind the Green DevOps and Carbon-Aware CI/CD Software Market is already viable at production scale.[3]Green Software Foundation, “Carbon Aware SDK Adopters,” Green Software Foundation, carbon-aware-sdk.greensoftware.foundation
Growing Enterprise Preference for Green FinOps and Sustainability Reporting Convergence
The Green DevOps and Carbon-Aware CI/CD Software Market is also benefiting from the fact that cloud cost control and carbon reduction rely on many of the same operating levers, including rightsizing, removing idle resources, and improving job timing. Flexera’s 2026 State of the Cloud Report found that nearly one-third of respondents now treat cost optimization and carbon reduction as equal priorities, strengthening the business case for tools that serve both goals simultaneously. The 2026 State of FinOps Report also showed that sustainability and ESG were becoming more active collaboration areas for FinOps teams, especially in Europe and Asia. In practice, CI/CD platforms are where both decisions meet because cost rules and carbon rules are enforced through the same pipeline actions, scheduling logic, and reporting workflows. That convergence gives the Green DevOps and Carbon-Aware CI/CD Software Market a broader budget path, as buyers can justify spending through both cloud efficiency and disclosure-readiness rather than sustainability goals alone.
Restraints Impact Analysis*
| Restraint | (~) % Impact on CAGR Forecast | Geographic Relevance | Impact Timeline |
|---|---|---|---|
| Fragmented Carbon Data Quality Across Regions and Cloud Providers | -2.80% | Global, most acute in APAC, MEA, and South America | Short term (≤ 2 years) |
| High Integration Complexity With Legacy CI/CD and Multi-Cloud Environments | -2.40% | Global, most pronounced in large enterprises with heterogeneous toolchains | Medium term (2-4 years) |
| Limited Internal Skills in Green Software Engineering and Carbon Accounting | -1.90% | APAC, MEA, and South America | Medium term (2-4 years) |
| Unclear Budget Ownership Between Engineering, Sustainability, and FinOps Teams | -1.50% | Global, most pronounced in mid-market enterprises | Short term (≤ 2 years) |
| Source: Mordor Intelligence | |||
Fragmented Carbon Data Quality Across Regions and Cloud Providers
The Green DevOps and Carbon-Aware CI/CD Software Market still faces a major barrier because carbon-intensity data is not consistently available across cloud providers, regions, and grid systems. The Real Time Cloud release in 2025 acknowledged that normalized cloud datasets still depended on projected estimates rather than fully current operating data, which weakens audit confidence for companies that need defensible reporting trails. The carbon intensity gap between some cloud regions can be extremely large, and that means enterprises that run pipelines across regions without hourly local data can misstate the emissions profile of those workloads. This issue is more severe in parts of Asia-Pacific, the Middle East, and Africa, and South America because data coverage is thinner and updates are less uniform than in North America and Europe. Until granular and near-real-time carbon data becomes more standard across all major cloud regions, the Green DevOps and Carbon-Aware CI/CD Software Market will continue to face slower adoption in reporting-sensitive deployments.[4]Electricity Maps, “New 72-Hour Grid Forecasts: Advanced Load Optimization for Greater Carbon and Cost Savings,” Electricity Maps, electricitymaps.com
High Integration Complexity With Legacy CI/CD and Multi-Cloud Environments
The Green DevOps and Carbon-Aware CI/CD Software Market also faces slower deployment cycles in large enterprises that still run mixed CI/CD stacks across Jenkins, TeamCity, on-premises GitLab, GitHub Actions, and provider-specific deployment tools. In these settings, carbon measurement agents, scheduling hooks, and ESG connectors often need to be configured separately for each tool, runner type, and cloud region, which raises implementation cost and delays rollout. JFrog’s 2024 sustainability report showed that a 30% cut in production-environment carbon footprint came through targeted chipset optimization, and that narrow example illustrates how difficult broad instrumentation can be even for a platform vendor with direct infrastructure control. Multi-cloud use adds another layer of work because teams must reconcile region names, hardware metadata, and power usage assumptions before a single pipeline run can be tied to a reliable emissions figure. For large accounts with thousands of pipelines, that complexity keeps the Green DevOps and Carbon-Aware CI/CD Software Market from moving as quickly as it does in cloud-native environments built on cleaner, more unified tooling stacks.
*Our forecasts treat driver/restraint impacts as directional, not additive. The impact forecasts reflect baseline growth, mix effects, and variable interactions.
Segment Analysis
By Component: Software Platforms Anchor Revenue as Policy Automation Accelerates
Software Platforms accounted for 69.24% of revenue in 2025, making them the largest component of the Green DevOps and Carbon-Aware CI/CD Software Market and reflecting buyer preference for integrated platforms over assembled point tools. Enterprises generally started with measurement because SCI scoring had to be in place before scheduling, governance, and reporting actions could be applied with confidence. That pattern favored platform vendors that could combine measurement, scheduling, and reporting within a single delivery layer, rather than asking buyers to stitch together separate tools. It also supported the early commercial advantage of vendor-managed offerings that reduced the operational burden on internal platform teams.
Services continued to grow because many buyers still needed help with implementation, SCI calibration, policy design, and ongoing green software engineering support. Governance and Policy Automation was the fastest-growing component, with a 29.45% CAGR, reflecting a shift from passive measurement to controls that can block, reroute, or defer pipeline activity based on carbon conditions. Siemens’ Green DevOps framework showed how sustainability KPIs could be embedded into operational governance rather than left as a once-a-year reporting exercise. The Carbon Aware SDK deployments at UBS and Vestas also indicated that the Green DevOps and Carbon-Aware CI/CD Software industry was moving toward code-driven policy control rather than manual rule-setting alone.


By Deployment Mode: Cloud Dominance Persists as Hybrid Gains Regulatory Momentum
Cloud-Based deployment accounted for 67.84% of the market in 2025, making it the dominant mode across the Green DevOps and Carbon-Aware CI/CD Software Market, as cloud-hosted runners integrate more easily with carbon-intensity data and built-in sustainability dashboards. Microsoft Azure Carbon Optimization and Google Cloud Carbon Footprint also strengthened the appeal of cloud environments by giving customers baseline emissions visibility without requiring separate measurement layers. Cloud-native architectures were better suited to temporal and geographic workload shifting, which is central to carbon-aware pipeline scheduling. As a result, the cloud model remained the easiest entry point for enterprises that wanted fast adoption with lower setup friction.
Hybrid deployment was the fastest-growing mode, with a 29.12% CAGR through 2031, and growth was strongest in regulated settings where some workloads still had to remain on-premises. BFSI and government users were especially relevant because they needed to retain control over sensitive execution environments while still supporting Scope 3 reporting workflows. On-premises deployment remained the smallest mode, but it still mattered in air-gapped and sovereign environments where local telemetry had to substitute for cloud-provider carbon APIs. The Green DevOps and Carbon-Aware CI/CD Software Market is therefore not moving toward a cloud-only architecture, because many buyers need orchestration layers that can normalize carbon data across both cloud and on-premises infrastructure.
By Enterprise Size
Large Enterprises commanded 65.34% of revenue in 2025, giving them the leading position in the Green DevOps and Carbon-Aware CI/CD Software Market and reflecting their heavier regulatory exposure and stronger budget capacity. Many of these organizations were already dealing with early reporting waves tied to European sustainability disclosure rules, so pipeline-level carbon records became an operational requirement rather than a future option. Their buying process also tended to involve senior leadership because the toolset affected engineering governance, sustainability reporting, and cloud spend simultaneously. That made large enterprises the volume anchor even when deployment cycles were longer, and integration work was more complex.
SMEs were the fastest-growing cohort, with a 29.87% CAGR through 2031, largely because disclosure obligations were expanding and SaaS delivery reduced the need for internal carbon accounting expertise. The Green DevOps and Carbon-Aware CI/CD Software Market size for SMEs is therefore rising through a lower-friction adoption model that favors quick onboarding over custom deployment. Smaller firms also benefit from the fact that cloud-based tools can package measurement, reporting, and basic scheduling into a single subscription rather than a large transformation project. The industry is likely to see especially early SME uptake in IT and Telecom, where pipeline intensity is high, and cloud efficiency already sits close to everyday unit economics.
By End-Use Industry: Industrial Manufacturing Leads as Energy and Utilities Accelerates
Industrial Manufacturing held a 27.63% share in 2025, giving it the leading position in the Green DevOps and Carbon-Aware CI/CD Software Market, as large manufacturers increasingly treat software emissions as part of a broader digital decarbonization agenda. Many large industrial groups had to align operational technology, enterprise IT, and sustainability programs, which made Green DevOps tools more relevant than a narrow engineering add-on. Siemens’ published framework provided a usable example of how sustainability KPIs could be applied across DevOps teams and linked to life-cycle thinking in industrial settings. That helped strengthen demand from manufacturers that wanted auditable methods rather than isolated pilot projects.
Energy and Utilities was the fastest-growing vertical at 28.97% CAGR through 2031 because the sector had to manage both its own software delivery footprint and the software systems that support carbon-aware scheduling for others. This gave the sector a more direct commercial reason to invest in CI/CD carbon controls than many other verticals. BFSI also remained important because institutions faced disclosure pressure and ran high-value computing environments where carbon-aware scheduling could be tested at scale, as shown by UBS’s production deployment of the Carbon Aware SDK. Oil and Gas, IT and Telecom, and Retail and E-Commerce were each adopting at different speeds, but the common pattern was that pipeline emissions moved higher on the agenda when software delivery had a material link to reporting obligations or cloud cost performance.

By Technology: Carbon Measurement Establishes the Baseline as Toolchain Integration Leads Growth
Carbon Measurement and Observability held 28.74% of the Green DevOps and Carbon-Aware CI/CD Software market share in 2025, reflecting the early adoption rule that organizations tend to measure first before they optimize or automate. ISO/IEC 21031:2024 played a major role by providing buyers with a recognized framework for determining how pipeline telemetry should translate into a consistent carbon score. That made observability the starting point for vendor selection, especially when enterprises needed results that could be discussed with sustainability and audit teams. It also explains why measurement tools built the initial commercial base even as more advanced governance products gained attention.
Green DevOps Toolchain Integration was the fastest-growing technology segment, with a 30.12% CAGR through 2031, as buyers increasingly sought carbon-aware actions within the delivery pipeline rather than through separate dashboards. Reporting and ESG Analytics gained support from the requirement to connect CI/CD records more directly to formal disclosure workflows under ESRS E1. ISO/IEC TS 20125-1:2026 widened the compliance scope further by extending ecodesign thinking across the software life cycle, which supports demand for deeper toolchain-level integration rather than stand-alone measurement alone. The Green DevOps and Carbon-Aware CI/CD Software Market size attached to native integration is therefore expanding faster because enterprises now want measurement, policy, and reporting to operate as a single continuous workflow.
Geography Analysis
Europe held 34.56% of the Green DevOps and Carbon-Aware CI/CD Software market size in 2025, making it the leading regional block and reflecting the most prescriptive regulatory setting for software-related emissions disclosure. The EU CSRD and ESRS E1 framework pushed many large companies to treat software emissions records as part of formal reporting readiness rather than voluntary ESG work. The reporting threshold structure for large EU companies added urgency, as enterprises meeting the main size criteria moved directly into disclosure cycles that were published in 2026. Germany, the United Kingdom, and France remained the most active procurement markets because they combine large industrial, financial, and technology bases with stronger sustainability compliance pressure. Europe also developed local supply-side capabilities through players such as Greenspector SAS and EasyVirt SAS, which supported regional demand for auditable, locally understandable measurement methods.
North America ranked second in the Green DevOps and Carbon-Aware CI/CD Software Market and remained central to the vendor landscape because many leading CI/CD platform providers are based there. The region did not have the same direct CSRD force as Europe, but voluntary climate commitments and disclosure pressure still supported demand from large listed enterprises. Microsoft’s February 2026 renewable electricity milestone strengthened the credibility of Azure-linked sustainability data for enterprises using Azure-hosted CI/CD runners. FinOps and sustainability collaboration also became more visible in the region, which helped move platform engineering teams closer to corporate carbon governance work.
Asia-Pacific was the fastest-growing geography, with a 29.78% CAGR through 2031, reflecting a mix of cloud-native growth, export-linked compliance exposure, and expanding climate disclosure rules. India benefited from its role in software exports because firms serving EU clients increasingly faced sustainability expectations through customer supply chains. Australia added momentum through climate disclosure frameworks aligned with ISSB IFRS S2, while South Korea and Japan offered strong enterprise software bases and active decarbonization agendas. The Middle East and Africa remain at an earlier stage, but software emissions measurement is becoming more relevant in government and energy settings tied to net-zero and clean-energy programs. South America remained nascent but moved into clearer view as hyperscale infrastructure expansion improved the regional coverage needed for carbon-aware routing and measurement. Across all these markets, the Green DevOps and Carbon-Aware CI/CD Software Market is growing fastest, where cloud adoption, sustainability reporting, and software delivery intensity are moving in step.

Competitive Landscape
The Green DevOps and Carbon-Aware CI/CD Software Market was moderately fragmented, with broad platform vendors such as GitLab, GitHub, Harness, JFrog, and Atlassian expanding carbon-related features while specialist providers such as Electricity Maps, WattTime, Greenspector, and EasyVirt supplied the data and observability layer behind those decisions. Competitive momentum increasingly favored vendors that embedded carbon controls inside the delivery pipeline rather than offering a stand-alone dashboard with limited operational effect. That shift mattered because enterprise buyers wanted a single governance surface that could manage security, delivery quality, cloud efficiency, and carbon actions within a single workflow. The market also remained open because no supplier appeared to hold dominant control over the full stack of data, orchestration, and reporting. This left space for both specialist tools and larger platforms to shape different parts of the value chain.
JFrog provided a clear example of strategy through its 2024 sustainability report, which disclosed a 90% reduction in digital signature data transfer, delivering 23 metric tons of CO2 savings, and a 30% reduction in the production-environment carbon footprint through chipset optimization. That mattered competitively because it allowed the company to point to internal operating results as evidence for how artifact management and caching can reduce CI/CD waste. GitLab also strengthened its position with the May 2026 release of GitLab 18.11, which introduced a CI Expert Agent that can propose pipeline configurations in natural language and push carbon-aware pipeline design closer to the code-suggestion stage. In May 2026, GitLab 19.0 added supply chain visibility and orchestration features that supported broader governance across the software delivery path. These moves showed that the competitive race was not only about measurement accuracy, but also about how deeply sustainability logic could be woven into everyday developer workflows.
Open-source tools remained an important competitive factor in the Green DevOps and Carbon-Aware CI/CD Software Market, as the Carbon-Aware SDK reached Graduated status and demonstrated production usefulness through enterprise deployments. Electricity Maps also added practical value through its Airflow scheduler approach and broader real-time and forecast data coverage, helping reduce the need for custom development for carbon-aware orchestration. ISO/IEC 21031:2024 compliance was becoming a clear qualification point because buyers and assurance teams increasingly wanted measurement methods that aligned with a recognized standard. As a result, vendors without deep integration or alignment with standards faced a higher barrier to winning larger enterprise contracts.
Green DevOps and Carbon-Aware CI/CD Software Industry Leaders
GitLab Inc.
Harness Inc.
Atlassian Corporation
CloudBees, Inc.
JFrog Ltd.
- *Disclaimer: Major Players sorted in no particular order

Recent Industry Developments
- May 2026: GitLab released GitLab 19.0, introducing supply chain visibility, agentic merge request workflows, CI pipeline visibility improvements, and self-hosted open-source model support. The release advanced GitLab's position as an intelligent orchestration platform for DevSecOps, with supply chain visibility directly relevant to carbon-aware governance of software artifacts across the CI/CD workflow.
- May 2026: GitLab released GitLab 18.11, introducing a CI Expert Agent, in beta, that inspects repositories, identifies language and framework, and proposes build-and-test pipelines in natural language, targeting pipeline setup in minutes without manual YAML configuration. The Data Analyst Agent was made generally available, enabling natural-language queries over pipeline health, deployment frequency, and merge request cycle times.
- March 2026: WattTime released updated North America marginal emissions data models, model version 2026-03-01, which became the API default on March 18, 2026. The new models increased the CO2-reduction opportunity by 25% overall, directly improving the accuracy of carbon-aware scheduling for CI/CD platforms that integrate WattTime's API into pipeline routing decisions.
- February 2026: Microsoft announced achievement of its 100% annual global electricity consumption matched with renewable energy milestone, a commitment originally made in 2020. The milestone improved the reliability of Azure Carbon Optimization emissions data for enterprises running Azure-hosted CI/CD pipelines and strengthened Microsoft's position as a trusted sustainability data provider for the green DevOps ecosystem.


Global Green DevOps and Carbon-Aware CI/CD Software Market Report Scope
The Green DevOps and Carbon-Aware CI/CD Software market refers to platforms and services that integrate sustainability intelligence into DevOps practices and IT operations. These solutions provide capabilities such as carbon measurement and observability, carbon-aware workload optimization, governance and policy automation, ESG reporting and analytics, and toolchain integration for sustainable DevOps. By embedding carbon-awareness into software development, testing, deployment, and workload orchestration, these systems enable organizations to reduce energy consumption, optimize resource utilization, and align IT operations with sustainability and decarbonization goals.
The Green DevOps and Carbon-Aware CI/CD Software market report is segmented by Component (Software Platforms and Services), Deployment Mode (Cloud-Based, Hybrid, and On-Premises), Enterprise Size (Large Enterprises, and Small and Medium Enterprises), End-Use Industry (Industrial Manufacturing, Energy and Utilities, Oil and Gas, IT and Telecom, Retail and E-Commerce, Food and Beverage Manufacturing, Construction and Infrastructure, Transportation and Logistics, BFSI, Government and Public Sector, and Other End-User Industries), Technology (Carbon Measurement and Observability, Carbon-Aware Workload Optimization, Governance and Policy Automation, Reporting and ESG Analytics, Green DevOps Toolchain Integration), and Geography (North America, South America, Europe, Asia-Pacific, Middle East, and Africa). The Market Forecasts are Provided in Terms of Value (USD).
| Software Platforms |
| Services |
| Cloud-Based |
| Hybrid |
| On-Premises |
| Large Enterprises |
| Small and Medium Enterprises |
| Industrial Manufacturing |
| Energy and Utilities |
| Oil and Gas |
| IT and Telecom |
| Retail and E-Commerce |
| Food and Beverage Manufacturing |
| Construction and Infrastructure |
| Transportation and Logistics |
| BFSI |
| Government and Public Sector |
| Other End-User Industries |
| Carbon Measurement and Observability |
| Carbon-Aware Workload Optimization |
| Governance and Policy Automation |
| Reporting and ESG Analytics |
| Green DevOps Toolchain Integration |
| North America | United States |
| Canada | |
| Mexico | |
| South America | Brazil |
| Rest of South America | |
| Europe | Germany |
| United Kingdom | |
| France | |
| Italy | |
| Spain | |
| Russia | |
| Rest of Europe | |
| Asia-Pacific | China |
| India | |
| Japan | |
| South Korea | |
| Australia | |
| Rest of Asia-Pacific | |
| Middle East | Turkey |
| Saudi Arabia | |
| United Arab Emirates | |
| Rest of Middle East | |
| Africa | South Africa |
| Nigeria | |
| Rest of Africa |
| By Component | Software Platforms | |
| Services | ||
| By Deployment Mode | Cloud-Based | |
| Hybrid | ||
| On-Premises | ||
| By Enterprise Size | Large Enterprises | |
| Small and Medium Enterprises | ||
| By End-Use Industry | Industrial Manufacturing | |
| Energy and Utilities | ||
| Oil and Gas | ||
| IT and Telecom | ||
| Retail and E-Commerce | ||
| Food and Beverage Manufacturing | ||
| Construction and Infrastructure | ||
| Transportation and Logistics | ||
| BFSI | ||
| Government and Public Sector | ||
| Other End-User Industries | ||
| By Technology | Carbon Measurement and Observability | |
| Carbon-Aware Workload Optimization | ||
| Governance and Policy Automation | ||
| Reporting and ESG Analytics | ||
| Green DevOps Toolchain Integration | ||
| By Geography | North America | United States |
| Canada | ||
| Mexico | ||
| South America | Brazil | |
| Rest of South America | ||
| Europe | Germany | |
| United Kingdom | ||
| France | ||
| Italy | ||
| Spain | ||
| Russia | ||
| Rest of Europe | ||
| Asia-Pacific | China | |
| India | ||
| Japan | ||
| South Korea | ||
| Australia | ||
| Rest of Asia-Pacific | ||
| Middle East | Turkey | |
| Saudi Arabia | ||
| United Arab Emirates | ||
| Rest of Middle East | ||
| Africa | South Africa | |
| Nigeria | ||
| Rest of Africa | ||


Key Questions Answered in the Report
What is the current and forecast value of the Green DevOps and Carbon-Aware CI/CD Software Market?
The Green DevOps and Carbon-Aware CI/CD Software Market stood at USD 1.11 billion in 2026 and is forecast to reach USD 3.95 billion by 2031, growing at a 28.90% CAGR over 2026-2031.
Which region leads adoption of carbon-aware CI/CD tools?
Europe led in 2025 with a 34.56% share, mainly because the CSRD and ESRS E1 framework created the strongest compliance pull for auditable software emissions records.
Which deployment model is used the most for Green DevOps platforms?
Cloud-Based deployment held 67.84% share in 2025 because cloud-hosted runners connect more easily with carbon data sources and built-in sustainability dashboards.
Which technology area is growing the fastest in this space?
Green DevOps Toolchain Integration is projected to grow at a 30.12% CAGR through 2031 as buyers shift from stand-alone measurement tools to native automation inside the CI/CD workflow.
Why are large enterprises still the main buyers of these tools?
Large Enterprises held 65.34% of revenue in 2025 because they faced the earliest and strongest reporting pressure and had the budgets to connect engineering, sustainability, and FinOps workflows.
Which end-user group shows the strongest growth outlook?
Energy and Utilities is expected to expand at a 28.97% CAGR through 2031 because the sector must manage its own pipeline emissions while also enabling grid-interactive and carbon-aware software systems.
Page last updated on:


