Software Carbon Intensity (SCI) Measurement Platform Market Size and Share
Market Overview
| Study Period | 2020 - 2031 |
|---|---|
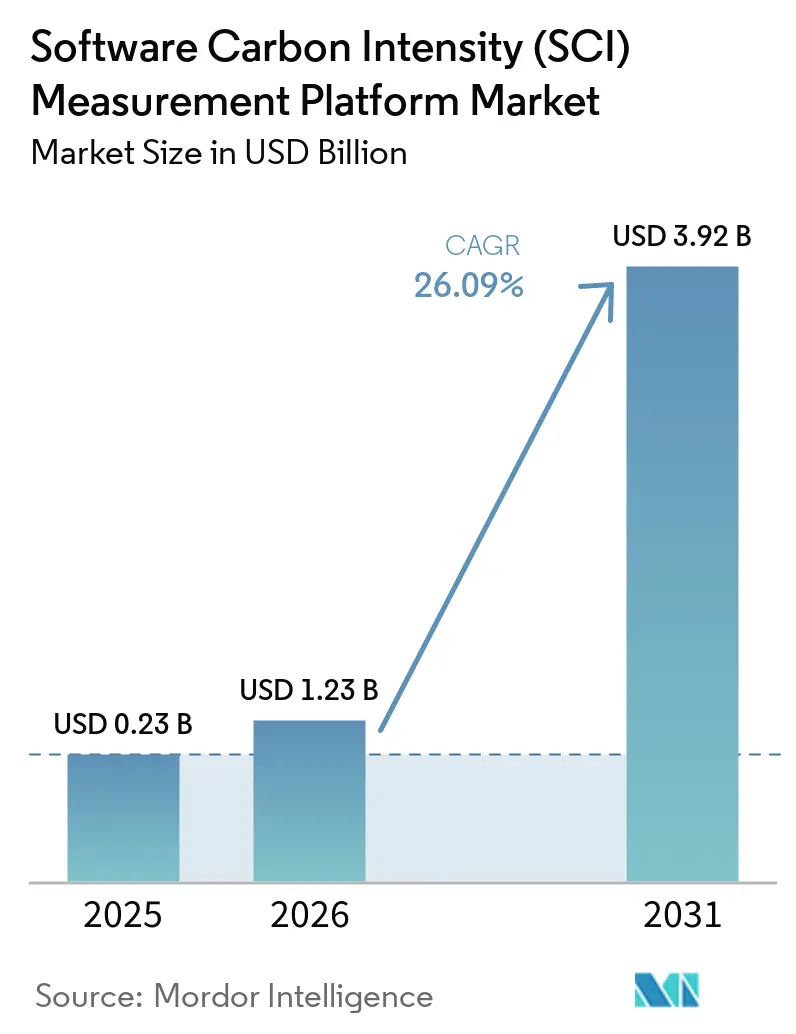
| Market Size (2026) | USD 1.23 Billion |
| Market Size (2031) | USD 3.92 Billion |
| Growth Rate (2026 - 2031) | 26.09% CAGR |
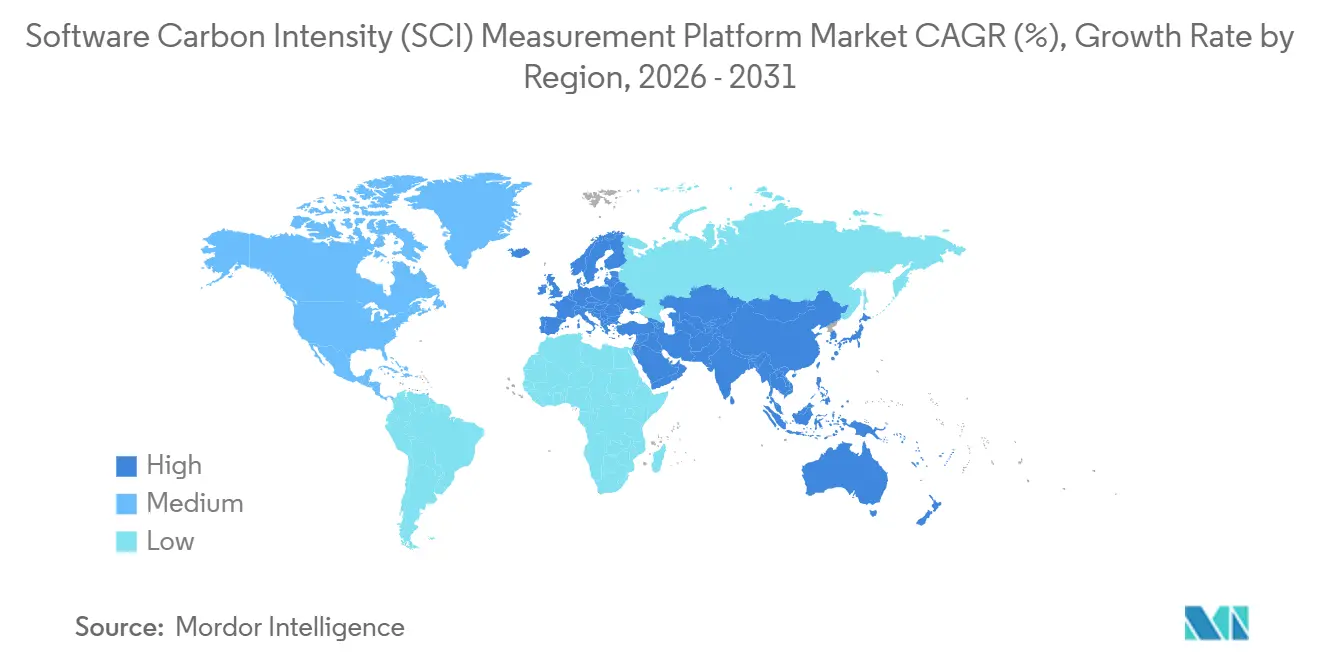
| Fastest Growing Market | Asia-Pacific |
| Largest Market | Europe |
| Market Concentration | Low |
Major Players *Disclaimer: Major Players sorted in no particular order Image © Mordor Intelligence. Reuse requires attribution under CC BY 4.0. | |
Software Carbon Intensity (SCI) Measurement Platform Market Analysis by Mordor Intelligence
The Software Carbon Intensity (SCI) Measurement Platform Market size was valued at USD 0.23 billion in 2025 and estimated to grow from USD 1.23 billion in 2026 to reach USD 3.92 billion by 2031, at a CAGR of 26.09% during the forecast period (2026-2031). The Software Carbon Intensity (SCI) Measurement Platform Market is moving from a niche sustainability software category into a core enterprise reporting and engineering workflow layer because audit-grade emissions disclosure now requires more than spend-based estimates. This shift is becoming more visible as enterprises need emissions data at the application, workload, and development pipeline level, especially when software is a material part of operating models and supplier relationships. Buyer confidence has improved because ISO/IEC 21031:2024 has provided procurement teams and auditors with a recognized software carbon methodology that can be incorporated into contracts, internal controls, and reporting processes. Demand is also widening because cloud cost governance, carbon tracking, and platform engineering are increasingly handled through a single operational data set, making SCI measurement easier to justify as a budgeted workflow rather than a stand-alone ESG purchase. Growth remains strong, but it is still constrained by inconsistent provider data, delayed infrastructure disclosures, and the technical challenges of assigning energy use and embodied emissions within shared and virtualized computing environments.
Key Report Takeaways
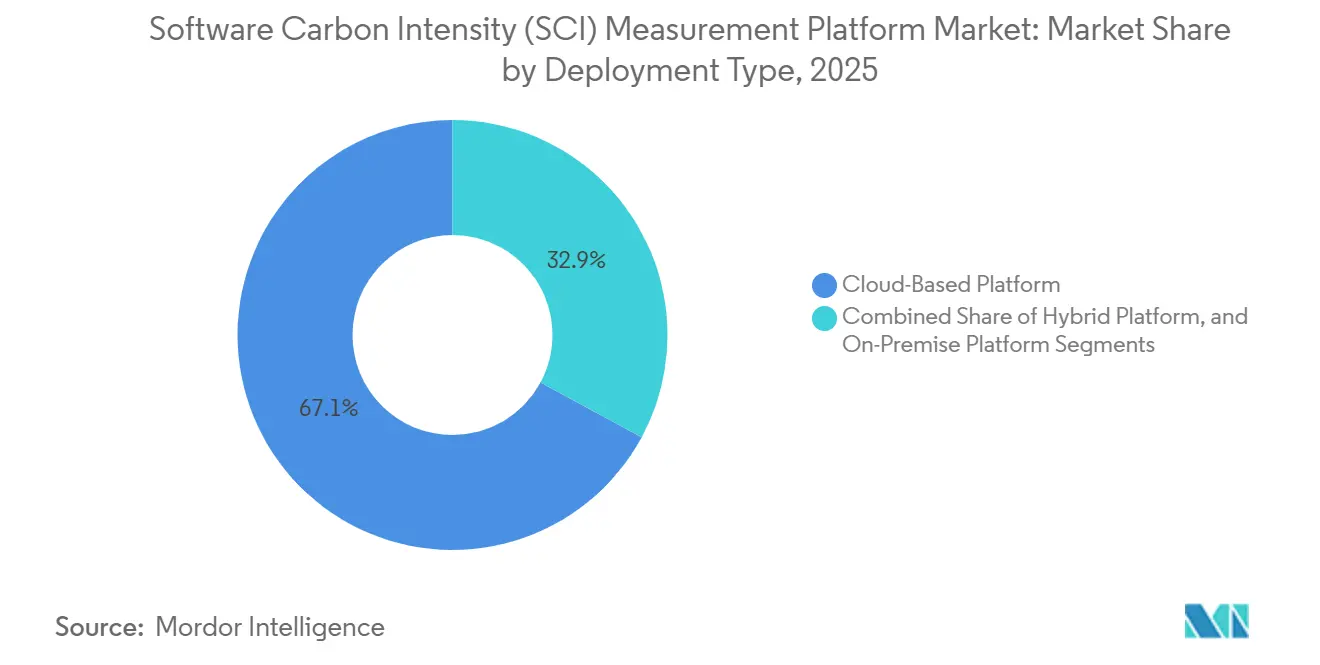
- By deployment type, cloud-based platforms held a 67.12% share in the Software Carbon Intensity (SCI) Measurement Platform Market in 2025, while hybrid platform deployment is projected to expand at a 27.05% CAGR during 2026-2031.
- By enterprise size, large enterprises held 65.34% share in 2025, while SMEs are projected to expand at 27.41% CAGR through 2031.
- By application, Cloud and Infrastructure Carbon Measurement accounted for 29.45% share of the Software Carbon Intensity (SCI) Measurement Platform market size in 2025, while AI and High-Performance Compute Emissions Measurement is projected to advance at 28.12% CAGR during 2026-2031.
- By end-use industry, IT and Telecom held 26.84% of the Software Carbon Intensity (SCI) Measurement Platform market share in 2025, while Retail and E-Commerce is projected to grow at 27.56% CAGR through 2031.
- By geography, Europe accounted for 34.63% of the Software Carbon Intensity (SCI) Measurement Platform market in 2025, while Asia-Pacific is projected to expand at a 28.45% CAGR during 2026-2031.
Note: Market size and forecast figures in this report are generated using Mordor Intelligence’s proprietary estimation framework, updated with the latest available data and insights as of January 2026.
Global Software Carbon Intensity (SCI) Measurement Platform Market Trends and Insights
Drivers Impact Analysis*
| Driver | (~) % Impact on CAGR Forecast | Geographic Relevance | Impact Timeline |
|---|---|---|---|
| Increasing Regulatory Demand for Software Emissions Disclosure | +6.2% | Global, highest intensity in EU and North America | Short term (≤ 2 years) |
| Enterprise Shift to Product-Level Carbon Intensity Metrics | +5.1% | North America and Europe, with adoption spreading to APAC | Medium term (2-4 years) |
| Cloud Cost Optimization Pressure From FinOps Convergence | +4.3% | Global, strongest in North America and Europe | Short term (≤ 2 years) |
| ISO/IEC 21031:2024 Standardization Accelerating Buyer Confidence | +3.5% | Global, especially EU and APAC | Short term (≤ 2 years) |
| Demand for Audit-Ready, Traceable Emissions Data | +2.8% | North America and Europe, with supply-chain spillover to Middle East and Africa | Medium term (2-4 years) |
| Rising AI Workload Energy Visibility Requirements | +2.4% | Global, concentrated in North America and China | Long term (≥ 4 years) |
| Source: Mordor Intelligence | |||
Increasing Regulatory Demand for Software Emissions Disclosure
The Software Carbon Intensity (SCI) Measurement Platform Market is seeing its strongest near-term pull from regulation, as the reporting burden now extends beyond total emissions into documented, reviewable methodology. Wave 1 companies under the Corporate Sustainability Reporting Directive are reporting on 2026 financial-year data in 2027 under ESRS E1, and that requirement pushes organizations toward software-specific measurement that can stand up in assurance reviews. The immediate effect is that broad carbon ledgers built on proxy assumptions are losing usefulness in software-heavy enterprises where cloud activity, product usage, and digital supply chains account for a meaningful share of emissions exposure. The 2025 Omnibus revision narrowed the first mandatory compliance cohort to larger companies, but it did not address the underlying need for robust measurement among enterprises that still sit within the first enforcement wave. The same pressure then moves outward through procurement, as large buyers increasingly expect technology suppliers to provide more specific emissions data rather than broad corporate totals, expanding the addressable market for the Software Carbon Intensity (SCI) Measurement Platform.[1]Normative AB, “Scope 3 Reporting: CSRD and SBTi Requirements (2026),” Normative Insight, normative.io
Enterprise Shift From Static ESG Reporting to Product-Level Carbon Intensity Metrics
The Software Carbon Intensity (SCI) Measurement Platform Market is also being supported by a change in what enterprises want to measure, because entity-level totals do not show how emissions are distributed across applications, releases, or transactions. ISO/IEC 21031:2024 and the Green Software Foundation framework provide teams with a way to express carbon emissions per functional unit, making the metric usable by engineering, platform, and sustainability teams alike. That matters because product and engineering leaders can connect software architecture choices to operational energy use, cloud demand, and reported emissions without relying only on annual disclosure cycles. The Green Software Foundation documented a CAST implementation in which fixing 10 green code deficiencies over 4 person-days reduced annual CO2 emissions by an estimated 400 kg and cut more than 1,000 kWh per application per year, turning measurement into an operational improvement tool rather than a reporting exercise. As a result, the Software Carbon Intensity (SCI) Measurement Platform Market is increasingly tied to software quality, release management, and application modernization programs, not only to ESG reporting budgets.[2]European Commission, “Corporate Sustainability Reporting - Finance,” European Commission, finance.ec.europa.eu
Cloud Cost Optimization Pressure From Sustainability and FinOps Convergence
The Software Carbon Intensity (SCI) Measurement Platform Market is benefiting from FinOps convergence, as cloud spend and cloud emissions both derive from the same underlying consumption data. The FinOps Foundation made Cloud Sustainability an official capability in its 2026 framework update, which signals that carbon tracking is becoming part of the same management discipline used for budgets, utilization, and unit economics. That shift changes procurement logic because platforms that fit into existing cloud governance workflows are easier to justify than tools that sit only inside sustainability teams. It also raises expectations for vendors, as enterprise users increasingly want dashboards, alerts, and workflow actions that connect utilization, efficiency, and emissions within a single operating model. In practice, the Software Carbon Intensity (SCI) Measurement Platform Market benefits from this overlap because organizations can pursue cost control, carbon reduction, and disclosure-readiness through a shared telemetry and governance layer rather than separate systems.[3]Green Software Foundation, “How Do You Measure Software's Carbon Footprint?,” Green Software Foundation, greensoftware.foundation
ISO/IEC 21031:2024 Standardization Accelerating Buyer Confidence
The Software Carbon Intensity (SCI) Measurement Platform Market gained an important credibility boost when ISO/IEC 21031:2024 was formally published on March 22, 2024, because buyers finally had a vendor-neutral standard for software carbon measurement. Before that point, enterprises had to compare vendor claims built on different methods, which made side-by-side evaluation, procurement language, and audit preparation much harder. The Green Software Foundation noted that the standard was developed through a fast, consensus-led process with enterprise contributors including Accenture, Microsoft, NTT DATA, and UBS, which gave it practical relevance beyond a purely academic specification. A v1.1 update followed in October 2024, and active work on an SCI for AI specification continued in 2026, with participation from more than 20 organizations, demonstrating that the framework is expanding with the market rather than lagging behind it. This matters for the Software Carbon Intensity (SCI) Measurement Platform Market because standardized scoring lowers buyer hesitation, shortens evaluation cycles, and makes switching between vendors more realistic when data quality or workflow fit becomes more important.
Restraints Impact Analysis*
| Restraint | (~) % Impact on CAGR Forecast | Geographic Relevance | Impact Timeline |
|---|---|---|---|
| Limited Availability of High-Quality Cloud Provider and Infrastructure Data | -3.2% | Global, highest impact in North America and Europe | Short term (≤ 2 years) |
| Measurement Complexity in Shared, Virtualized, and Multi-Tenant Environments | -2.5% | Global, most acute in APAC and North America | Medium term (2-4 years) |
| Low Internal Readiness of Engineering Teams to Operationalize SCI Workflows | -1.8% | Global, especially emerging APAC and South America SME segments | Medium term (2-4 years) |
| Early-Stage Buyer Familiarity With SCI Standards and Vendor Methodologies | -1.4% | South America, Middle East, Africa, and parts of APAC | Long term (≥ 4 years) |
| Source: Mordor Intelligence | |||
Limited Availability of High-Quality Cloud Provider and Infrastructure Data
The Software Carbon Intensity (SCI) Measurement Platform Market still faces a practical data bottleneck because every downstream report depends on the quality, timing, and comparability of provider-level emissions information. AWS launched its Sustainability console in June 2026 with scope 1-3 reporting, programmatic access, configurable exports, and both market-based and location-based data, but the broader issue of delayed, methodologically inconsistent cloud disclosures across providers remains unresolved. The Green Web Foundation noted that official cloud carbon datasets are often published monthly, with delays of several months, which limits near-real-time reporting and weakens workload-level decision-making in the Software Carbon Intensity (SCI) Measurement Platform Market. This becomes more serious in frameworks that require audit-ready location-sensitive reporting, because estimation models can fill gaps but also introduce assumptions that reviewers may challenge. The result is that vendors compete not only on interfaces and automation, but also on how defensibly they normalize incomplete data into a usable measurement chain.[4]Green Software Foundation, “How Do You Measure Software's Carbon Footprint?,” Green Software Foundation, greensoftware.foundation
Measurement Complexity In Shared, Virtualized, And Multi-Tenant Environments
The Software Carbon Intensity (SCI) Measurement Platform Market is also constrained by a technical problem that is more challenging than many early buyers expect: allocating energy and embodied carbon within shared computing environments. ICSE 2026 work on cloud-based enterprise software found that practitioners often underestimate the importance of telemetry preprocessing, even though carbon estimation depends on careful attribution of CPU, memory, network, and storage usage before energy can be assigned at the pod or application level. The embodied carbon component is even harder to estimate because hardware specifications, refresh cycles, and lifecycle information are rarely disclosed in sufficient detail for tenant-level allocation across multi-tenant infrastructure. Hybrid estates further increase the burden because public cloud data, private data center data, and internal metering models need to be normalized into a single reporting logic if the output is to be useful for audit, engineering, and supplier disclosure. The Green Software Foundation's Carmen engine automates Kubernetes- and Prometheus-based telemetry collection, but enterprise deployment still requires time and cross-team coordination, which slows adoption in the Software Carbon Intensity (SCI) Measurement Platform Market.
*Our forecasts treat driver/restraint impacts as directional, not additive. The impact forecasts reflect baseline growth, mix effects, and variable interactions.
Segment Analysis
By Deployment Type: Cloud-Native Leadership Meets Hybrid Demand
Cloud-based platforms held a 67.12% share in 2025, which made them the default delivery model across the Software Carbon Intensity (SCI) Measurement Platform Market. Enterprises favored SaaS delivery because it reduced setup time, removed the need for dedicated internal measurement infrastructure, and aligned with how most carbon-relevant software workloads already run. This model also gave vendors easier access to cloud telemetry, improving data collection speed and enabling recurring product updates without heavy customer-side maintenance. That advantage mattered most for buyers trying to move quickly on disclosure readiness, since implementation speed often shaped early platform selection as much as measurement depth. The cloud model also fits organizations that want to treat software emissions as an operating metric inside ongoing engineering and FinOps workflows rather than as a yearly reporting exercise.
On-premise deployment still kept a meaningful position in the Software Carbon Intensity (SCI) Measurement Platform Market because regulated buyers remained cautious about where operational and emissions-related data could be stored and processed. Financial services, government, and other sensitive sectors often preferred internal control over telemetry pipelines, application metadata, and reporting outputs, even when that choice slowed deployment. The Amadeus Carmen Carbon Measurement Engine demonstrated this behavior because the tool was developed over multiple years in an enterprise environment before ownership was transferred to the Green Software Foundation in January 2026. Hybrid platforms are projected to expand at a 27.05% CAGR during 2026-2031 because most large enterprises now run software across private infrastructure and multiple clouds, and they need a single carbon ledger to reconcile those environments. That makes hybrid architecture the most natural response to fragmented provider data, mixed compliance obligations, and the growing need for unified carbon visibility across software estates.


By Enterprise Size: Large Enterprises Anchor Spending While SMEs Scale Faster
Large enterprises commanded 65.34% of the market in 2025, which reflected where the earliest budget authority and compliance urgency sat in the Software Carbon Intensity (SCI) Measurement Platform Market. These companies run broad software estates, operate across multiple clouds, and face a greater need to align engineering metrics with finance, sustainability, procurement, and external assurance. They are also more likely to have internal teams capable of handling the governance, data normalization, and reporting design work required for SCI adoption at scale. That makes them the anchor accounts for enterprise-grade vendors, especially when contracts include multi-entity reporting, supplier engagement, and workflow integration across existing systems. Large buyers, therefore, shaped both current revenue concentration and product roadmaps, even in a market that remains fragmented overall.
Watershed reported that by 2026, it served more than 800 global companies, including 90 Fortune 500 firms and 5 of the top 6 U.S. banks, which supports the view that early commercial depth has come from large-account adoption. SMEs are still the fastest-growing segment, with a 27.41% CAGR for 2026-2031, and that growth is durable because it is driven by customer requirements as much as by voluntary internal sustainability goals. Lower-cost, AI-assisted tools are reducing the operating burden for smaller firms without large carbon accounting teams, while supplier due diligence is making SCI disclosure more relevant for software vendors serving larger enterprises. In many cases, SMEs are entering the Software Carbon Intensity (SCI) Measurement Platform Market because they need to remain qualified for procurement processes, rather than because they are building a full, stand-alone decarbonization program. That distinction matters because customer-driven adoption tends to persist once it becomes part of contract reviews, supplier scorecards, and renewal discussions.
By Application: Infrastructure Measurement Leads While AI Workloads Gain Speed
Cloud and Infrastructure Carbon Measurement was the largest application segment in 2025, accounting for 29.45%, giving it the broadest foothold in the Software Carbon Intensity (SCI) Measurement Platform Market. Buyers started here because infrastructure emissions are closely tied to cloud costs, compute intensity, and reporting exposure, making the operational payoff easier to explain. Provider-native reporting tools can supply baseline input data, and third-party platforms then add normalization, allocation logic, audit trails, and software-level visibility that native dashboards do not fully provide. The neighboring application areas remain important because software development carbon measurement supports design-stage choices, carbon reporting and benchmarking supports disclosure teams, and engineering workflow integration helps turn emissions data into release and architecture decisions. Together, these categories show that the Software Carbon Intensity (SCI) Measurement Platform Market is not limited to annual reporting and is becoming part of day-to-day software operations.
AI and High-Performance Compute Emissions Measurement is projected to expand at 28.12% CAGR during 2026-2031, making it the fastest-rising application area in the Software Carbon Intensity (SCI) Measurement Platform Market. The IEA estimated that data center CO2 emissions stood at 180 million tonnes in 2024 and may rise to around 300 million tonnes by 2035 in its base case, with AI workloads acting as the main demand driver. Microsoft Research reported in 2026 that optimized frontier-scale AI inference consumed a median of 0.31 Wh per query under production conditions, while non-production assumptions overstated energy use by 4-20 times, underscoring why generalized estimates are weak for serious reporting. The Green Software Foundation's active SCI for AI work adds a standards path that can support training, fine-tuning, and inference measurement in a more consistent way over time. This combination of rising demand, technical complexity, and standards development creates a clear expansion lane for vendors that can move beyond generic data center estimates toward workload-specific attribution.

By End-Use Industry: IT And Telecom Leads While Retail And E-Commerce Accelerates
IT and Telecom held the largest end-use share at 26.84% in 2025, which placed the sector at the center of the Software Carbon Intensity (SCI) Measurement Platform Market. The fit is straightforward because these firms operate software-intensive environments, carry high cloud exposure, and face pressure to connect technical efficiency with both cost management and disclosure quality. Telecom operators also deal with network function virtualization and dense shared compute pools, which makes workload-level carbon attribution especially relevant for internal engineering and regulatory reporting. BFSI remained another important buyer group because EU-domiciled institutions faced reporting deadlines, while global financial firms also needed better internal baselines for digital operations. The Green Software Foundation highlighted UBS as an early enterprise participant in SCI implementation work alongside Microsoft, demonstrating how the finance sector has moved ahead of many others in formalizing software carbon baselines.
Retail and E-Commerce is projected to grow at 27.56% CAGR during 2026-2031, giving it the fastest expansion pace among end-use groups in the Software Carbon Intensity (SCI) Measurement Platform Market. High transaction volumes, recommendation engines, order systems, and logistics software create direct links between workload intensity, cloud spend, and customer-facing activity, which makes carbon efficiency easier to justify as an operating lever. A normative statement in 2026 stated that product carbon footprint requirements are already being incorporated into procurement processes ahead of wider regulatory deadlines, and that timing matters for retailers preparing for Green Claims enforcement and Digital Product Passport obligations. The commercial pressure is therefore not limited to disclosure, because delayed adoption can also weaken supplier positioning and product credibility in markets where transparency is becoming part of purchase decisions. Government and public sector, food and beverage manufacturing, construction and infrastructure, energy and utilities, industrial manufacturing, and oil and gas add further demand as supply-chain disclosure expectations spread into sectors that run complex application estates but entered the Software Carbon Intensity (SCI) Measurement Platform Market later.
Geography Analysis
Europe held the largest regional share at 34.63% in 2025, which made it the current center of the Software Carbon Intensity (SCI) Measurement Platform Market. That lead came from the overlap between CSRD timelines, the EU Energy Efficiency Directive's data center reporting obligations, and country-level efficiency rules, such as Germany's requirement that new data centers reach a PUE of 1.2 by 2026. The United Kingdom, Germany, and France stood out as the highest-density adopter markets because they combine large corporate software estates with more mature sustainability reporting infrastructure. The EU Omnibus Simplification Package refined the immediate mandatory scope to companies with more than 1,000 employees and more than EUR 450 million in annual turnover, but it still leaves the largest enterprises under strong near-term pressure to improve their methodologies and data quality. The Green Software Foundation also published work in 2026 on how the SCI standard can support CSRD compliance under ESRS E1, which reinforces Europe's role in shaping buyer expectations for the broader Software Carbon Intensity (SCI) Measurement Platform Market.
North America remained the second-largest regional base in the Software Carbon Intensity (SCI) Measurement Platform Market, combining the largest concentration of hyperscaler infrastructure with a strong cluster of vendor headquarters and enterprise software buyers. The United States hosts key platform vendors such as Watershed, Persefoni, Sinai Technologies, and Sphera, which gives the region strong product development depth and early commercial activity. The IEA reported that U.S. data centers accounted for around 45% of global data center electricity consumption in 2024, at roughly 180 TWh, underscoring the scale of demand for software-linked emissions measurement in the region. The SEC ended its defense of the climate disclosure rules in 2025, yet CSRD and ISSB-linked obligations continue to keep North American multinationals engaged with the Software Carbon Intensity (SCI) Measurement Platform Market through their international operations.
Asia-Pacific is the fastest-growing region, with a 28.45% CAGR during 2026-2031, making it the primary growth engine for the Software Carbon Intensity (SCI) Measurement Platform Market. China accounted for around 25% of global data center electricity consumption in 2024, at roughly 100 TWh, and national PUE targets added operational pressure, supporting interest in workload-level attribution tools. The Shanghai Advanced Research Institute of the Chinese Academy of Sciences released the ScienceOne-Yuheng Carbon Accounting Large Model in April 2026, which signals rising domestic capability in AI-based carbon accounting infrastructure. India's IT services base, along with emerging activity in South America, the Middle East, and Africa, is being pulled forward by multinational client expectations, especially where outsourced development work becomes part of the scope 3 review and supplier due diligence.

Competitive Landscape
The Software Carbon Intensity (SCI) Measurement Platform Market remained moderately fragmented in 2026 because no single vendor controlled demand across all deployment models, use cases, and regions. Competition came from four broad groups: enterprise sustainability platforms, SCI-native and DevOps-linked tools, ESG reporting aggregators, and open-source initiatives that lowered barriers to engineering-led adoption. The Green Software Foundation's work on Carmen, the Impact Framework, and related tooling increased open-source pressure, especially in buyer conversations comparing premium commercial pricing to internally managed measurement stacks. Sphera demonstrated breadth in this market by offering an integrated sustainability solution that served more than 8,500 customers across 100 countries and extended beyond carbon reporting into EHS, supply chain, product stewardship, and process safety. That mix keeps the Software Carbon Intensity (SCI) Measurement Platform Market competitive at both ends, with some vendors selling deep engineering measurement and others selling broader platform scope tied to enterprise controls.
The clearest white space in the Software Carbon Intensity (SCI) Measurement Platform Market lies in AI and HPC workload measurement, hybrid multi-cloud carbon attribution, and tools for smaller suppliers entering disclosure through customer pressure rather than direct regulation. The SCI for AI initiative matters here because it gives vendors a standards path for a category where enterprise demand is rising faster than measurement consistency. Real-time cross-provider normalization is still incomplete, which means vendors that can create defensible provenance across AWS, Azure, Google Cloud, and on-premise environments still have room to differentiate. This leaves the Software Carbon Intensity (SCI) Measurement Platform Market open to both specialists and larger suite vendors, as buyers are still balancing audit readiness, engineering usability, and deployment costs rather than converging on a single preferred product model.
Strategic moves in 2025 and 2026 showed that competition is shifting toward broader workflow control and compliance-readiness within the Software Carbon Intensity (SCI) Measurement Platform Market. Diginex signed a definitive agreement on December 31, 2025, to acquire Plan A Earth GmbH for EUR 55 million (USD 59.4 million), reflecting continued interest in combining governance, compliance, and carbon accounting capabilities under a single platform. Normative launched Carbon Inventory Managed Services in February 2026, signaling that vendors are adding execution support to address staffing gaps within sustainability teams. AWS also launched the Sustainability console in June 2026, which narrows parts of the cloud data gap and may push third-party vendors to focus more heavily on software-level attribution, AI workloads, and audit-grade workflow depth rather than on basic provider data aggregation.
Software Carbon Intensity (SCI) Measurement Platform Industry Leaders
Watershed Technology, Inc.
Persefoni AI, Inc.
Normative AB
Plan A Earth GmbH
Sweep SAS
- *Disclaimer: Major Players sorted in no particular order

Recent Industry Developments
- June 2026: AWS launched the AWS Sustainability console, replacing the Customer Carbon Footprint Tool upon its deprecation on June 30, 2026, consolidating scope 1-3 carbon reporting with both market-based and location-based data, along with programmatic API access and configurable CSV exports. The transition addresses a key CSRD dual-reporting data gap that had required third-party SCI platforms to supplement AWS-native emissions reporting for EU-compliant organizations.
- March 2026: Sphera was recognized as a Leader in the 2026 Green Quadrant for Enterprise Carbon Management Software, March 11, 2026, achieving top scores for its Integrated Sustainability approach covering EHS, supply chain, product stewardship, and process safety for 8,500+ customers across 100 countries, reinforcing its position in industrial manufacturing, energy and utilities, and oil and gas segments.
- February 2026: Normative launched Carbon Inventory Managed Services, February 16, 2026, assigning GHGP-certified Climate Advisors to organizations building complete carbon inventories and addressing the operational capacity gap for sustainability teams facing expanding CSRD reporting requirements without the headcount to execute them.
- January 2026: Amadeus transferred ownership of the Carmen Carbon Measurement Engine to the Green Software Foundation, making the Kubernetes and Prometheus-integrated SCI measurement tool freely available for enterprise engineering teams seeking automated per-application carbon measurement without requiring per-team instrumentation overhead or custom measurement pipelines.


Global Software Carbon Intensity (SCI) Measurement Platform Market Report Scope
The Software Carbon Intensity (SCI) Measurement Platform market refers to platforms and services that enable organizations to quantify, monitor, and reduce the carbon intensity of software applications and IT workloads. These solutions provide functionalities such as measuring emissions from software development processes, cloud and infrastructure operations, AI and high-performance computing workloads, carbon reporting and benchmarking, and integration into engineering workflows.
The Software Carbon Intensity (SCI) Measurement Platform market report is segmented by Deployment Type (Cloud-Based Platform, On-Premise Platform, and Hybrid Platform), Enterprise Size (Large Enterprises, and Small and Medium Enterprises), Application (Software Development Carbon Measurement, Cloud and Infrastructure Carbon Measurement, AI and High-Performance Compute Emissions Measurement, Carbon Reporting and Benchmarking, Engineering Workflow Integration), End-Use Industry (IT and Telecom, BFSI, Industrial Manufacturing, Energy and Utilities, Oil and Gas, Retail and E-Commerce, Food and Beverage Manufacturing, Construction and Infrastructure, Government and Public Sector, and Other End-User Industries), and Geography (North America, South America, Europe, Asia-Pacific, Middle East, and Africa). The Market Forecasts are Provided in Terms of Value (USD).
| Cloud-Based Platform |
| On-Premise Platform |
| Hybrid Platform |
| Large Enterprises |
| Small and Medium Enterprises |
| Software Development Carbon Measurement |
| Cloud and Infrastructure Carbon Measurement |
| AI and High-Performance Compute Emissions Measurement |
| Carbon Reporting and Benchmarking |
| Engineering Workflow Integration |
| IT and Telecom |
| BFSI |
| Industrial Manufacturing |
| Energy and Utilities |
| Oil and Gas |
| Retail and E-Commerce |
| Food and Beverage Manufacturing |
| Construction and Infrastructure |
| Government and Public Sector |
| Other End-User Industries |
| North America | United States |
| Canada | |
| Mexico | |
| South America | Brazil |
| Rest of South America | |
| Europe | Germany |
| United Kingdom | |
| France | |
| Italy | |
| Spain | |
| Russia | |
| Rest of Europe | |
| Asia-Pacific | China |
| India | |
| Japan | |
| South Korea | |
| Australia | |
| Rest of Asia-Pacific | |
| Middle East | Turkey |
| Saudi Arabia | |
| United Arab Emirates | |
| Rest of Middle East | |
| Africa | South Africa |
| Nigeria | |
| Rest of Africa |
| By Deployment Type | Cloud-Based Platform | |
| On-Premise Platform | ||
| Hybrid Platform | ||
| By Enterprise Size | Large Enterprises | |
| Small and Medium Enterprises | ||
| By Application | Software Development Carbon Measurement | |
| Cloud and Infrastructure Carbon Measurement | ||
| AI and High-Performance Compute Emissions Measurement | ||
| Carbon Reporting and Benchmarking | ||
| Engineering Workflow Integration | ||
| By End-Use Industry | IT and Telecom | |
| BFSI | ||
| Industrial Manufacturing | ||
| Energy and Utilities | ||
| Oil and Gas | ||
| Retail and E-Commerce | ||
| Food and Beverage Manufacturing | ||
| Construction and Infrastructure | ||
| Government and Public Sector | ||
| Other End-User Industries | ||
| By Geography | North America | United States |
| Canada | ||
| Mexico | ||
| South America | Brazil | |
| Rest of South America | ||
| Europe | Germany | |
| United Kingdom | ||
| France | ||
| Italy | ||
| Spain | ||
| Russia | ||
| Rest of Europe | ||
| Asia-Pacific | China | |
| India | ||
| Japan | ||
| South Korea | ||
| Australia | ||
| Rest of Asia-Pacific | ||
| Middle East | Turkey | |
| Saudi Arabia | ||
| United Arab Emirates | ||
| Rest of Middle East | ||
| Africa | South Africa | |
| Nigeria | ||
| Rest of Africa | ||


Key Questions Answered in the Report
What is the current size of the Software Carbon Intensity (SCI) Measurement Platform Market?
The Software Carbon Intensity (SCI) Measurement Platform Market was valued at USD 0.23 billion in 2025, stood at USD 1.23 billion in 2026, and is forecast to reach USD 3.92 billion by 2031 at a 26.09% CAGR.
What is driving adoption of SCI measurement platforms?
The strongest drivers are regulatory reporting under CSRD and ESRS E1, the move toward product-level carbon metrics, FinOps and sustainability convergence, and the standardization brought by ISO/IEC 21031:2024.
Which deployment model leads demand for SCI tools?
Cloud-based deployment led with a 67.12% share in 2025 because enterprises preferred faster rollout, lower upfront infrastructure needs, and closer access to cloud telemetry.
Which application area is growing the fastest?
AI and High-Performance Compute Emissions Measurement is the fastest-growing application, with a projected 28.12% CAGR during 2026-2031, driven by rising AI workload energy use and the need for workload-level attribution.
Why does Europe lead while Asia-Pacific grows faster?
Europe leads because of CSRD timing, data center reporting rules, and mature sustainability reporting systems, while Asia-Pacific grows faster because of rising data center investment, domestic carbon accounting activity, and supplier pressure from global clients.
Why is the competitive environment still fragmented?
The category spans broad carbon platforms, SCI-native engineering tools, ESG aggregators, and open-source frameworks, so buyers are still choosing between depth, audit readiness, workflow fit, and price rather than converging around one dominant vendor.
Page last updated on:


