Sustainability Software Market Size and Share
Market Overview
| Study Period | 2020 - 2031 |
|---|---|
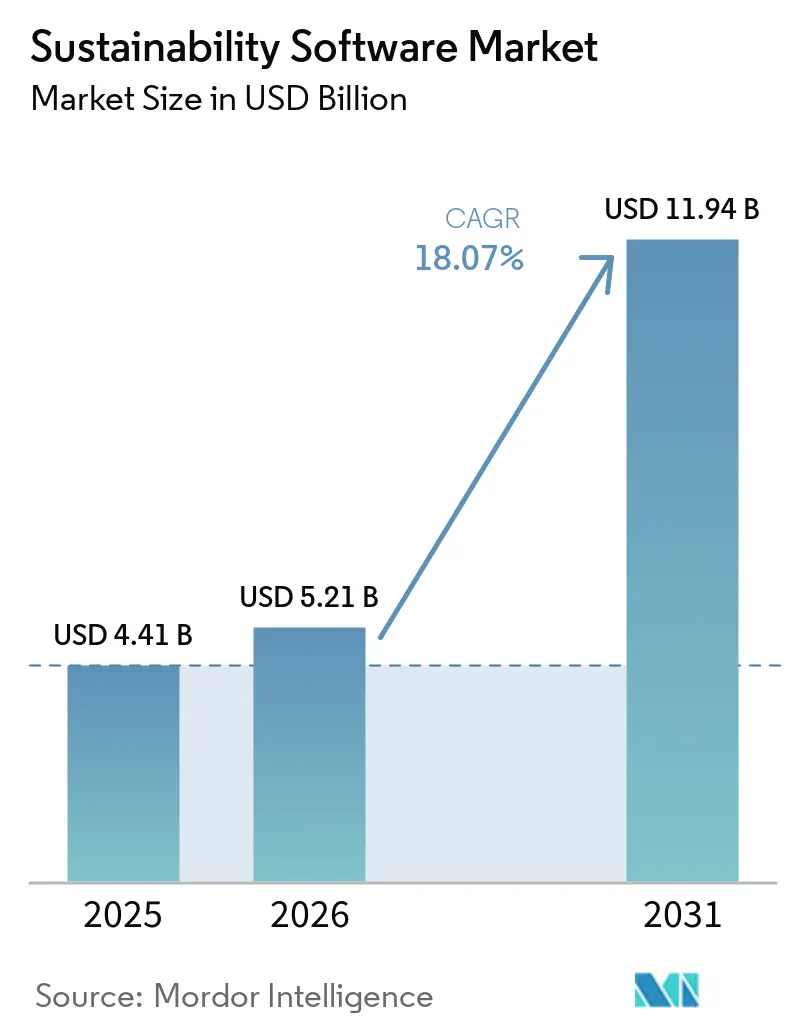
| Market Size (2026) | USD 5.21 Billion |
| Market Size (2031) | USD 11.94 Billion |
| Growth Rate (2026 - 2031) | 18.07% CAGR |
| Fastest Growing Market | Asia Pacific |
| Largest Market | North America |
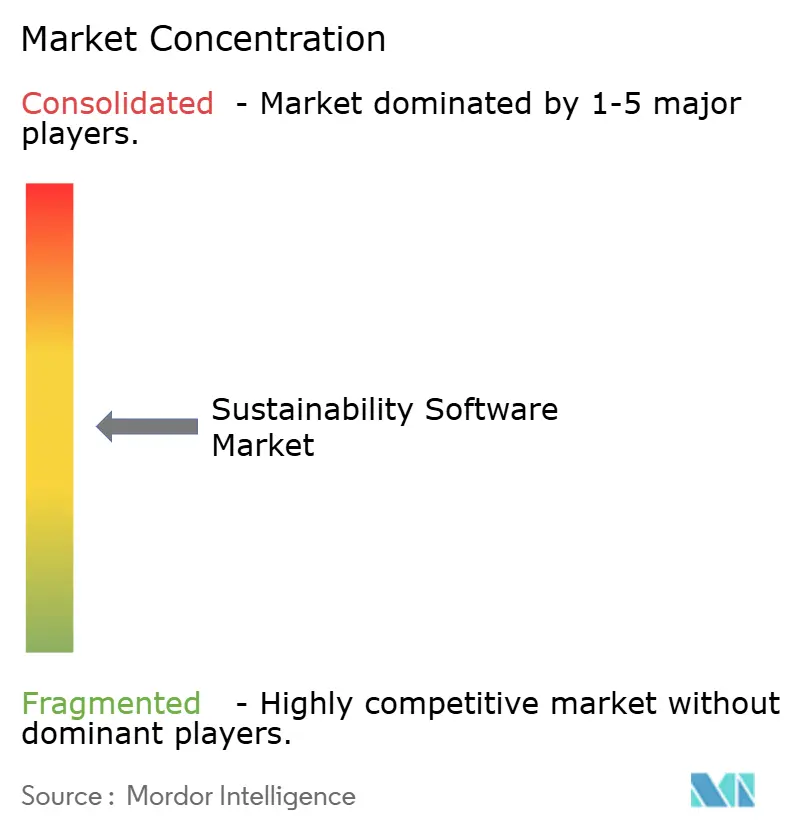
| Market Concentration | Medium |
Major Players *Disclaimer: Major Players sorted in no particular order Image © Mordor Intelligence. Reuse requires attribution under CC BY 4.0. | |
Sustainability Software Market Analysis by Mordor Intelligence
The sustainability software market size was valued at USD 4.41 billion in 2025 and estimated to grow from USD 5.21 billion in 2026 to reach USD 11.94 billion by 2031, at a CAGR of 18.07% during the forecast period (2026-2031). Spending momentum reflects mandatory climate-disclosure rules, rising energy costs and the clear financial payback of advanced carbon-management platforms. Regulatory clarity from the March 2024 SEC rule has shifted software adoption from voluntary reporting to mission-critical compliance infrastructure. Users also validate direct cost savings, such as the USD 20 million annual energy reduction delivered to GPT Group through IBM Envizi. Vendors now emphasise AI-enabled real-time analytics that embed decarbonisation insights into daily operations, while private-equity interest signals confidence in the sustainability software market’s long-term growth runway.
Key Report Takeaways
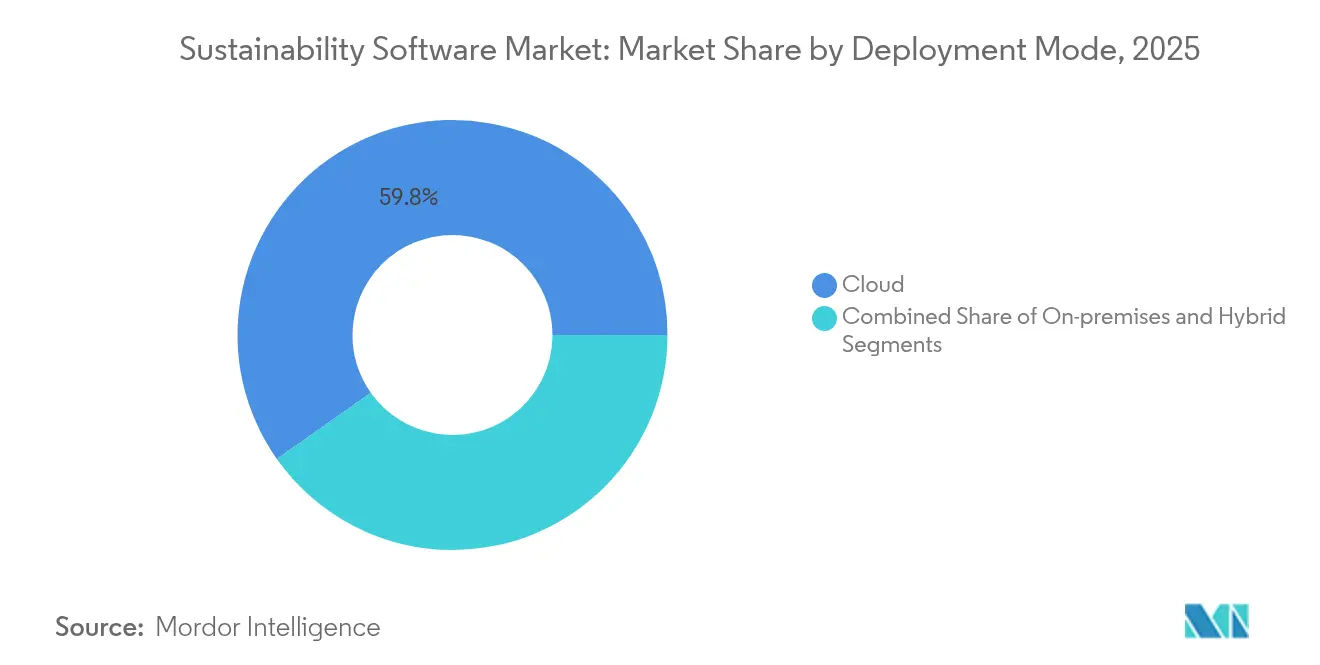
- By deployment mode, cloud solutions held 59.78% of sustainability software market share in 2025, whereas hybrid architecture is set to grow at 19.02% CAGR through 2031.
- By software category, sustainability reporting and management (ESG) led with 39.45% revenue share in 2025; supply-chain sustainability tools are projected to expand at a 19.25% CAGR to 2031.
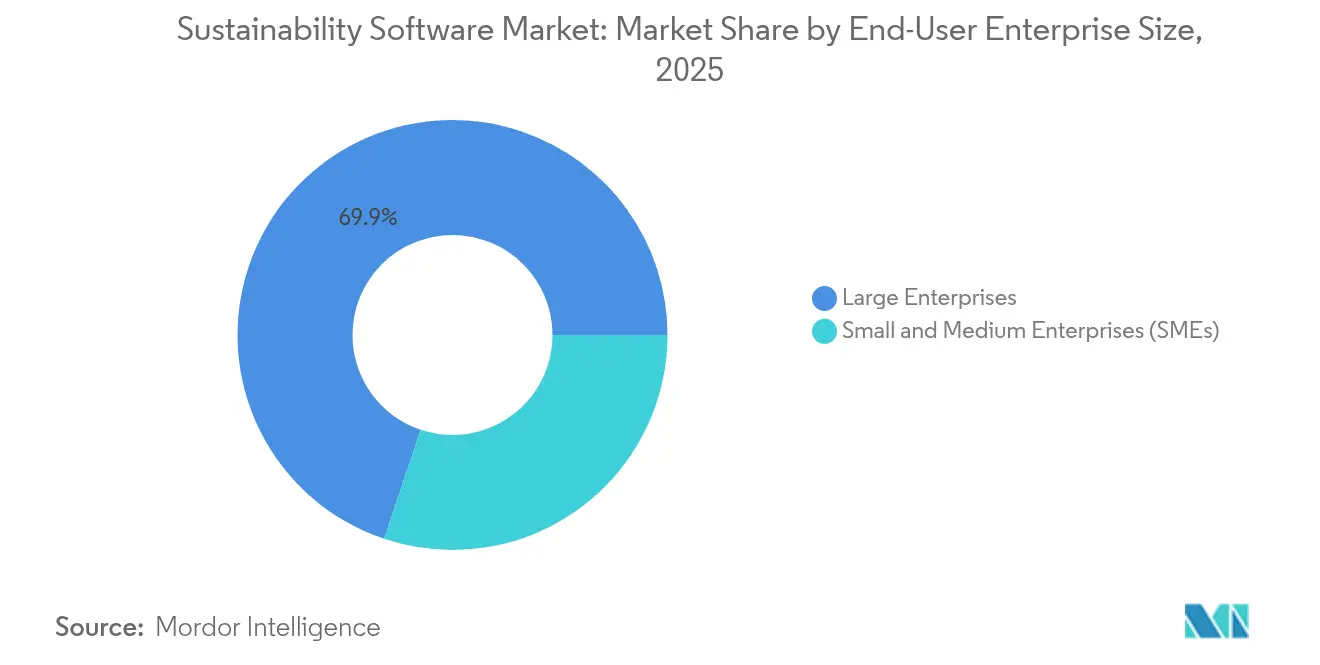
- By end-user enterprise size, large organisations accounted for 69.85% of the sustainability software market in 2025, while the SME segment is advancing at an 18.22% CAGR.
- By end-user industry, energy and utilities commanded 24.88% of the sustainability software market size in 2025; manufacturing is on track for an 18.14% CAGR between 2026 and 2031.
- By geography, North America captured 41.62% of sustainability software market share in 2025; Asia-Pacific is set to post an 18.31% CAGR through 2031.
Note: Market size and forecast figures in this report are generated using Mordor Intelligence’s proprietary estimation framework, updated with the latest available data and insights as of 2026.
Global Sustainability Software Market Trends and Insights
Drivers Impact Analysis*
| Driver | (~) % Impact on CAGR Forecast | Geographic Relevance | Impact Timeline |
|---|---|---|---|
| ESG-disclosure regulations tightening worldwide | +4.2% | Global, with EU and US leading implementation | Short term (≤ 2 years) |
| Corporate net-zero commitments boost carbon accounting demand | +3.8% | Global, concentrated in developed markets | Medium term (2-4 years) |
| Cost-savings from energy and resource optimization analytics | +3.1% | Global, strongest in energy-intensive industries | Medium term (2-4 years) |
| Investor and stakeholder pressure for transparent ESG data | +2.9% | North America and EU, expanding to Asia-Pacific | Short term (≤ 2 years) |
| AI-driven Scope-3 data capture and automation | +2.7% | Global, early adoption in tech and manufacturing | Long term (≥ 4 years) |
| Convergence of ESG and financial reporting platforms | +2.1% | North America and EU primarily | Medium term (2-4 years) |
| Source: Mordor Intelligence | |||
ESG-Disclosure Regulations Tightening Worldwide
Binding rules elevate the sustainability software market from optional analytics to mandatory infrastructure. SEC and EU mandates now attach material penalties to inaccurate or missing carbon data, driving enterprise-wide roll-outs ahead of phased submission deadlines. Continuous platform demand is expected through 2028 as successive filing tiers take effect
Corporate Net-Zero Commitments Boost Carbon Accounting Demand
Ambitious targets require granular tracking of Scope 1-3 emissions through carbon management software. Microsoft’s pledge to reach carbon negativity by 2030, backed by more than 34 GW of contracted renewable power, illustrates how software enables project oversight and removal verification [1]Microsoft Corporation, “Sustainability at Microsoft 2025 Report,” microsoft.com. As investors link ESG outcomes to capital access, robust data systems become essential for executive accountability.
Cost Savings From Energy and Resource Optimisation Analytics
Modern platforms integrate IoT sensors and AI algorithms that discover waste patterns and adjust equipment in real time. These functions convert sustainability programmes into profit centres by lowering utility bills and maintenance outlays, reinforcing CFO budget approvals without relying solely on compliance arguments.
AI-Driven Scope-3 Data Capture and Automation
Artificial intelligence now tackles the toughest carbon-accounting task: supplier data. Persefoni’s algorithms flag anomalies and fill gaps, sharpening audit readiness. CO₂ AI solutions compress months-long calculations into days, enabling enterprises such as Symrise to track thousands of products concurrently. Automation scales the sustainability software market as value-chain reporting grows universal.
Restraints Impact Analysis*
| Restraint | (~) % Impact on CAGR Forecast | Geographic Relevance | Impact Timeline |
|---|---|---|---|
| Shortage of skilled sustainability data analysts | -2.1% | Global, acute in emerging markets | Medium term (2-4 years) |
| High upfront cost of enterprise-grade platforms | -1.8% | Global, particularly affecting SMEs | Short term (≤ 2 years) |
| Data-sovereignty hurdles for cross-border cloud deployment | -1.3% | EU, China, and regulated industries | Long term (≥ 4 years) |
| ESG backlash in certain US states dampening adoption | -0.9% | Select US states, limited spillover | Short term (≤ 2 years) |
| Source: Mordor Intelligence | |||
Shortage of Skilled Sustainability Data Analysts
Demand for ESG talent exceeds supply as 71% of manufacturers plan departmental expansion yet struggle to recruit carbon-accounting specialists. Reliance on consultants raises project costs and slows internal capability building, particularly among mid-market firms.
High Upfront Cost of Enterprise-Grade Platforms
Comprehensive deployments can exceed USD 1 million once licensing, integration and training are included, deterring price-sensitive SMEs. Vendors now market modular SaaS bundles to reduce initial spend, but significant investment remains a barrier, especially outside large enterprise buyers.
*Our forecasts treat driver/restraint impacts as directional, not additive. The impact forecasts reflect baseline growth, mix effects, and variable interactions.
Segment Analysis
By Deployment Mode: Hybrid Infrastructure Gains Strategic Priority
The sustainability software market saw cloud deployment hold a dominant 59.78% sustainability software market share in 2025, while hybrid configurations are forecast to post a 19.02% CAGR through 2031. Hybrid models blend cloud analytics with on-premise edge processing, letting firms comply with data-residency laws yet maintain AI-heavy forecasting capabilities. Energy producers and manufacturers integrate platforms like Schneider Electric’s hybrid suite to synchronise plant-floor sensors with cloud dashboards, capturing immediate efficiency gains . Hybrid adoption therefore satisfies both compliance and operational imperatives, positioning it as the next driver of sustainability software market expansion.
Hybrid architectures also future-proof investments because enterprises can shift processing loads between environments as regulations evolve. Cyber-security postures improve when sensitive operational data never leaves controlled premises, yet aggregated insights still reside in secure clouds for enterprise-level reporting. This flexibility is forecast to accelerate penetration in highly regulated sectors such as power utilities and pharmaceuticals, reinforcing the sustainability software market’s resilience to changing policy landscapes.


By Software Category: Supply-Chain Solutions Accelerate Beyond Core ESG
Sustainability reporting and management (ESG) captured 39.45% of revenue in 2025, but supply-chain sustainability applications are on track for a 19.25% CAGR to 2031, reflecting urgent Scope 3 challenges. Automated freight-emission modules, enabled by Blue Yonder’s Pledge acquisition, give logistics managers real-time CO₂e dashboards and instant compliance formatting. Such capabilities extend platform value beyond corporate reporting into day-to-day procurement and transport optimisation, widening the sustainability software market addressable base.
Growth also stems from multinational suppliers needing to present standardised data to many customers. AI bots request, validate and normalise figures across thousands of vendors, reducing duplicative manual outreach. As adoption spreads downstream, supply-chain tools are poised to surpass core ESG modules in incremental revenue contribution, underscoring a structural shift in the sustainability software market.
By End-User Enterprise Size: SME Adoption Accelerates Through Regulatory Cascade
Large companies dominated 69.85% of 2025 revenues, yet SMEs are expected to grow at 18.22% CAGR as mandates flow through value chains. Prime contractors increasingly require tier-two suppliers to submit auditable carbon numbers, compelling smaller firms to adopt lighter SaaS subscriptions tailored to non-expert users. This demand expansion diversifies the sustainability software industry customer mix and lessens concentration risk.
SMEs typically prioritise simplicity and rapid deployment over extensive customisation. Vendors such as VERSO offer template-driven CSRD compliance modules that can be activated in weeks, accelerating time to value. Subscription pricing and pre-configured reporting libraries help SMEs overcome capital constraints, facilitating broader penetration of the sustainability software market.
By End-User Industry: Manufacturing Momentum Builds on Operational Integration
Energy and utilities retained 24.88% of the sustainability software market size in 2025 thanks to regulatory scrutiny and infrastructure scale. Manufacturing, however, is forecast for an 18.14% CAGR through 2031 as plants digitise equipment for energy optimisation. Celestica’s deployment of IBM Envizi across global factories exemplifies how real-time dashboards reduce resource intensity while guiding capital-expenditure priorities.
Manufacturers also confront Scope 3 risks because purchased goods often dwarf direct plant emissions. Integrated platforms map material flows, model alternative suppliers and link results to product-level environmental declarations. These capabilities transform compliance exercises into strategic sourcing levers, further energising the sustainability software market.
Geography Analysis
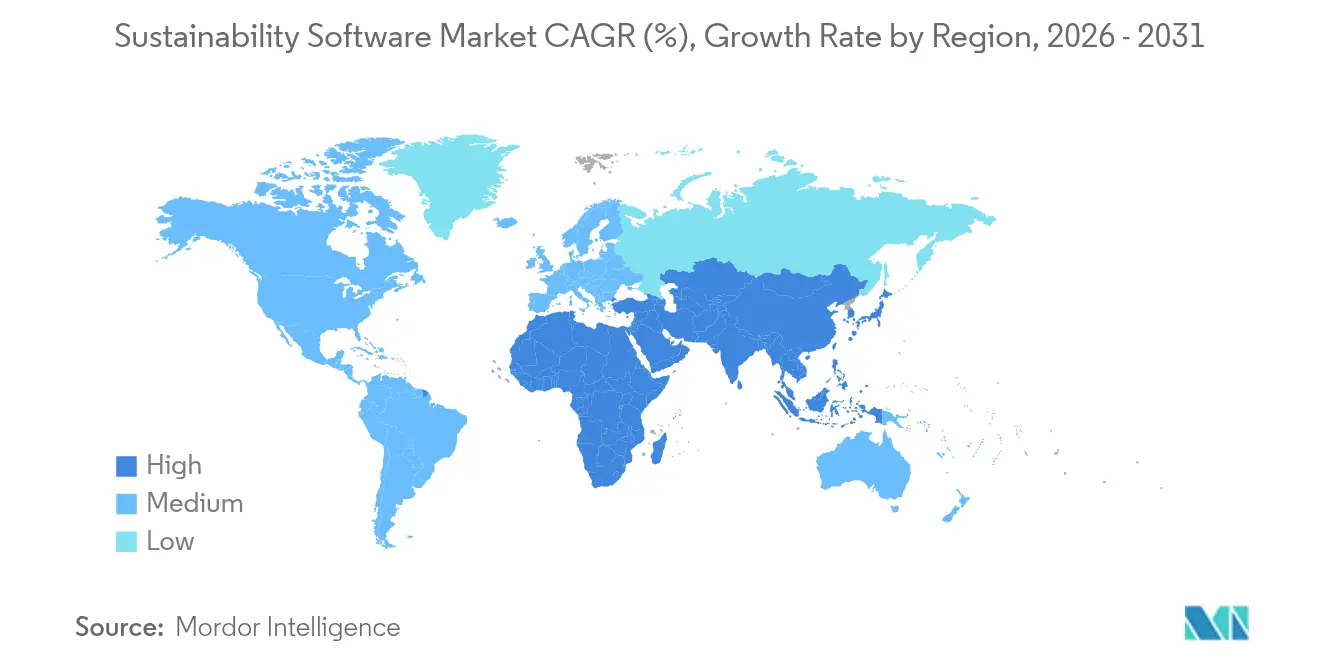
North America held 41.62% sustainability software market share in 2025 as the SEC disclosure rule, plus strengthened federal procurement guidelines, compelled fast adoption. Enterprises rushed to instrument assets and align financial statements with mandated carbon data, while abundant venture funding supported start-ups building vertical AI models. Mature consulting ecosystems further eased implementation.
Asia-Pacific is projected to register an 18.31% CAGR to 2031, the highest regional pace. China will require over 300 publicly listed firms to publish sustainability reports by 2026, and Singapore’s exchanges demand climate reporting for most issuers . Rapid industrialisation produces immediate efficiency gains when software recommends equipment retrofits, bolstering ROI arguments across manufacturing corridors from Shenzhen to Chennai.
Europe continues strong regulatory-driven uptake through the Corporate Sustainability Reporting Directive covering more than 51,000 entities. European Sustainability Reporting Standards call for granular double-materiality assessments, driving demand for automated data tagging and audit trails. German multinationals integrating hybrid software with industrial controls showcase regional expertise that influences global best practice.

Competitive Landscape
Private-equity appetite signals a maturing yet still fragmented playing field. Blackstone is evaluating a USD 3 billion exit for Sphera and Thoma Bravo is considering divesting Cority at about USD 2 billion, spotlighting premium valuations attached to high-growth ESG platforms. Strategic buyers likewise target niche AI or supply-chain modules to close capability gaps and broaden suites.
Technology differentiation increasingly revolves around artificial intelligence that automates Scope 3 ingestion, anomaly detection and predictive decarbonisation scenarios. Microsoft embeds its Sustainability Manager inside the broader cloud stack to capitalise on existing Azure relationships, while Persefoni positions itself around financial-grade carbon accounting precision for insurers and banks. Niche vendors prosper by specialising in vertical pain points yet face rising acquisition interest from platform consolidators.
SME-specific offerings represent white-space terrain. Solutions combining guided onboarding, industry templates and subscription pricing aim to remove cost and complexity barriers. Successful penetration here will expand the total addressable sustainability software market by attracting thousands of mid-sized suppliers newly covered by cascading regulations.
Sustainability Software Industry Leaders
Microsoft Corporation
IBM Corporation
SAP SE
Salesforce, Inc.
Wolters Kluwer N.V.
- *Disclaimer: Major Players sorted in no particular order

Recent Industry Developments
- May 2025: Blue Yonder acquired Pledge, adding automated freight-emission reporting aligned to ISO 14083 and Global Logistics Emissions Council frameworks.
- April 2025: Blackstone began exploring the USD 3 billion sale of Sphera, reflecting ongoing consolidation.
- December 2024: EQS Group bought Daato to deepen ESG compliance features.
- November 2024: Normative purchased Eivee, strengthening integrated carbon-accounting capabilities.


Global Sustainability Software Market Report Scope
Sustainability software comprises applications and platforms designed to assist organizations and individuals in tracking, managing, and reducing their environmental, social, and economic impacts. These software solutions integrate tools and analytics to measure sustainability metrics such as carbon emissions, energy consumption, water usage, waste management, and supply chain efficiency. Additionally, they facilitate regulatory compliance, reporting, and decision-making processes to achieve sustainability goals.
Sustainability software market report is segmented by deployment (cloud, on-premise), by type of software (resource management software, carbon management software, sustainability reporting and management software, energy optimization software, compliance management software, others), by end-user vertical (government, BFSI, IT and telecom, industrial, healthcare, other end-user verticals) and by geography (North America, Europe, Asia-Pacific, Latin America, and Middle East & Africa). The market sizes and forecasts are provided in terms of value (USD) for all the above segments.
| Cloud |
| On-Premises |
| Hybrid |
| Carbon Management Software |
| Sustainability Reporting and Management (ESG) |
| Energy and Resource Optimisation |
| Compliance and Risk Management |
| Supply-Chain Sustainability |
| Environment, Health and Safety (EHS) |
| Large Enterprises |
| Small and Medium Enterprises (SMEs) |
| Government and Public Sector |
| BFSI |
| IT and Telecom |
| Manufacturing and Industrial |
| Healthcare and Life Sciences |
| Energy and Utilities |
| Consumer Goods and Retail |
| Other Industries |
| North America | United States | |
| Canada | ||
| Mexico | ||
| South America | Brazil | |
| Argentina | ||
| Rest of South America | ||
| Europe | Germany | |
| United Kingdom | ||
| France | ||
| Italy | ||
| Spain | ||
| Russia | ||
| Rest of Europe | ||
| Asia-Pacific | China | |
| Japan | ||
| India | ||
| South Korea | ||
| Australia and New Zealand | ||
| Rest of Asia-Pacific | ||
| Middle East and Africa | Middle East | Saudi Arabia |
| United Arab Emirates | ||
| Turkey | ||
| Rest of Middle East | ||
| Africa | South Africa | |
| Nigeria | ||
| Egypt | ||
| Rest of Africa | ||
| By Deployment Mode | Cloud | ||
| On-Premises | |||
| Hybrid | |||
| By Software Category | Carbon Management Software | ||
| Sustainability Reporting and Management (ESG) | |||
| Energy and Resource Optimisation | |||
| Compliance and Risk Management | |||
| Supply-Chain Sustainability | |||
| Environment, Health and Safety (EHS) | |||
| By End-user Enterprise Size | Large Enterprises | ||
| Small and Medium Enterprises (SMEs) | |||
| By End-User Industry | Government and Public Sector | ||
| BFSI | |||
| IT and Telecom | |||
| Manufacturing and Industrial | |||
| Healthcare and Life Sciences | |||
| Energy and Utilities | |||
| Consumer Goods and Retail | |||
| Other Industries | |||
| By Geography | North America | United States | |
| Canada | |||
| Mexico | |||
| South America | Brazil | ||
| Argentina | |||
| Rest of South America | |||
| Europe | Germany | ||
| United Kingdom | |||
| France | |||
| Italy | |||
| Spain | |||
| Russia | |||
| Rest of Europe | |||
| Asia-Pacific | China | ||
| Japan | |||
| India | |||
| South Korea | |||
| Australia and New Zealand | |||
| Rest of Asia-Pacific | |||
| Middle East and Africa | Middle East | Saudi Arabia | |
| United Arab Emirates | |||
| Turkey | |||
| Rest of Middle East | |||
| Africa | South Africa | ||
| Nigeria | |||
| Egypt | |||
| Rest of Africa | |||


Key Questions Answered in the Report
What is the current value of the sustainability software market?
The sustainability software market is valued at USD 5.21 billion in 2026.
How fast is the sustainability software market expected to grow
It is forecast to post an 18.07% CAGR and reach USD 11.94 billion by 2031.
Which deployment model is growing the quickest?
Hybrid architectures are projected to expand at 19.02% CAGR through 2031 because they balance data-sovereignty needs with cloud analytics.
Why is manufacturing a high-growth industry segment?
Manufacturers can link emissions dashboards directly to plant-floor systems, unlocking both compliance and cost-saving benefits that drive an 18.14% CAGR.
Page last updated on:


