Power Equipment Market Size and Share
Market Overview
| Study Period | 2021 - 2031 |
|---|---|
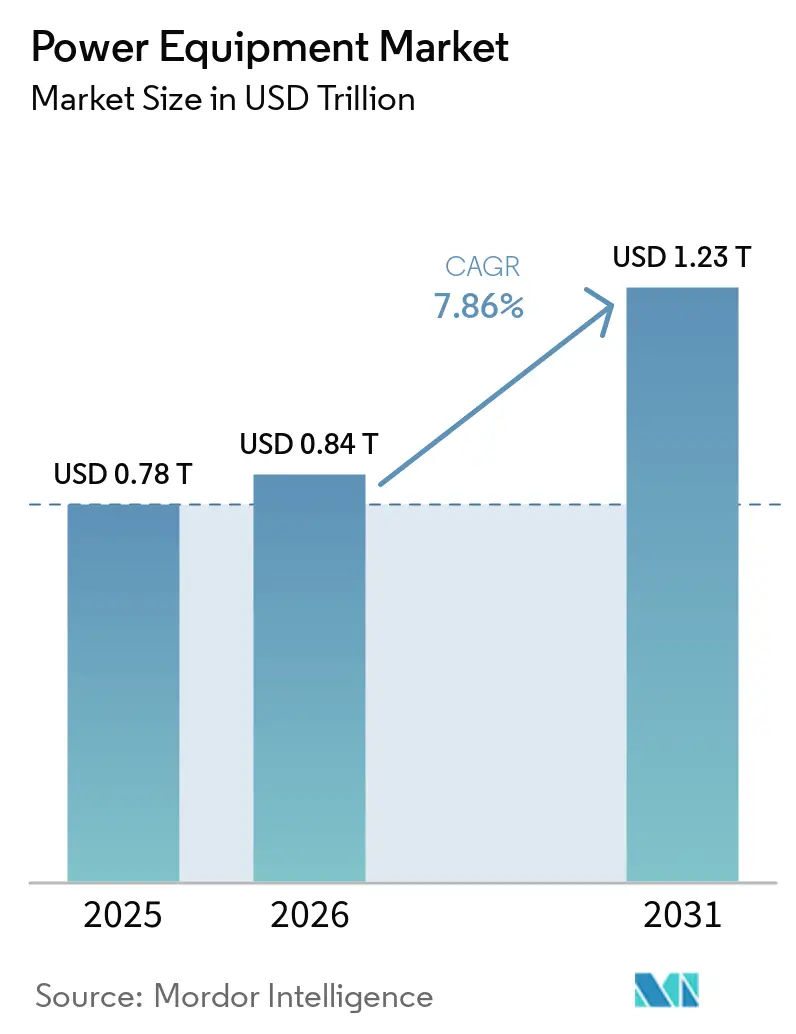
| Market Size (2026) | USD 0.84 Trillion |
| Market Size (2031) | USD 1.23 Trillion |
| Growth Rate (2026 - 2031) | 7.86% CAGR |
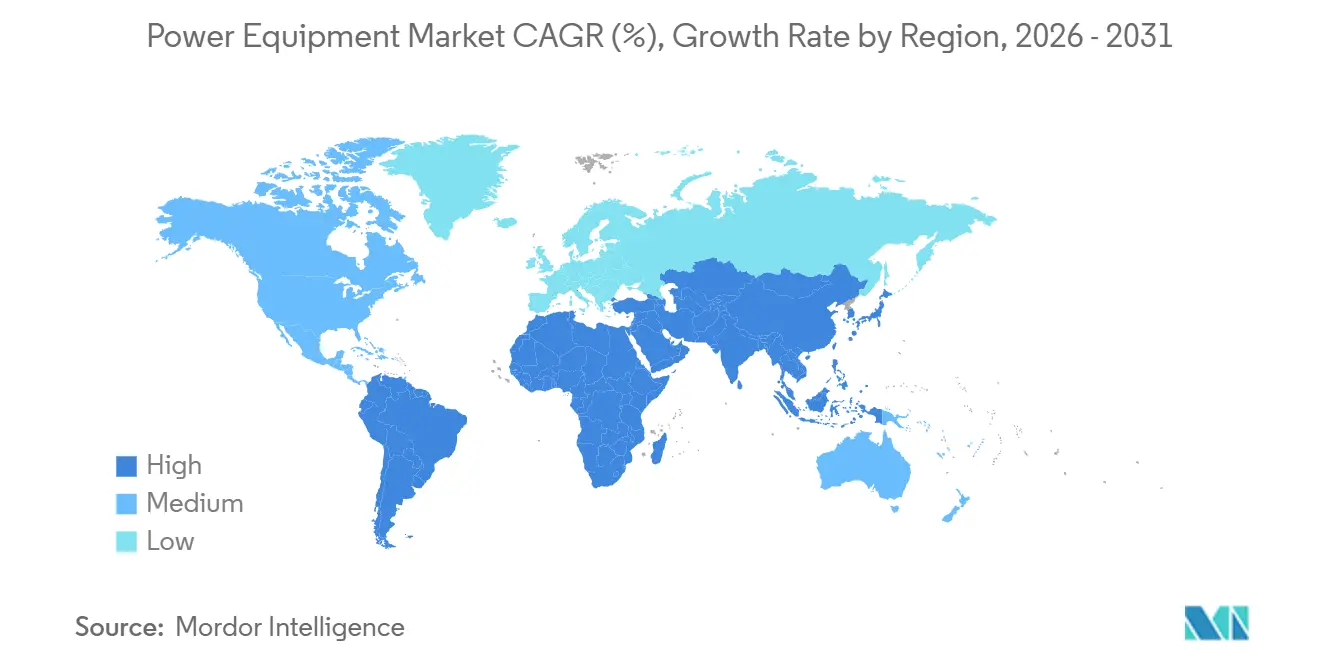
| Fastest Growing Market | Asia-Pacific |
| Largest Market | Asia-Pacific |
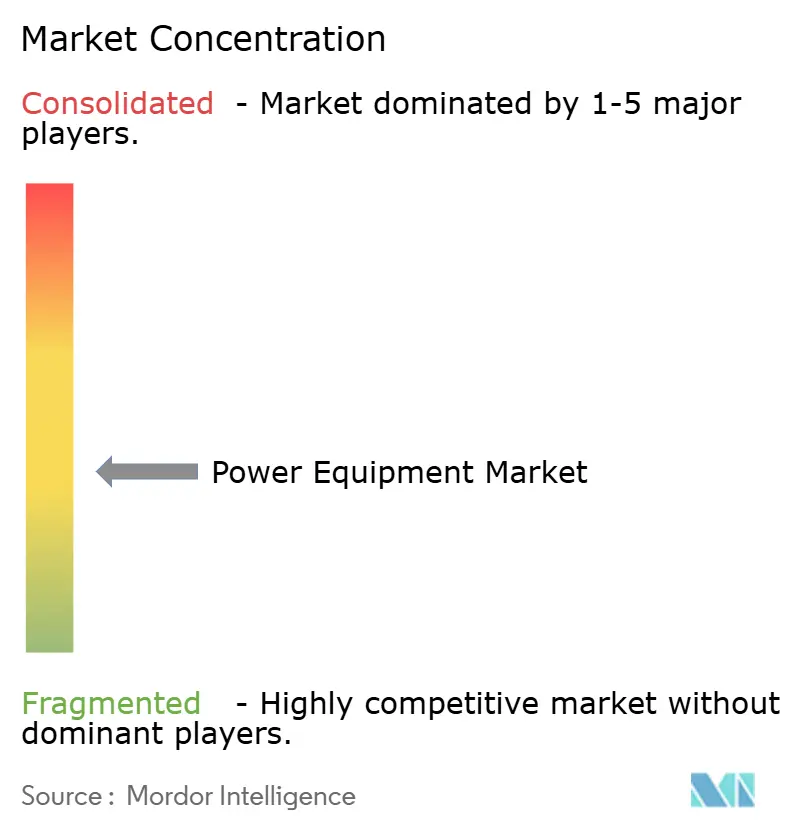
| Market Concentration | Medium |
Major Players *Disclaimer: Major Players sorted in no particular order Image © Mordor Intelligence. Reuse requires attribution under CC BY 4.0. | |
Power Equipment Market Analysis by Mordor Intelligence
The Power Equipment Market size was valued at USD 0.78 trillion in 2025 and is estimated to grow from USD 0.84 trillion in 2026 to reach USD 1.23 trillion by 2031, at a CAGR of 7.86% during the forecast period (2026-2031).
Strong replacement demand, rising renewable penetration, and widespread digitalization are redefining capital-spending priorities. Utilities are retiring legacy fleets that lack bi-directional power-flow, harmonic-mitigation, and cyber-resilience features, while industrial buyers are electrifying heat and transport fleets to satisfy carbon-disclosure mandates. The shift to inverter-based resources is expanding requirements for grid-forming inverters and digitally enabled switchgear, compressing margins for conventional transformers yet opening premium niches for equipment with embedded sensors and edge analytics. Regionally, Asia-Pacific is accelerating ultra-high-voltage build-outs, North America is channeling tax-credit windfalls into transmission corridors, and Europe is fast-tracking offshore-wind interconnectors. Competitive intensity is rising as equipment-as-a-service models lower capital hurdles for second-tier utilities and data-center operators.
Key Report Takeaways
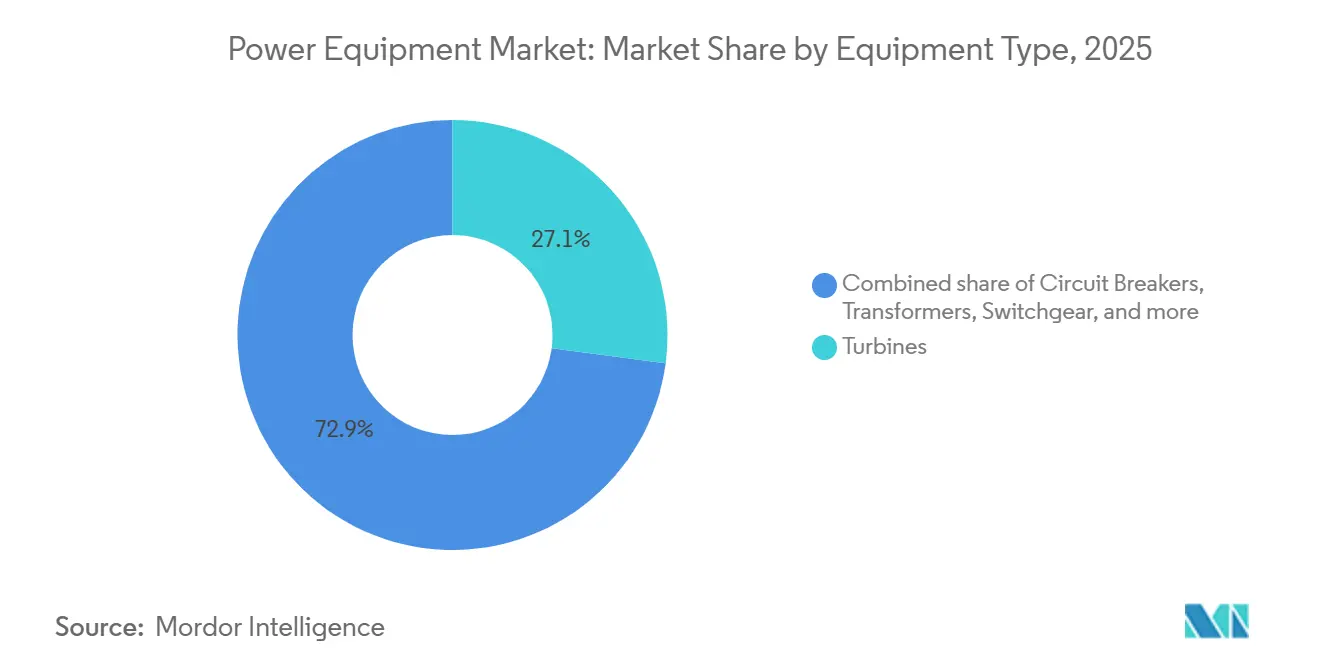
- By equipment type, turbines led with 27.1% revenue share of the power equipment market in 2025 and are forecast to grow at a 9.2% CAGR through 2031.
- By power-generation source, renewables captured a 61.2% share of the power equipment market in 2025, while the same segment is set to advance at a 12.4% CAGR to 2031.
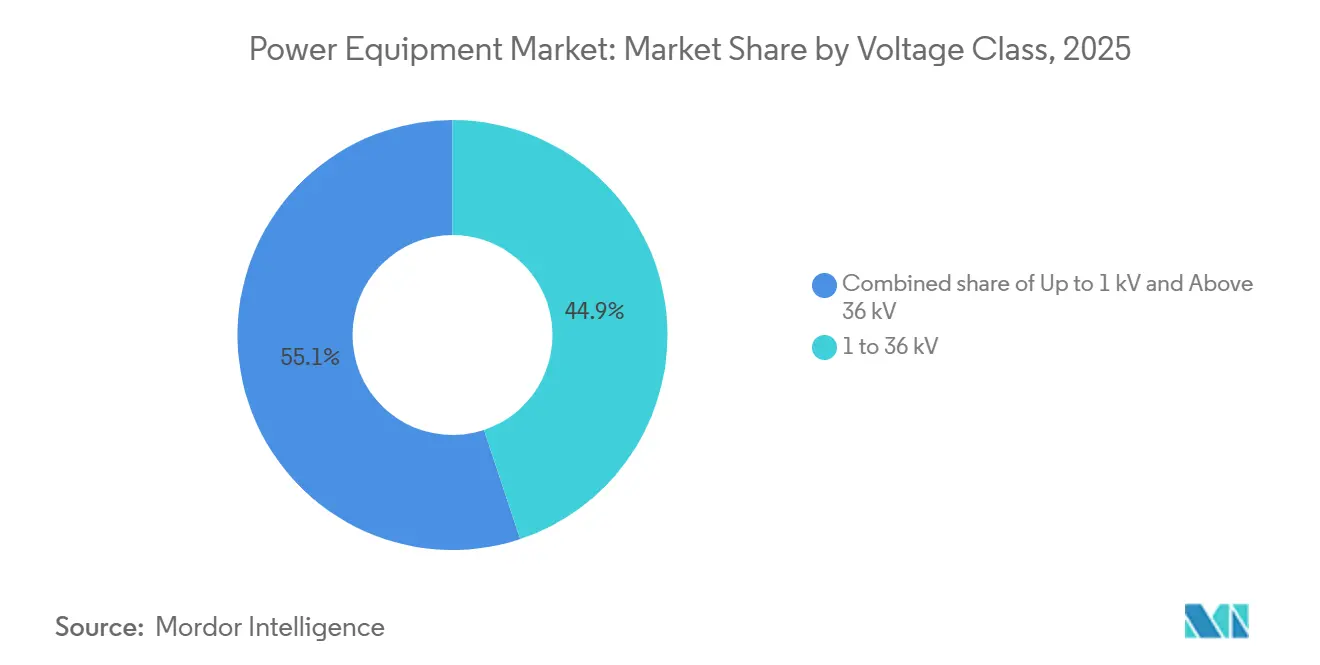
- By voltage class, 1-to-36-kilovolt equipment accounted for 44.9% of 2025 revenue, yet above-36-kilovolt gear will see the highest 8.5% CAGR through 2031.
- By application, transmission dominated with a 39.5% share in 2025, whereas power-generation equipment will post the fastest 9.1% CAGR to 2031.
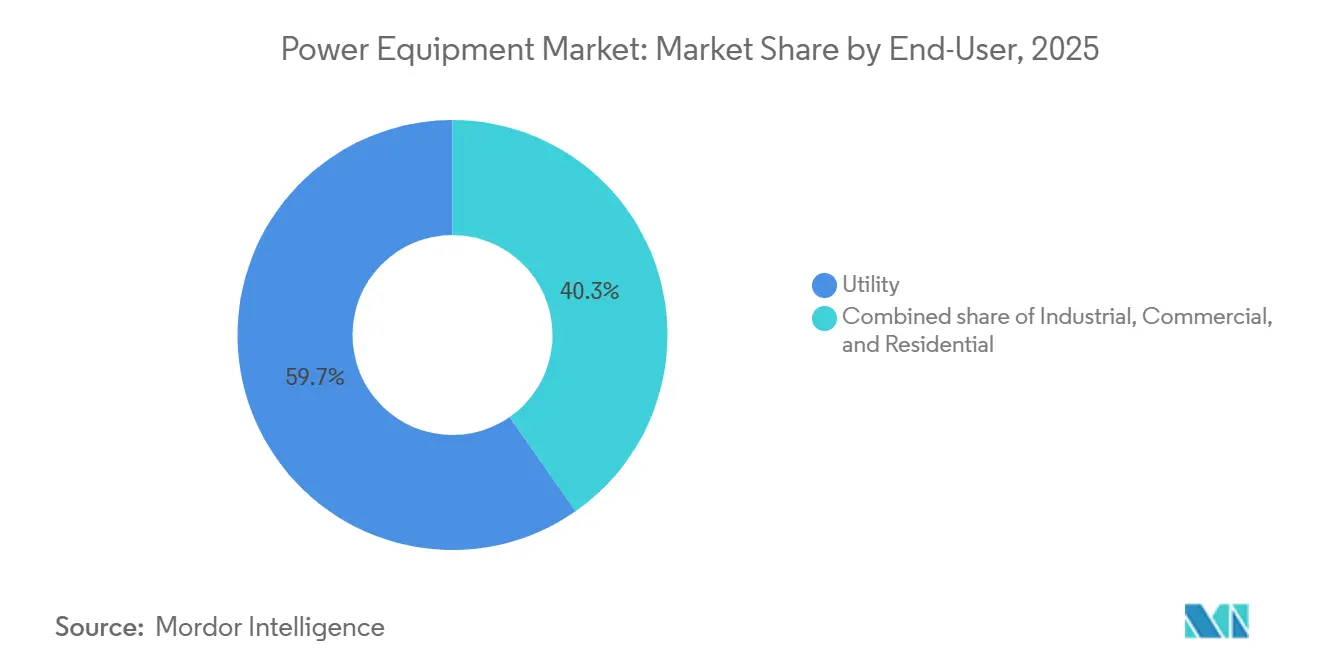
- By end-user, utilities retained 59.7% of 2025 spending, even as the industrial segment is expected to expand at an 8.8% CAGR through 2031.
- By geography, Asia-Pacific commanded 50.4% revenue share in 2025 and is projected to sustain a 9.0% CAGR through 2031.
Note: Market size and forecast figures in this report are generated using Mordor Intelligence’s proprietary estimation framework, updated with the latest available data and insights as of January 2026.
Global Power Equipment Market Trends and Insights
Drivers Impact Analysis*
| Driver | (~) % Impact on CAGR Forecast | Geographic Relevance | Impact Timeline |
|---|---|---|---|
| Rapid renewable-led grid modernization | 2.1% | Global, with concentration in EU, China, India, and US state-level mandates | Medium term (2-4 years) |
| Urbanization-fuelled infrastructure expansion in emerging economies | 1.8% | APAC core (India, Indonesia, Vietnam), Sub-Saharan Africa, Latin America | Long term (≥ 4 years) |
| Hyperscale data-centre back-up power build-out | 1.5% | North America, EU (Ireland, Netherlands, Nordics), Singapore, Australia | Short term (≤ 2 years) |
| Rural electrification & mini-grids in Africa-Asia | 0.9% | Sub-Saharan Africa (Nigeria, Kenya, Tanzania), South Asia (Bangladesh, Myanmar), Pacific Islands | Long term (≥ 4 years) |
| Rise of peer-to-peer micro-grids needing bi-directional switchgear | 0.7% | Pilot clusters in California, Germany, Australia; early commercial rollout in Japan, South Korea | Medium term (2-4 years) |
| Equipment-as-a-Service subscription models lowering capex | 0.6% | Global, with early adoption in North America, Western Europe, and Gulf Cooperation Council utilities | Medium term (2-4 years) |
| Source: Mordor Intelligence | |||


Rapid Renewable-Led Grid Modernization
Global operators are refitting networks to manage voltage fluctuations and reverse fault currents introduced by solar and wind inverters. IEA data show 507 gigawatts of renewable capacity came online in 2024, with USD 600 billion in grid reinforcements needed by 2030.[1]International Energy Agency, “Renewables 2025,” iea.org Transformer suppliers now integrate sub-second tap-changers, while switchgear vendors deploy arc-suppression modules that address bidirectional currents. Siemens Energy reported a 34% year-on-year rise in grid-stabilization orders in 2025, driven by North Sea offshore wind and Australia’s solar-plus-storage build-outs. IEEE 1547-2018 ride-through compliance has become the baseline for North American procurement, forcing vendors to certify anti-islanding features. These requirements are pushing R&D budgets toward interoperability rather than raw efficiency.
Urbanization-Fuelled Infrastructure Expansion in Emerging Economies
The United Nations projects India, Indonesia, and Nigeria will add 420 million urban residents between 2024 and 2035, demanding 280 gigawatts of new capacity.[2]United Nations DESA, “World Urbanization Prospects 2025,” un.org India’s Power Grid Corporation awarded USD 4.2 billion of 765-kilovolt contracts in 2025, while Indonesia’s PLN is procuring 15,000 distribution transformers annually through 2030. ABB opened a 50,000-square-meter transformer facility in Bengaluru in June 2025 to satisfy local-content rules. Suppliers are engineering cost-optimized products with shorter lead times, emphasizing volume over incremental efficiency.
Hyperscale Data-Center Back-Up Power Build-Out
Cloud operators are self-generating to guarantee uptime for AI training clusters. Microsoft deployed 1.2 gigawatts of backup capacity in 2024, mostly natural-gas engines and fuel cells. Cummins saw data-center generator orders jump 47% in early 2025, with average ratings rising to 3.5 megawatts. Google will pilot small modular reactors by 2028, signaling a move toward baseload captive assets. Regulatory shifts such as California’s proposed diesel limits are steering demand toward gas and hydrogen. This fragmentation creates parallel demand streams for utility-scale and modular equipment.
Rural Electrification & Mini-Grids
Development banks are funding containerized diesel-solar hybrids across Africa and South Asia. The World Bank’s Scaling Mini-Grids program financed 2,100 systems in 2024, each requiring smart inverters, low-voltage panels, and ruggedized switchgear. Vendors must design for harsh climates and minimal maintenance, often bundling long-term service contracts. Utilities in Kenya and Nigeria are adopting bi-directional meters that credit surplus solar exports. These deployments broaden the addressable base of the power equipment market beyond traditional utilities.
Restraints Impact Analysis*
| Restraint | (~) % Impact on CAGR Forecast | Geographic Relevance | Impact Timeline |
|---|---|---|---|
| High O&M cost of legacy fleets | -0.8% | North America, Western Europe, Japan—regions with aging coal and nuclear plants | Short term (≤ 2 years) |
| Volatile copper & rare-earth supply chains | -1.2% | Global, with acute pressure in EU and North America due to limited domestic refining | Short term (≤ 2 years) |
| Cyber-security certification delays for smart switchgear | -0.6% | North America, EU, Australia—markets with mandatory IEC 62351 compliance | Medium term (2-4 years) |
| Inverter-based resources reducing transformer demand | -0.5% | Microgrid and distributed-generation segments in California, Germany, Australia, India | Medium term (2-4 years) |
| Source: Mordor Intelligence | |||
Volatile Copper & Rare-Earth Supply Chains
Copper prices swung between USD 9,100 and USD 10,850 per ton from 2024 to mid-2026, creating 15%–18% bill-of-materials variance for transformers.[3]London Metal Exchange, “LME Copper Historical Data 2024-2026,” lme.com Neodymium oxide spiked to USD 94,000 per ton in early 2025 as Chinese export quotas tightened.[4]Reuters, “China Rare-Earth Quotas Tighten, Prices Surge,” reuters.com GE redesigned generator rotors with lower rare-earth content to offset a 220-basis-point margin squeeze reported in 2025 filings. Western governments issued USD 2.8 billion of grants in 2025 for domestic refining, but commercial output will not arrive before 2028. Vendors are trialing copper-aluminum hybrids and ferrite magnets, trading some efficiency for cost predictability.
Cyber-Security Certification Delays for Smart Switchgear
NERC’s 2024 CIP revisions stretched certification cycles from 6 to 14 months, prompting utilities to postpone commissioning until devices pass penetration tests. Hitachi Energy disclosed that 22% of its 2025 switchgear backlog faced IEC 62351 bottlenecks, especially in Australia. The EU’s NIS2 Directive assigns liability to manufacturers, compelling exhaustive supplier audits. Smaller firms lacking ISO 27001 credentials risk exclusion from vendor lists, fueling consolidation within the power equipment market.
*Our forecasts treat driver/restraint impacts as directional, not additive. The impact forecasts reflect baseline growth, mix effects, and variable interactions.
Segment Analysis
By Equipment Type: Turbines Lead Amid Combined-Cycle Resurgence
Turbines captured 27.1% of 2025 revenue, underpinning the largest slice of the power equipment market share, and they are set to expand at a 9.2% CAGR through 2031. Mitsubishi Power won a USD 1.1 billion order in February 2025 for six M701JAC units supporting Texas solar variability. Generators, particularly hydrogen-ready reciprocating sets, are scaling in off-grid mines and data-center campuses. Meanwhile, transformers face a two-track future: sub-36-kilovolt distribution models supply urban networks, whereas 100 MVA-plus power units feed ultra-high-voltage corridors. Switchgear is transitioning to solid-state interruption, evidenced by ABB’s 2024 acquisition of a software-defined protection firm. HVDC subsea cables are booming, as Prysmian’s EUR 8 billion backlog indicates.
Digitally enabled sensors embedded across these products generate predictive insights that shorten outage durations and cut O&M budgets. Edge analytics allow utilities to defer costly replacements, while manufacturers monetize data via subscription dashboards, reinforcing recurring-revenue profiles that underpin the broader power equipment market.


By Power Generation Source: Renewables Reshape Equipment Specifications
Renewables claimed 61.2% of 2025 demand and are forecast for a 12.4% CAGR, shifting design targets from capacity to controllability. Transformers now require broader voltage-regulation bands, and circuit breakers must clear bidirectional faults. Thermal plants are pivoting to flexible peakers; Siemens Energy’s HL-class ramps from 0% to 100% in under 10 minutes. Nuclear’s small modular reactors will necessitate radiation-tolerant switchgear by 2028.
Solar farms deploy distributed medium-voltage gear, while offshore wind hinges on subsea cables and floating substations. Carbon-capture retrofits add auxiliary loads, compelling uprated generators. Nuclear relicensing cycles drive digital control upgrades compliant with NRC cyber rules. Consequently, equipment architecture has become fuel-agnostic, emphasizing integration over type.
By Voltage Class: High-Voltage Transmission Gains Strategic Priority
Equipment above 36 kilovolts will grow at 8.5% through 2031, reflecting strategic investment in backbone corridors. China’s State Grid completed the ±500 kV Zhangbei line in 2024 and plans three additional ±800 kV projects announced in 2025. India is piloting 1,200 kV AC lines to slash line losses over 1,000 km. Gear rated 1–36 kV still holds 44.9% of 2025 sales, but adoption of automated fault isolation and demand-response interfaces is deepening digital penetration.
Low-voltage equipment serves residential niches; Schneider Electric’s Acti9 integrates arc-fault detection and remote monitoring for smart homes. European utilities converge on 20 kV to cut copper usage, whereas U.S. grids remain at 12.47 kV, sustaining duplicate supply chains. EPC-wrapped procurement dominates ultra-high-voltage projects as utilities outsource engineering complexity, and that dynamic is boosting vertical-integration strategies across the power equipment market.
By Application: Power Generation Accelerates as Captive Assets Proliferate
Power-generation equipment will log the fastest 9.1% CAGR through 2031, reflecting hyperscale and industrial self-generation. Transmission applications held 39.5% of 2025 revenue, anchored by cross-border HVDC schemes in Europe and Asia. Distribution gear benefits from urbanization, though price pressure persists as utilities demand extended warranties. AWS reported 4.3 gigawatts of captive capacity in 2025, underscoring the pivot to private generation.
U.S. DOE allocated USD 10.5 billion in 2024 for interregional lines set to break ground post-2026. Distribution networks are turning into active meshes, mandating tap-changing transformers and reclosers with integrated comms. Rural programs in Sub-Saharan Africa require containerized sets capable of operating in high-temperature environments. This diversification broadens total addressable markets, honing vendor focus on modularity and configurability.
By End-User: Industrial Segment Electrifies Heat and Transport
Utility buyers still command 59.7% of 2025 spending but are moving to performance-based contracts. Industrial customers, forecast for an 8.8% CAGR, are installing electric arc furnaces and microgrids. ArcelorMittal’s March 2025 plan to deploy 1.2 gigawatts of arc furnaces creates demand for harmonic-filtering switchgear. Eaton’s 2025 report shows microgrid controller sales doubling, led by pharma and food processors. Utilities like Southern Company installed 850 megawatts of grid-scale batteries in 2024, pairing advanced inverters with frequency-support algorithms.
Commercial buildings deploy energy-management systems that optimize HVAC and lighting against time-of-use tariffs. The boundaries between segments blur as factories export surplus power, utilities pay residential customers for demand response, and shopping centers host EV chargers needing substation-level capacity. These cross-currents reinforce continuous demand diversity within the power equipment market.
Geography Analysis
Asia-Pacific held 50.4% of global revenue in 2025 and will sustain a 9.0% CAGR, propelled by China’s ±800 kV corridors, India’s renewables auctions, and ASEAN coal-to-gas conversions. State Grid invested USD 58 billion in 2024, emphasizing long-haul HVDC to coastal load centers. India auctioned 50 gigawatts of renewables in 2024, triggering USD 12 billion of evacuation contracts. Japan’s 1.2 gigawatt Chiba offshore wind farm, awarded in 2025, requires floating substations and 66 kV cables. South Korea’s Green New Deal budgets KRW 73.4 trillion through 2030 for digital substations. ASEAN nations secured USD 4.2 billion in ADB transmission funding in 2025.
North America and Europe prioritize grid resilience. The U.S. Inflation Reduction Act’s tax credits catalyze projects like the 3 GW TransWest Express line. Germany approved EUR 24 billion of expansion in 2025, including SuedLink. The UK road-mapped 4,000 km of offshore circuits costing GBP 18 billion. Nordic states expand cross-border connectors such as the EUR 1.3 billion NordLink.
South America and the Middle East show rising opportunity. Brazil auctioned 15 GW of concessions in 2024, drawing Siemens Energy and WEG bids. Chile’s Atacama solar corridor employs 500 kV lines commissioned in 2025. Saudi Arabia earmarked USD 7.5 billion in 2024 for renewable transmission under PIF. DEWA let a USD 1.8 billion 400 kV contract in 2025 for the MBR Solar Park integration. Off-grid African mini-grids financed by the World Bank round out demand diversity.

Competitive Landscape
The top 10 suppliers captured roughly half of global revenue in 2025, indicating moderate concentration. Incumbents expand vertical integration: Hitachi Energy acquired a digital-twin firm in 2024, bundling predictive analytics with transformer sales. Schneider Electric links switchgear to Azure’s cloud stack for continuous monitoring. White-space entrants focus on inverter simulation and cybersecurity, with Typhoon HIL and OPAL-RT supplying real-time testbeds adopted by utilities.
Technology differentiation remains central. ABB’s Ability platform aggregates data from 70,000 devices, predicting failures months in advance. Siemens Energy’s Omnivise suite cuts gas-turbine outages by up to 20%. Equipment-as-a-service offerings rapidly expand; Eaton’s subscription revenue nearly doubled between 2023 and 2025. Patent filings in solid-state breakers and grid-forming inverters rose 38% in 2024, evidencing intensifying R&D races.
Materials risk and cyber compliance add barriers to entry. Manufacturers with captive copper or rare-earth supply and ISO 27001-certified security operations earn preferred-vendor status. Regional champions retain niche dominance, Prysmian in subsea cables and Hyundai Electric in Korean GIS. However, backlog bottlenecks tied to IEC 62351 testing encourage mergers as smaller firms struggle with compliance costs, reinforcing scale advantages within the power equipment market.
Power Equipment Industry Leaders
General Electric Company
ABB Ltd
Siemens AG
Schneider Electric SE
Mitsubishi Electric Corporation
- *Disclaimer: Major Players sorted in no particular order

Recent Industry Developments
- January 2026: In a significant move, Mitsubishi Power, the energy solutions arm of Mitsubishi Heavy Industries, Ltd. (MHI), has secured a pivotal contract. Collaborating with Samsung C&T Engineering & Construction Group, a designated Engineering, Procurement, and Construction (EPC) contractor by Ras Abu Fontas Power Company, and joining forces with Qatar General Electricity and Water Corporation (KAHRAMAA), Mitsubishi Power is set to supply its state-of-the-art gas turbine technology.
- December 2025: SSEN Transmission awarded contracts to Hitachi Energy for HVDC converter stations on two significant Scottish links: the Western Isles connection and the Spittal-Peterhead corridor.
- November 2025: Siemens Energy is set to invest USD 2.3 billion in transformer and switchgear factories by 2028, aiming to bolster global grid capacity in response to surging electricity demand.
- October 2025: Tata Power Company Limited awarded Schneider Electric a significant contract to deploy 11kV SF6-Free Ring Main Units (RMUs), utilizing Schneider Electric's advanced RM AirSeT SF6 Free technology.


Global Power Equipment Market Report Scope
Power equipment refers to a wide range of devices, machinery, and components that generate, transmit, and distribute electrical power. These pieces of equipment play vital roles in ensuring power systems' reliable and efficient operation.
The power equipment market is segmented by equipment type, power generation source, voltage class, application, end-user, and geography. By equipment type, the market is segmented into turbines, generators, transformers, switchgear, circuit breakers, and power cables. By power generation source, the market is categorized into thermal, nuclear, and renewables. By voltage class, the market is segmented into up to 1 kV, 1 to 36 kV, and above 36 kV. By application, the market is segmented into power generation, transmission, and distribution. By end-user, the market is segmented into residential, commercial, industrial, and utility. By geography, the market is segmented into North America, Europe, Asia-Pacific, South America, and the Middle East and Africa. The report also covers the market sizes and forecasts for the global power equipment market across major countries within each region. For each segment, market sizing and forecasts have been provided on the basis of value (USD).
| Turbines |
| Generators |
| Transformers |
| Switchgear |
| Circuit Breakers |
| Power Cables |
| Other Equipment (Transmission Towers, Voltage Regulators, Insulators, Capacitors, Shunt Reactor, Relays, Substation Structures, etc.) |
| Thermal |
| Nuclear |
| Renewables |
| Up to 1 kV |
| 1 to 36 kV |
| Above 36 kV |
| Power Generation |
| Transmission |
| Distribution |
| Residential |
| Commercial |
| Industrial |
| Utility |
| North America | United States |
| Canada | |
| Mexico | |
| Europe | Germany |
| France | |
| United Kingdom | |
| Italy | |
| NORDIC Countries | |
| Russia | |
| Rest of Europe | |
| Asia-Pacific | China |
| India | |
| Japan | |
| South Korea | |
| ASEAN Countries | |
| Australia and New Zealand | |
| Rest of Asia-Pacific | |
| South America | Brazil |
| Argentina | |
| Chile | |
| Rest of South America | |
| Middle East and Africa | Saudi Arabia |
| United Arab Emirates | |
| South Africa | |
| Egypt | |
| Rest of Middle East and Africa |
| By Equipment Type | Turbines | |
| Generators | ||
| Transformers | ||
| Switchgear | ||
| Circuit Breakers | ||
| Power Cables | ||
| Other Equipment (Transmission Towers, Voltage Regulators, Insulators, Capacitors, Shunt Reactor, Relays, Substation Structures, etc.) | ||
| By Power Generation Source | Thermal | |
| Nuclear | ||
| Renewables | ||
| By Voltage Class | Up to 1 kV | |
| 1 to 36 kV | ||
| Above 36 kV | ||
| By Application | Power Generation | |
| Transmission | ||
| Distribution | ||
| By End-User | Residential | |
| Commercial | ||
| Industrial | ||
| Utility | ||
| By Geography | North America | United States |
| Canada | ||
| Mexico | ||
| Europe | Germany | |
| France | ||
| United Kingdom | ||
| Italy | ||
| NORDIC Countries | ||
| Russia | ||
| Rest of Europe | ||
| Asia-Pacific | China | |
| India | ||
| Japan | ||
| South Korea | ||
| ASEAN Countries | ||
| Australia and New Zealand | ||
| Rest of Asia-Pacific | ||
| South America | Brazil | |
| Argentina | ||
| Chile | ||
| Rest of South America | ||
| Middle East and Africa | Saudi Arabia | |
| United Arab Emirates | ||
| South Africa | ||
| Egypt | ||
| Rest of Middle East and Africa | ||


Key Questions Answered in the Report
How large is the global power equipment market in 2026?
The power equipment market size stands at USD 0.84 trillion in 2026 and is forecast to reach USD 1.23 trillion by 2031.
Which geographical region contributes the most revenue?
Asia-Pacific contributes 50.4% of global revenue and is projected to grow at a 9.0% CAGR through 2031.
What equipment segment is growing fastest?
Turbines lead growth, expanding at a 9.2% CAGR as combined-cycle and peaking-plant demand accelerates.
How are data centers influencing demand?
Hyperscale operators are installing on-site gas engines, fuel cells, and future small modular reactors, driving rapid uptake of digitally enabled generators and switchgear.
What are key supply-chain risks for manufacturers?
Volatile copper and rare-earth prices and cyber-security certification delays are compressing margins and extending project timelines.
Page last updated on:


