Market Overview
| Study Period | 2020 - 2030 |
|---|---|
| Forecast Data Period | 2025 - 2030 |
| Historical Data Period | 2020 - 2023 |
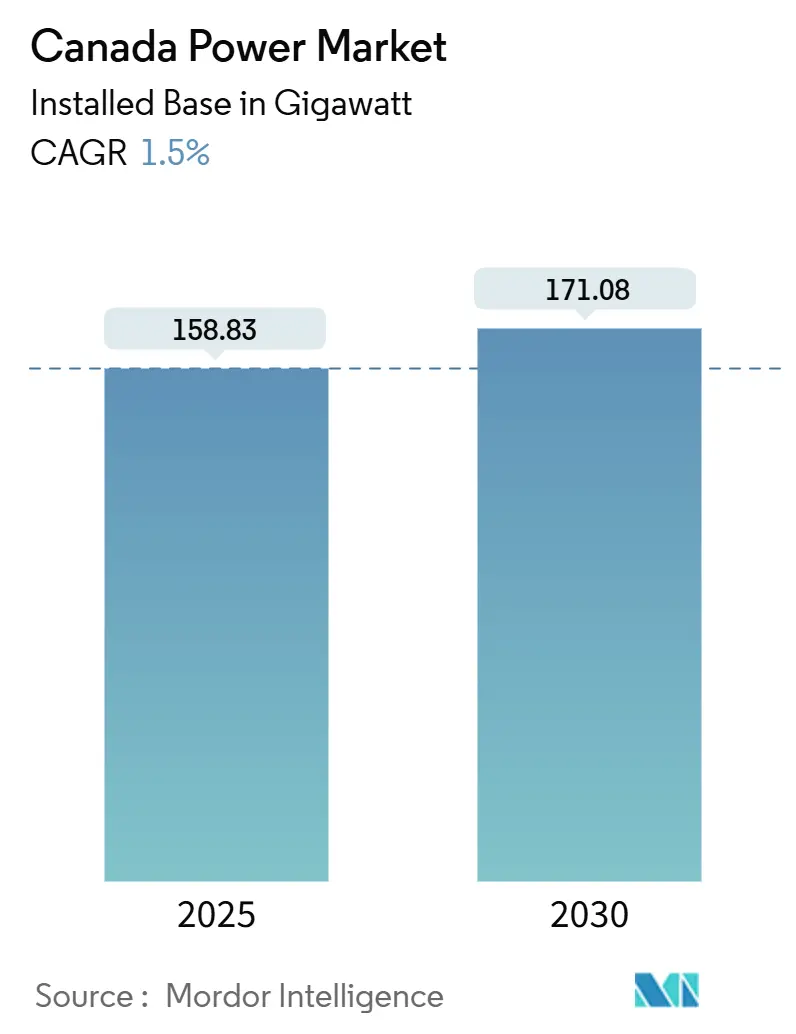
| Market Volume (2025) | 158.83 gigawatt |
| Market Volume (2030) | 171.08 gigawatt |
| Growth Rate (2025 - 2030) | 1.50% CAGR |
| Market Concentration | Medium |
Major Players *Disclaimer: Major Players sorted in no particular order Image © Mordor Intelligence. Reuse requires attribution under CC BY 4.0. | |
Canada Power Market Analysis by Mordor Intelligence
The Canada Power Market size in terms of installed base is expected to grow from 158.83 gigawatt in 2025 to 171.08 gigawatt by 2030, at a CAGR of 1.5% during the forecast period (2025-2030).
Accelerated coal retirements in Alberta and Saskatchewan, paired with hydro-refurbishment programs in Quebec and British Columbia, are reshaping the generation mix. Industrial electrification in the oil-sands and mining sectors, rapid cross-border exports to the United States, and the rollout of utility-scale storage are adding new demand and flexibility opportunities. Provincial crown corporations continue to dominate transmission and baseload supply, yet independent developers are scaling wind, solar, and battery projects under long-term contracts. Transmission bottlenecks in remote Indigenous territories, together with the decade-long approval cycles for large hydro and nuclear builds, remain the key structural constraints on near-term capacity additions.
Key Report Takeaways
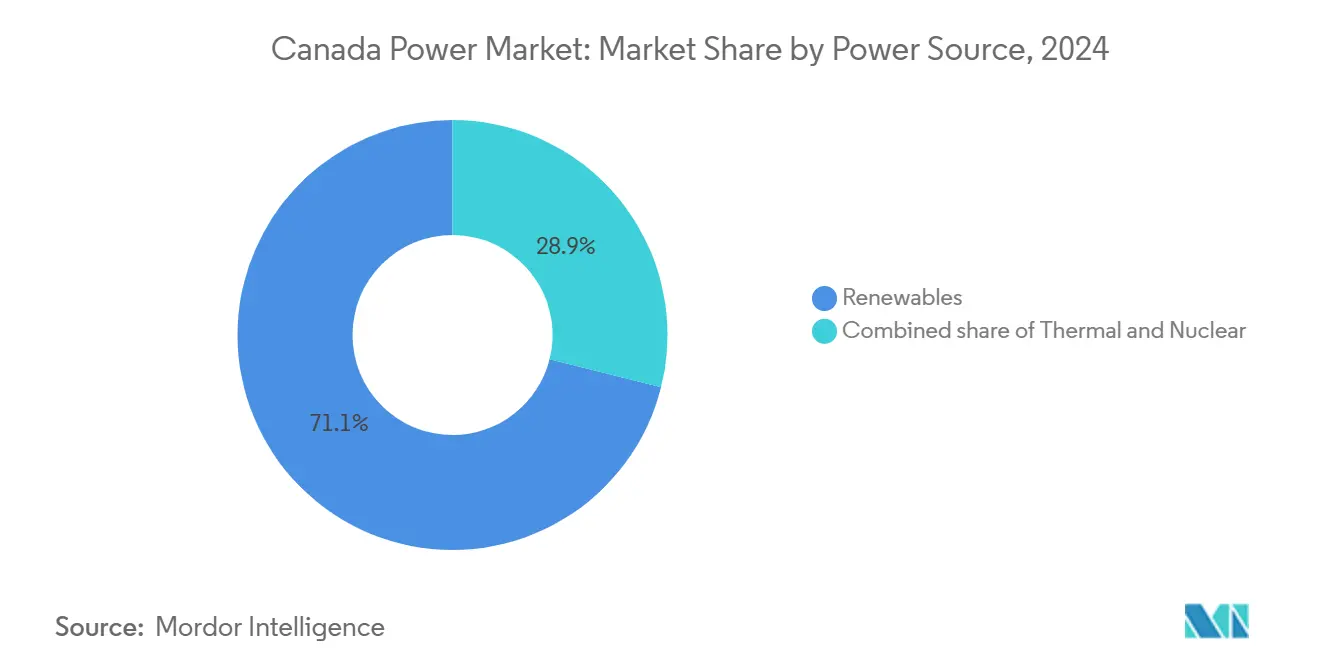
- By power source, renewables held 71.1% of Canada's power market share in 2024; thermal replacement demand positions the segment to expand at a 2.3% CAGR through 2030.
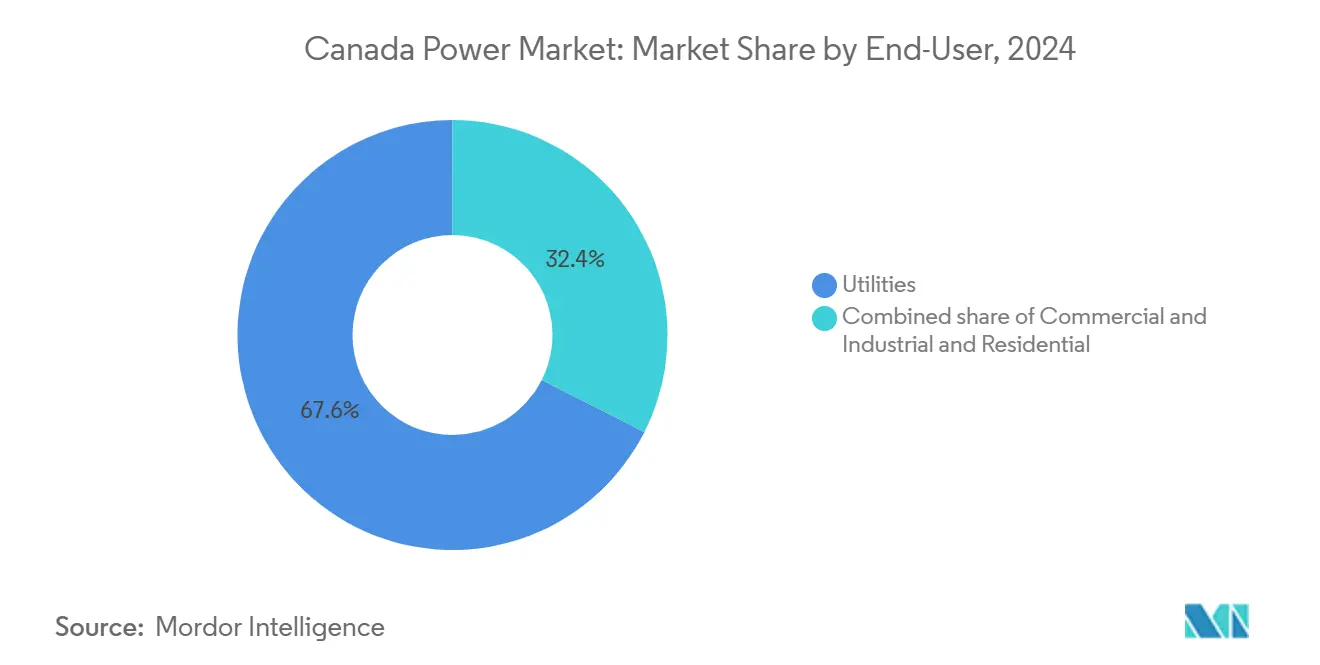
- By end user, the commercial and industrial segment accounted for 39.2% of the Canada power market size in 2024 and is forecast to grow at a 2.9% CAGR to 2030.
Canada Power Market Trends and Insights
Drivers Impact Analysis*
| Driver | (~) % Impact on CAGR Forecast | Geographic Relevance | Impact Timeline |
|---|---|---|---|
| Government investment in clean energy and net-zero carbon mandate | +0.4% | National, high in Alberta, Ontario, Quebec | Long term (≥ 4 years) |
| Rapid coal retirement in Alberta and Saskatchewan | +0.3% | Alberta, Saskatchewan | Short term (≤ 2 years) |
| Hydroelectric refurbishment programs | +0.2% | Quebec, British Columbia | Medium term (2-4 years) |
| Electrification of oil-sands operations and mining rigs | +0.3% | Alberta, Saskatchewan, Northern territories | Medium term (2-4 years) |
| Rising cross-border power trade with the U.S. Northeast | +0.2% | Quebec, Ontario, Manitoba | Long term (≥ 4 years) |
| Utility-scale storage integration within provincial ISOs | +0.1% | Alberta, Ontario, British Columbia | Medium term (2-4 years) |
| Source: Mordor Intelligence | |||
Government Investment in Clean Energy and Net-Zero Carbon Mandate
Federal and provincial governments allocated CAD 9.1 billion (USD 6.7 billion) for clean-energy infrastructure in 2024, funding grid modernization, renewable procurement, and carbon-capture retrofits.[1]Environment and Climate Change Canada, “2030 Emissions Reduction Plan,” Government of Canada, canada.ca The 2030 Emissions Reduction Plan requires a 40% cut in power-sector emissions relative to 2005, effectively eliminating unabated coal and natural-gas generation by decade-end. Hydro-rich provinces can comply by refurbishing legacy dams and strengthening interties, while fossil-based jurisdictions must deploy gigawatt-scale wind, solar, and storage within compressed timelines. The Canada Infrastructure Bank’s subordinated-debt facility priced 200 basis points below market rates and unlocked 3.2 GW of new renewables in 2024. Independent producers are leveraging these terms to undercut traditional cost-of-service tariffs, pressuring regulators to rethink legacy rate models.
Rapid Retirement of Coal-Fired Capacity in Alberta & Saskatchewan Driving Replacement Demand
Alberta retired 2.1 GW of coal capacity in 2024, pushing cumulative shutdowns since 2019 to 4.8 GW, while Saskatchewan decommissioned 0.6 GW at Boundary Dam and Poplar River.[2]Alberta Electric System Operator, “Long-Term Adequacy Report 2024,” aeso.ca TransAlta’s 2024 conversions added 1.4 GW of gas-fired flexibility, but merchant exposure to volatile AECO pricing threatens project economics. The AESO projects a 1.2 GW supply gap by 2028 if wind and solar roll-outs lag retirements, a scenario that could force emergency imports from British Columbia. Power-price spikes above CAD 100 per MWh during the 2024 winter peaks have created a window for developers to secure scarcity rents ahead of capacity saturation.
Hydroelectric Infrastructure Refurbishment Programs Led by Quebec & British Columbia
Hydro-Québec directed CAD 3.2 billion (USD 2.4 billion) in 2024 to turbine, generator, and spillway upgrades at 1960-1980 vintage plants, targeting a 1.5 GW efficiency-based capacity gain by 2030.[3]Hydro-Québec, “Annual Report 2024,” hydroquebec.com BC Hydro’s completion of the 1.1 GW Site C dam revealed an 84% cost overrun, prompting regulators to favor refurbishment over greenfield dams. Replacing legacy Francis turbines with variable-speed units lifts output 8%-12% at one-tenth the cost of new construction. Surplus hydro exports, 2.4 GW in contracts signed during 2024, cross-subsidize domestic rates, but rising U.S. local-content rules may curb future export premiums.
Electrification of Oil-Sands Operations and Mining Rigs
Oil-sands operators consumed 18.2 TWh in 2024, up from 14.7 TWh in 2020, as electric steam generation replaced gas boilers to reduce Scope 1 emissions under an escalating carbon price that reached CAD 80 per tonne. Suncor and Cenovus aim to electrify 40% of steam capacity by 2030, requiring 1.8 GW of incremental grid supply. Teck Resources committed CAD 600 million (USD 442 million) to battery-electric haul trucks fed by on-site microgrids. Industrial demand is rising 3.2% yearly, versus 0.8% in residential and commercial segments, forcing utilities to revisit planning assumptions built around flat industrial loads.
Restraints Impact Analysis*
| Restraint | (~) % Impact on CAGR Forecast | Geographic Relevance | Impact Timeline |
|---|---|---|---|
| Long Lead-time for Large Hydro and Nuclear Project Approvals | -0.2% | National, concentrated in Ontario, Quebec, British Columbia | Long term (≥ 4 years) |
| Transmission Bottlenecks in Remote Indigenous Territories | -0.1% | Northern territories, remote regions of Alberta, British Columbia, Ontario, Manitoba | Medium term (2-4 years) |
| Volatile Natural-Gas Prices Affecting Gas-Fired Plant Competitiveness | -0.15% | Alberta, Saskatchewan, Ontario | Short term (≤ 2 years) |
| Rising Community Opposition to On-shore Wind Farms in Atlantic Canada | -0.05% | Nova Scotia, New Brunswick, Prince Edward Island, Newfoundland and Labrador | Medium term (2-4 years) |
| Source: Mordor Intelligence | |||
Long Lead-Time for Large Hydro and Nuclear Project Approvals
Major hydro and nuclear builds require 10-15 years from filing to commercial operation under the Impact Assessment Act and Indigenous consultation rules. Ontario Power Generation’s 300 MW Darlington small modular reactor, cleared in December 2024, will not enter service until 2029. BC Hydro’s Site C dam faced nine years of litigation, inflating costs and delaying output. Such timelines curb private investment appetite for baseload assets, channeling capital into wind, solar, and storage projects that reach operation within 36 months, yet lack the capacity factors to fully replace retiring coal and nuclear plants.
Transmission Bottlenecks in Remote Indigenous Territories
Section 35 consultation and the United Nations Declaration on the Rights of Indigenous Peoples extend transmission permitting by 24-36 months and raise capital costs 15%-25%. Hydro One’s Waasigan line faced delays when Lac Seul First Nation renegotiated revenue-sharing terms in 2024. The Canadian Electricity Association estimates permitting delays added CAD 1.2 billion (USD 884 million) to 2024 transmission costs and deferred 2.1 GW of renewables awaiting grid access. Developers are rerouting projects around contested lands or shelving them when alternatives prove uneconomic.
*Our forecasts treat driver/restraint impacts as directional, not additive. The impact forecasts reflect baseline growth, mix effects, and variable interactions.
Segment Analysis
By Power Source: Renewables Anchor Decarbonization Trajectory
Renewables accounted for 71.1% of 2024 capacity, led by hydro, wind, and solar additions that collectively are forecast to expand at a 2.3% CAGR through 2030.[4]Canada Energy Regulator, “Canada’s Energy Future 2024,” Government of Canada, cer-rec.gc.ca Hydroelectric assets provided roughly 60% of renewable capacity, though greenfield dams face environmental and Indigenous hurdles limiting new sites. Wind additions averaged 1.8 GW in 2024, with contract prices below CAD 50 per MWh, undercutting new gas builds in Alberta. Solar build-outs centered on southern Ontario and Alberta, where federal tax credits drove utility-scale projects below CAD 40 per MWh.
Declining coal now represents just 20.4% of capacity, while natural-gas plants serve peak-shaving roles rather than constant baseload. Nuclear maintained an 8.5% share as Ontario’s 13 CANDU reactors secured life-extension approvals. The renewables-heavy generation mix reinforces the long-run shift in the Canada power market toward low-carbon sources while highlighting the need for storage, interties, and demand-response to keep reserve margins intact. The renewables segment captured 71.1% of the Canada power market share in 2024 and is set to retain the dominant position through the forecast.


By End User: Industrial Electrification Outpaces Utility Growth
Utilities controlled 60.8% of installed capacity in 2024, but commercial and industrial customers are scaling faster on the back of oil-sands electrification, mining decarbonization, and data-center builds.[5]Suncor Energy, “Oil Sands Electrification Strategy,” suncor.com Oil-sands electricity use rose to 18.2 TWh in 2024, a 24% jump since 2020, and electrification commitments imply an additional 1.8 GW of grid demand by 2030. Teck Resources and Barrick Gold plan to electrify mine fleets, adding 0.9 GW of incremental load. Cloud providers announced 1.2 GW of data-center capacity in Quebec and Ontario, attracted by low-carbon hydro supplies.
Residential demand edges up 0.6% annually, dampened by efficiency gains from heat pumps and new codes. Behind-the-meter solar and cogeneration allow industrial customers to bypass utility offtake, reducing volumetric revenues for transmission owners. Consequently, the commercial and industrial segment is projected to add the highest incremental capacity within the Canada power market, challenging regulators to redesign tariffs that recover fixed grid costs even as throughput declines.
Geography Analysis
Alberta and Saskatchewan lead the disruptive transition, having eliminated 4.8 GW of coal since 2019 and procured 6.2 GW of replacement wind, solar, and gas. Alberta’s merchant framework attracted TransAlta, Capital Power, and Brookfield Renewable, but also exposed consumers to winter power peaks above CAD 150 per MWh in January 2024. Saskatchewan’s regulated model permits recovery of stranded coal assets, yet its slower renewables roll-out increases reliance on gas peakers amid AECO price swings. Both provinces require new high-voltage lines to connect southern wind zones to northern industrial loads.
Hydro-dominant Quebec and British Columbia together operated 60 GW of hydro in 2024, with Quebec exporting 2.4 GW to New York and New England under contracts signed the same year. BC Hydro’s Site C came online at 1.1 GW, but its cost overruns hardened political resistance to future megadams. Both provinces now emphasize grid optimization over generation growth, pursuing transmission upgrades and demand-side management to accommodate electrification.
Ontario runs a hybrid market where the IESO dispatches crown-owned, private, and imported generation. Nuclear supplied 55% of output in 2024 and, after refurbishments, will remain critical to reserve margins through 2055. Atlantic Canada remains the most fossil-exposed region, with coal and gas at 48% of 2024 generation, though Nova Scotia’s 80% renewable target for 2030 is catalyzing rapid wind build-outs.
Competitive Landscape
Crown corporations, Hydro-Québec, Ontario Power Generation, BC Hydro, SaskPower, and Manitoba Hydro, held 68% of installed capacity in 2024, leveraging ownership of transmission to secure low-cost-of-capital financing. Independent power producers, including Brookfield Renewable, TransAlta, and Northland Power, operate mainly under 20-25-year contracts that shelter returns yet cap merchant upside. This two-tier system positions crown entities as baseload stewards while private developers chase contracted renewables.
Battery storage represents a competitive white space. Capital Power’s 400 MW/1,600 MWh facility, commissioned in October 2024, stands as the largest in Canada, signaling a foothold for IPPs outside traditional cost-of-service territories. Crown utilities have yet to dominate storage, enabling private entrants to define pricing and ancillary-service revenue streams.
Grid-edge technologies are also gaining traction. Hydro One installed 1.2 million smart meters in 2024, unlocking time-of-use tariffs and demand response. FortisBC and Emera completed distribution-automation rollouts that cut outage durations by 15%-20%. These upgrades give regulated utilities new levers to protect revenue as distributed generation erodes volumetric sales.
Canada Power Industry Leaders
Hydro-Québec
Ontario Power Generation
TC Energy Corp.
Brookfield Renewable Partners
TransAlta Corporation
- *Disclaimer: Major Players sorted in no particular order

Recent Industry Developments
- February 2025: Hydro-Québec signed a 20-year agreement with NYSERDA to supply 1.25 GW via the Champlain Hudson line, valued at USD 3.8 billion.
- January 2025: Brookfield Renewable bought a 1.2 GW Alberta wind–solar portfolio from TransAlta for CAD 1.9 billion.
- December 2024: OPG received approval to move forward with a 300 MW Darlington SMR slated for 2029 service.
- November 2024: TC Energy sold its 50% Bruce Power stake to an OMERS-led group for CAD 2.4 billion.
- October 2024: Capital Power commissioned a 400 MW battery facility in Alberta, the country’s largest storage asset.


Canada Power Market Report Scope
The Canadian power market report includes:
By Power Source
| Thermal (Coal, Natural Gas, Oil and Diesel) |
| Nuclear |
| Renewables (Solar, Wind, Hydro, Geothermal, Biomass & Waste, Tidal) |
By End User
| Utilities |
| Commercial and Industrial |
| Residential |
By T&D Voltage Level (Qualitative Analysis only)
| High-Voltage Transmission (Above 230 kV) |
| Sub-Transmission (69 to 161 kV) |
| Medium-Voltage Distribution (13.2 to 34.5 kV) |
| Low-Voltage Distribution (Up to 1 kV) |
| By Power Source | Thermal (Coal, Natural Gas, Oil and Diesel) |
| Nuclear | |
| Renewables (Solar, Wind, Hydro, Geothermal, Biomass & Waste, Tidal) | |
| By End User | Utilities |
| Commercial and Industrial | |
| Residential | |
| By T&D Voltage Level (Qualitative Analysis only) | High-Voltage Transmission (Above 230 kV) |
| Sub-Transmission (69 to 161 kV) | |
| Medium-Voltage Distribution (13.2 to 34.5 kV) | |
| Low-Voltage Distribution (Up to 1 kV) |


Key Questions Answered in the Report
How fast is installed capacity in the Canada power market expected to grow?
Total capacity is forecast to rise from 158.83 GW in 2025 to 171.08 GW by 2030, delivering a 1.50% CAGR.
Which generation segment will add the most new capacity by 2030?
Renewables will lead, expanding at a 2.3% CAGR on the back of wind, solar, and hydro-refurbishment programs.
Why are battery projects receiving strong interest from developers?
Four-hour lithium-ion systems now cost about CAD 285 per kWh, enabling them to outcompete gas peakers for peak-shaving and ancillary services.
What is driving the surge in industrial power demand?
Oil-sands electrification, mine-fleet decarbonization, and hyperscale data-center construction are together lifting industrial loads at a 3.2% annual pace.
Which provinces export the most electricity to the United States?
Quebec, Ontario, and Manitoba dominate exports, with Hydro-Québec alone securing 2.4 GW of contracts to the U.S. Northeast.
How long does it take to build new large hydro or nuclear projects in Canada?
Approval and construction typically span 10-15 years due to federal assessments and Indigenous consultations.
Page last updated on:


