Market Overview
| Study Period | 2021 - 2031 |
|---|---|
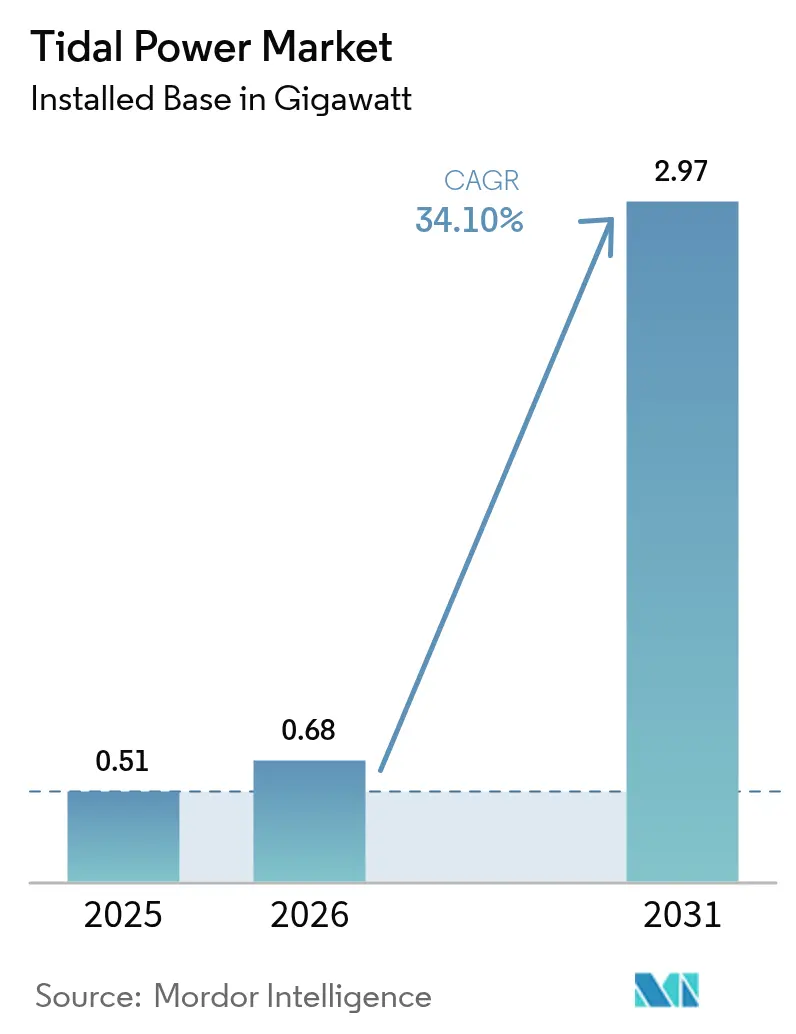
| Market Volume (2026) | 0.68 gigawatt |
| Market Volume (2031) | 2.97 gigawatt |
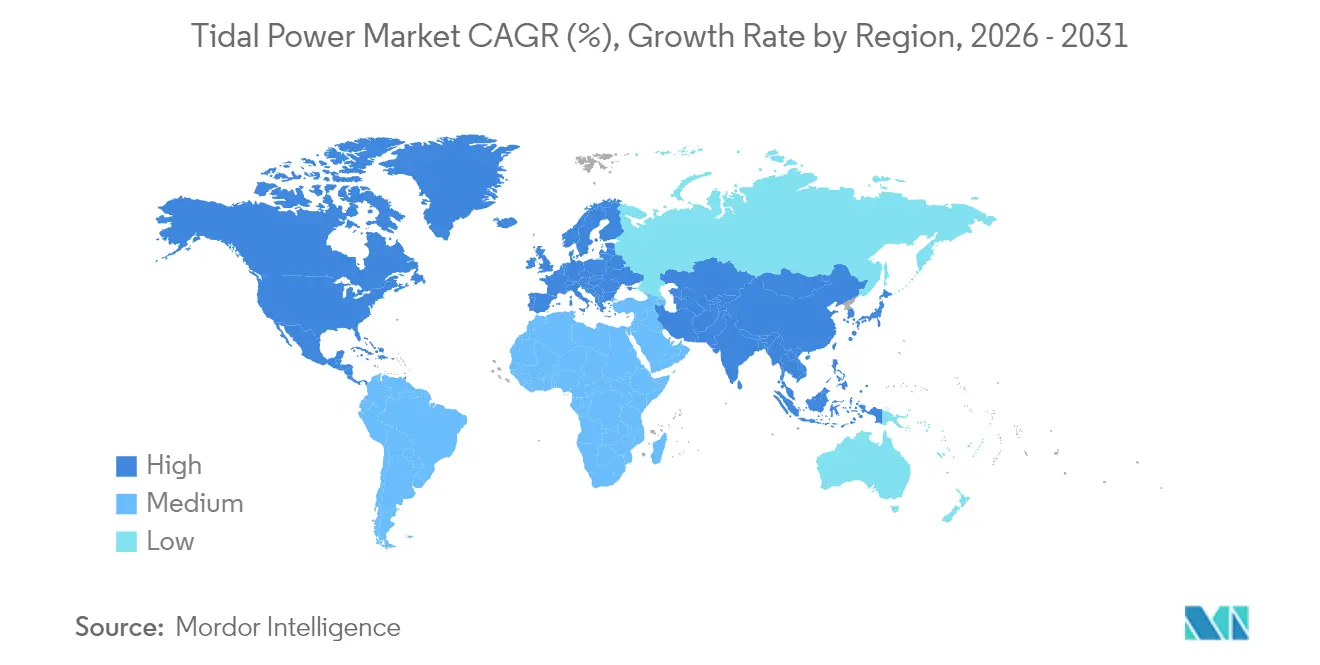
| Growth Rate (2026 - 2031) | 34.10% CAGR |
| Fastest Growing Market | North America |
| Largest Market | Asia Pacific |
| Market Concentration | Medium |
Major Players
*Disclaimer: Major Players sorted in no particular order Image © Mordor Intelligence. Reuse requires attribution under CC BY 4.0. |
|
Tidal Power Market Analysis by Mordor Intelligence
Tidal Power market size in 2026 is estimated at 0.68 gigawatt, growing from 2025 value of 0.51 gigawatt with 2031 projections showing 2.97 gigawatt, growing at 34.10% CAGR over 2026-2031.
This surge from a 511.15 MW base in 2024 underscores the sector’s move from demonstration arrays to bankable commercial plants. Unlike wind and solar, tidal projects deliver power on a timetable set by the moon, giving grid operators a degree of certainty they rarely enjoy with weather-driven assets.[1]Lancaster University, “Integrating Predictable Renewables into the Grid,” lancaster.ac.uk Asia-Pacific anchored 50.9% of global installations in 2024 and remains the volume leader, while North America is projected to post the fastest regional climb through 2030, thanks to Alaska’s Cook Inlet resource and new U.S. federal incentives. Power-only schemes still dominate, claiming 78.2% of deployments, yet desalination plants tied to tidal flows are expanding at the highest rate as coastal communities pursue water security. Tidal-barrage assets hold a 44.7% share of the tidal power market, but floating platforms are accelerating at a 36.5% clip as deeper-water anchoring systems mature.
Key Report Takeaways
- By the generation method, tidal-barrage plants accounted for 44.12% of the tidal power market share in 2025; floating platforms are forecasted to expand at a 35.30% CAGR through 2031.
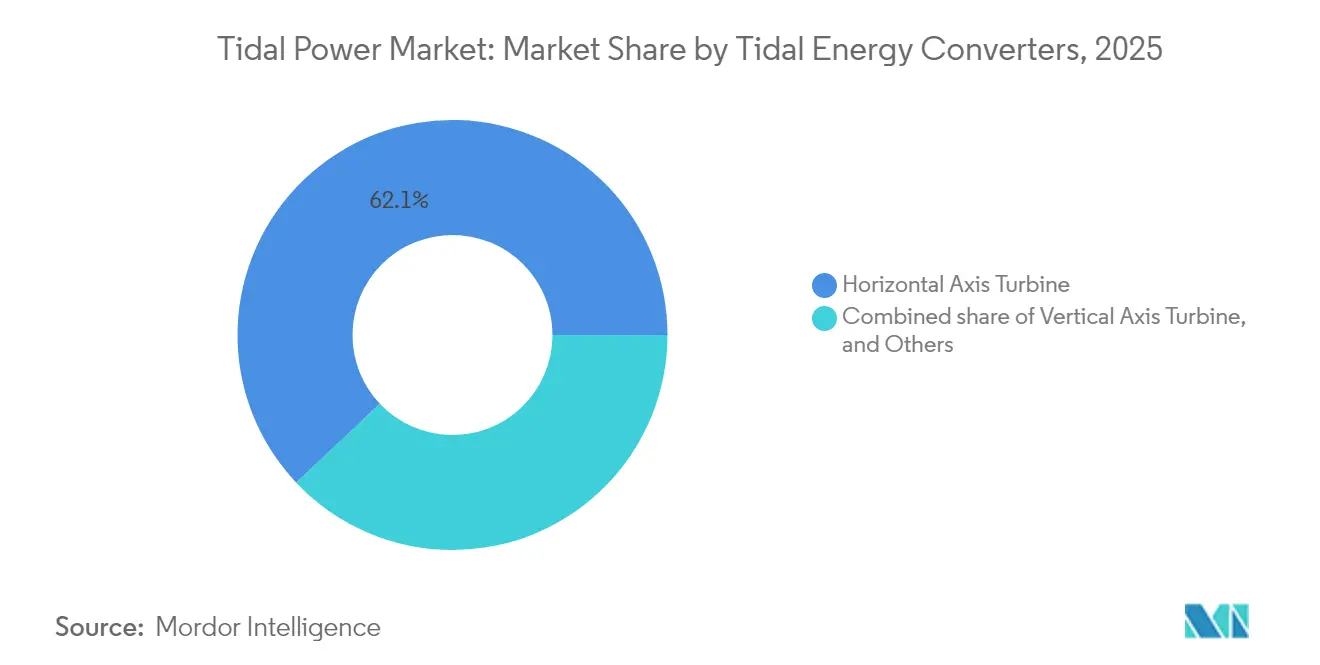
- By converter type, horizontal-axis turbines captured 62.05% of the tidal power market share in 2025 and are set to grow at a 34.90% CAGR through 2031.
- By application, power-only projects represented 77.65% of the tidal power market size in 2025, while desalination systems are projected to grow at a 39.25% CAGR between 2026-2031.
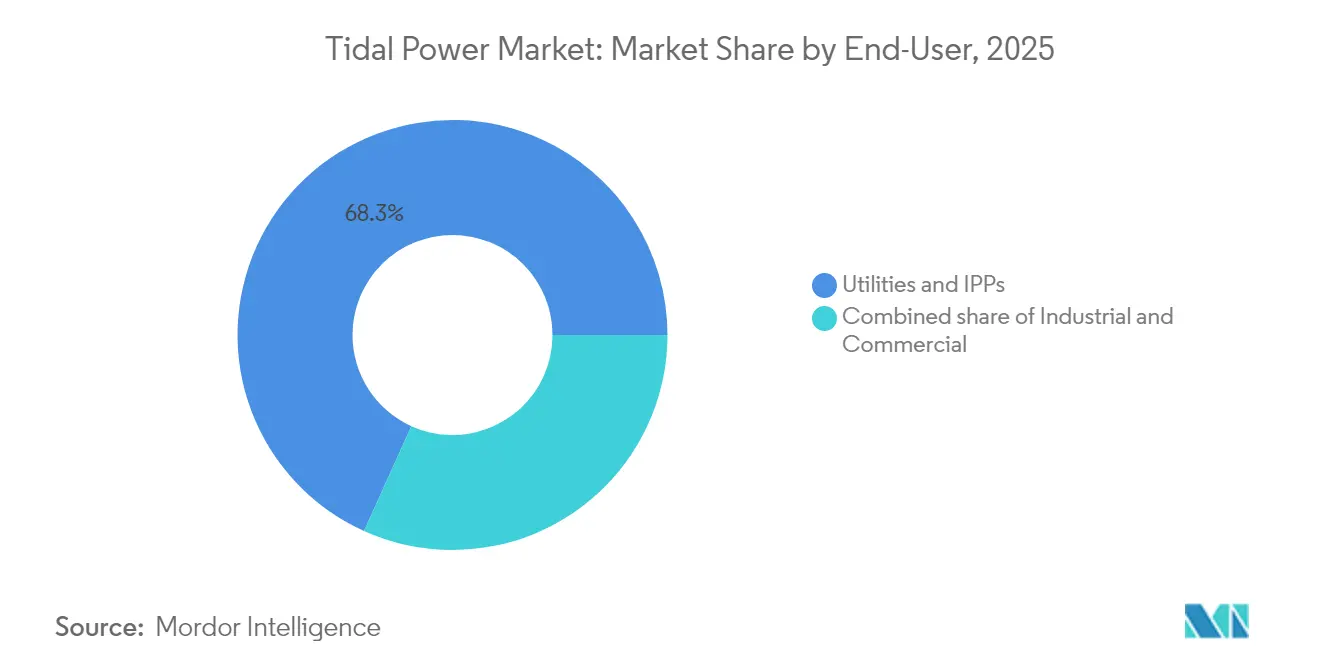
- By end-user, utilities and IPPs held 68.25% of demand in 2025; industrial buyers are expected to show the quickest upside with a 40.10% CAGR to 2031.
- By geography, Asia-Pacific held 50.35% of capacity in 2025, whereas North America is on course for the steepest rise, advancing at a 49.80% CAGR.
Note: Market size and forecast figures in this report are generated using Mordor Intelligence’s proprietary estimation framework, updated with the latest available data and insights as of 2026.
Global Tidal Power Market Trends and Insights
Drivers Impact Analysis*
| Driver | (~) % Impact on CAGR Forecast | Geographic Relevance | Impact Timeline |
|---|---|---|---|
| Global decarbonization and net-zero targets | +9.1% | Global, early gains in Asia-Pacific and North America | Medium term (2-4 years) |
| Predictable generation from high-range sites | +7.2% | North America and Asia-Pacific, spill-over to Europe | Long term (≥4 years) |
| Government subsidies and feed-in tariffs | +6.8% | Asia-Pacific, North America, emerging Europe | Short term (≤2 years) |
| Advances in turbine and floating-platform tech | +5.4% | Global | Medium term (2-4 years) |
| Co-location with coastal hydrogen hubs | +3.9% | Asia-Pacific, North America, emerging Europe | Long term (≥4 years) |
| Coastal-protection and climate-resilience use | +2.8% | Global, concentration in vulnerable coasts | Medium term (2-4 years) |
| Source: Mordor Intelligence | |||
Global Decarbonization and Net-Zero Targets
Governments and corporations are chasing more predictable clean-power sources to backfill intermittent wind and solar. China’s flagship array in the Zhoushan archipelago signals national intent, while U.S. planners see Cook Inlet covering up to 20% of regional demand by 2035. G-20 data show roughly 10% of renewable-finance packages are now directed to ocean-energy technology.[2]International Institute for Sustainable Development, “G-20 Public Finance for Ocean Energy,” iisd.org Consistently high capacity factors strengthen the tidal power market value proposition for coastal factories that cannot afford production lapses.
Predictable Generation from High-Tidal-Range Sites
Because tidal cycles can be forecast centuries ahead, operators avoid the forecasting errors that plague wind and solar. Cook Inlet’s theoretical 80 TWh resource illustrates the scale; China’s eight-gigawatt coastal potential offers similar promise. Such precision slashes reserve-margin requirements, easing grid integration costs and supporting power-plus-desalination projects.[3]U.S. Department of Energy, "Tidal Energy Could Help Decarbonize Alaska's Biggest Grid by 2035," energy.gov
Government Subsidies and Feed-in Tariffs
Asia-Pacific governments now dominate incentive roll-outs: China has deployed more than USD 2.7 billion in ocean-energy support since 2020, and Japan is evaluating a tidal FIT of roughly USD 0.19/kWh. In Europe, the U.K. awarded 41 MW of tidal capacity under its latest Contracts for Difference auction, while Wales topped up project grants with GBP 2 million in 2025. Guaranteed revenues compress financing spreads and attract institutional lenders to the tidal power market.
Advancements in Turbine and Floating-Platform Technology
Sustainable Marine Energy’s PLAT-I 6.40 prototype delivers 50% more output than its predecessor while meeting strict environmental limits. Orbital Marine Power’s 2 MW O2 machine uses four 10 m composite blades supplied by AC Marine & Composites, proving that offshore-wind supply chains can pivot to tidal needs. Minesto’s Dragon 12 kite attained stable 1.2 MW operation in 2025, widening the workable resource base for the tidal power market.
Restraints Impact Analysis*
| Restraint | (~) % Impact on CAGR Forecast | Geographic Relevance | Impact Timeline |
|---|---|---|---|
| High CAPEX versus other renewables | -5.2% | Global | Short term (≤ 2 years) |
| Marine-ecosystem impact concerns | -3.1% | Asia-Pacific, North America, emerging in Europe | Medium term (2-4 years) |
| Supply-chain bottlenecks for composite blades | -2.9% | Global, with concentration in manufacturing regions | Short term (≤ 2 years) |
| Limited grid capacity in remote coastlines | -2.4% | Remote coastal regions globally | Medium term (2-4 years) |
| Source: Mordor Intelligence | |||
High CAPEX versus Other Renewables
Capital requirements range between USD 6,244/kW and USD 18,700/kW, compared to sub-USD 1,000/kW for utility solar, which restricts financing options despite superior capacity factors. Limited fleets of heavy-lift vessels inflate mobilization expenses, while composite-blade fabrication still depends on bespoke facilities, elongating lead times. Current levelized energy costs sit at USD 0.12-0.40/kWh—well above prevailing market rates. Nonetheless, learning-curve projections show potential cost declines of 29% through modular designs and standardized installation sequences endorsed by the European Commission.
Marine-Ecosystem Impact Concerns
Comprehensive assessments prolong permitting cycles, yet field evidence continues to ease apprehensions. Pacific Northwest National Laboratory’s 2024 review of 40 tidal facilities catalogued minimal wildlife disruption, though it underscored the need for multi-turbine studies to capture array-scale effects.[4]Pacific Northwest National Laboratory, “Environmental Effects of Marine Energy 2024,” pnnl.gov Morlais developers deployed acoustic and visual monitoring buoys to gather marine mammal data throughout the 240 MW build-out. Regulators increasingly favor risk-tiered frameworks that discontinue redundant studies once operational evidence demonstrates limited hazard, which should streamline approvals and underpin medium-term expansion of the tidal power market.
*Our forecasts treat driver/restraint impacts as directional, not additive. The impact forecasts reflect baseline growth, mix effects, and variable interactions.
Segment Analysis
By Power Generation Method: Barrage strength; platform acceleration
Tidal-barrage plants held 44.12% of capacity in 2025 thanks to proven dams like La Rance and South Korea’s 254 MW Sihwa Lake, which together produce 550 GWh a year. Floating platforms, free of depth limits, are on track for a 35.30% CAGR to 2031. Stream devices such as Scotland’s MeyGen array add new megawatts yearly, while dynamic-tidal concepts remain in R&D. Convergence is likely: modular floats equipped with sluice-gate technology could merge barrage efficiency with deep-water flexibility, enriching the tidal power market size even where shorelines lack estuaries.
In parallel, platform OEMs are switching to barge-mounted pre-assembly to cut offshore time by 40%. Such tweaks trim vessel rental costs-one of the steepest expense lines-and should keep the tidal power market competitive as capital costs slide.
By Tidal Energy Converters: Horizontal-axis supremacy with niche challengers
Horizontal-axis turbines controlled 62.05% of installations in 2025, largely because they borrow gearboxes, bearings, and SCADA logic from the wind sector. Upgrades now push rotor diameters past 20 m while shaving nacelle weight. Vertical-axis units serve bi-directional channels, minimizing yaw complexity, and underwater kites harvest slower currents to unlock low-head sites. As serial production ramps up, cross-item standardization-cables, connectors, control software-should shrink procurement lead times, helping the tidal power market broaden its converter mix without escalating costs.


By Application: Power generation rules; desalination sprints
Power-only contracts still accounted for 77.65% of 2025 capacity, a reflection of well-trodden tariff structures. Yet tidal-powered desalination plants are scaling fast at 39.25% CAGR. Canary Island utilities already co-locate reverse-osmosis units with pilot turbines, cutting delivered-water costs by 25%. Port operators test mini-arrays to charge harbor ferries at night, while offshore data buoys rely on micro-turbines to feed sensors and communications kits. The diversified use-case portfolio cushions revenue risk and magnifies the total addressable tidal power market.
By End-User: Utility dominance; industrial rise
Utilities and IPPs purchased 68.25% of tidal output in 2025. Nevertheless, industrial buyers-steel, chemicals, fertilizer, even green ammonia-show the strongest appetite, with a 40.10% CAGR ahead. Direct onsite supply avoids grid congestion and delivers high-availability power that factories crave. Resort operators and port authorities round out the commercial slice, adopting smaller turbines to trim diesel bills.
Geography Analysis
Asia-Pacific held 50.35% of capacity in 2025, led by China’s industrial drive and Southeast Asia’s first grid-connected plant in South Korea. Japanese and Indonesian programs next focus on upscaling pilot devices, while Australia partners with Minesto to electrify isolated mining hubs.
North America is projected to be the growth champion at 49.80% CAGR. Alaska’s Cook Inlet resource could feed 80 TWh a year, and tax-credit parity with offshore wind is drawing project financiers back to the region. Nova Scotia’s revised leasing act speeds permitting in the Bay of Fundy, and West Coast grids study subsea cables for future Pacific builds.
Europe remains the policy trend-setter. The U.K.’s latest CfD round reserved a tidal budget, and the 240 MW Morlais zone entered early works in 2025. France’s decades-old La Rance barrage still runs at more than 40% capacity factor, anchoring O&M best-practice data. Nordic yards now retrofit anchor-handling tugs into installation craft, adding local content jobs to the tidal power market narrative.

Competitive Landscape
Five front-runners—SIMEC Atlantis Energy, Orbital Marine Power, Minesto, Nova Innovation, and HydroWing—together control an estimated 65% of installed megawatts, giving the tidal power market a concentration score of 6. SIMEC Atlantis is raising debt for an 80 MW MeyGen expansion, armed with EUR 1 million of upgrade grants. Orbital Marine signed a preferred-supplier deal with Global Energy Group that trims assembly cycles to ten months. Minesto exported its first power from its Dragon 12 kite in early 2024, then secured a Queensland seabed option.
Second-tier firms are differentiating through logistics. HydroWing unveiled a purpose-built installation barge that cuts offshore person-hours by 25%. Nova Innovation leads a Horizon-Europe consortium to deploy 16 turbines in Orkney, bundling storage and grid services.[5]Ocean Energy Europe, "SEASTAR project to deploy largest number of turbines in Scottish tidal farm with Horizon Europe and UKRI support," oceanenergy-europe.eu Such specialization pushes down balance-of-plant costs, vital for the tidal power market as it competes for capital against mature renewables.
Tidal Power Industry Leaders
-
Andritz AG
-
Orbital Marine Power Ltd
-
Sustainable Marine Energy Ltd
-
Nova Innovation Ltd
-
SIMEC Atlantis Energy Ltd
- *Disclaimer: Major Players sorted in no particular order


Recent Industry Developments
- June 2025: Minesto Dragon 12 tidal power plants achieve production performance milestone, validating utility-scale economics and grid compliance.
- May 2025: The Welsh Government has completed a EUR 2 million equity investment in tidal energy firm Inyanga Marine Energy Group, reinforcing Wales' commitment to developing renewable energy.
- May 2025: Inyanga Marine Energy Group has awarded a contract to Hutchinson Engineering for the fabrication of components for their HydroWing tidal energy device at the Morlais site in Wales.
- March 2025: The SHINES (Showcasing Hydrokinetic Energy Innovations for Northwest European Energy Sovereignty) project has been launched to coordinate tidal and river-energy research and development across Northwestern Europe.


Global Tidal Power Market Report Scope
Tidal energy is renewable energy powered by ocean tides and currents' natural rise and fall.
The tidal power market is segmented by power generation method, tidal energy converters, and geography. By power generation method, the market is segmented into tidal barrage, floating tidal power platform, tidal stream generation, and dynamic tidal power. By tidal energy converters, the market is segmented into horizontal axis turbines, vertical axis turbines, and other tidal energy converters. The report also covers the market size and forecasts for the tidal power market across major regions. For each segment, the market size and forecasts have been done based on installed capacity.
By Power Generation Method
| Tidal Barrage |
| Floating Tidal Power Platform |
| Tidal Stream Generation |
| Dynamic Tidal Power |
By Tidal Energy Converters
| Horizontal Axis Turbine |
| Vertical Axis Turbine |
| Other Tidal Energy Converters |
By Application
| Power Generation |
| Desalination |
| Marine Propulsion |
| Data and Telecom Platforms |
By End-User
| Utilities and IPPs |
| Industrial |
| Commercial |
By Geography
| North America | United States |
| Canada | |
| Mexico | |
| Europe | United Kingdom |
| France | |
| Spain | |
| Netherlands | |
| Denmark | |
| Russia | |
| Rest of Europe | |
| Asia Pacific | China |
| India | |
| Japan | |
| South Korea | |
| ASEAN Countries | |
| Australia and New Zealand | |
| Rest of Asia Pacific | |
| South America | Brazil |
| Argentina | |
| Colombia | |
| Rest of South America | |
| Middle East and Africa | Saudi Arabia |
| United Arab Emirates | |
| South Africa | |
| Egypt | |
| Rest of Middle East and Africa |
| By Power Generation Method | Tidal Barrage | |
| Floating Tidal Power Platform | ||
| Tidal Stream Generation | ||
| Dynamic Tidal Power | ||
| By Tidal Energy Converters | Horizontal Axis Turbine | |
| Vertical Axis Turbine | ||
| Other Tidal Energy Converters | ||
| By Application | Power Generation | |
| Desalination | ||
| Marine Propulsion | ||
| Data and Telecom Platforms | ||
| By End-User | Utilities and IPPs | |
| Industrial | ||
| Commercial | ||
| By Geography | North America | United States |
| Canada | ||
| Mexico | ||
| Europe | United Kingdom | |
| France | ||
| Spain | ||
| Netherlands | ||
| Denmark | ||
| Russia | ||
| Rest of Europe | ||
| Asia Pacific | China | |
| India | ||
| Japan | ||
| South Korea | ||
| ASEAN Countries | ||
| Australia and New Zealand | ||
| Rest of Asia Pacific | ||
| South America | Brazil | |
| Argentina | ||
| Colombia | ||
| Rest of South America | ||
| Middle East and Africa | Saudi Arabia | |
| United Arab Emirates | ||
| South Africa | ||
| Egypt | ||
| Rest of Middle East and Africa | ||


Key Questions Answered in the Report
How large is the tidal power market today?
Installed capacity hit 683.91 MW in 2026 and is on track for 2,966.99 MW by 2031.
What CAGR is forecast for global tidal capacity?
The tidal power market is projected to grow at a 34.10% CAGR from 2026-2031.
Which region is expanding fastest?
North America leads with a 49.80% CAGR thanks to Alaska’s Cook Inlet and Canadian projects.
Why is tidal energy valued by grid operators?
Lunar-driven cycles allow output to be forecast years in advance, easing balancing costs.
What is the biggest obstacle to tidal roll-out?
High upfront capital costs-USD 6,000-18,700 per kW-compared with other renewables.
Can tidal plants support other uses besides power?
Yes; co-located desalination, hydrogen production, and coastal-defense functions are gaining traction.
Page last updated on:


