Energy & Power
30th JulyUnlocking Market Potential for Solid-State Transformers
3 Min Read
The United States Power Market Report is Segmented by Power Source (Thermal, Nuclear, and Renewables) and End-User (Utilities, Commercial and Industrial, and Residential). The Market Sizes and Forecasts are Provided in Terms of Installed Capacity (GW).
Market Overview
| Study Period | 2021 - 2031 |
|---|---|
| Base Year For Estimation | 2025 |
| Forecast Data Period | 2026 - 2031 |
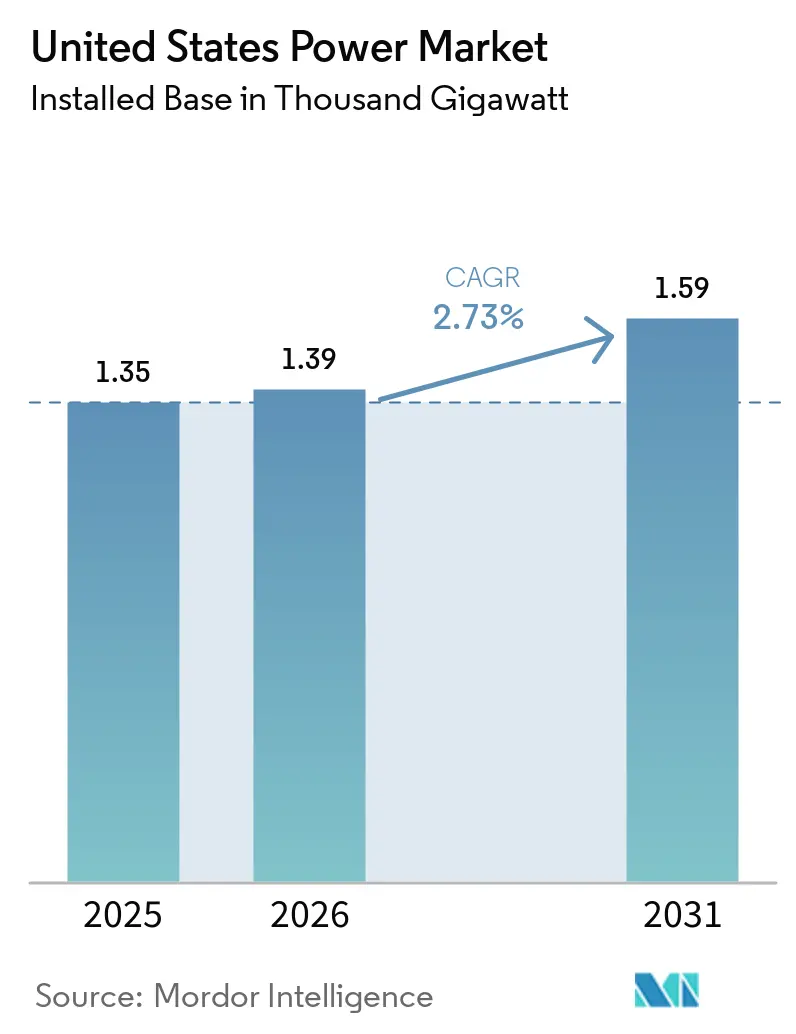
| Market Volume (2026) | 1.39 Thousand gigawatt |
| Market Volume (2031) | 1.59 Thousand gigawatt |
| CAGR | 2.73 % |
| Market Concentration | Low |
Major Players *Disclaimer: Major Players sorted in no particular order. Image © Mordor Intelligence. Reuse requires attribution under CC BY 4.0. |
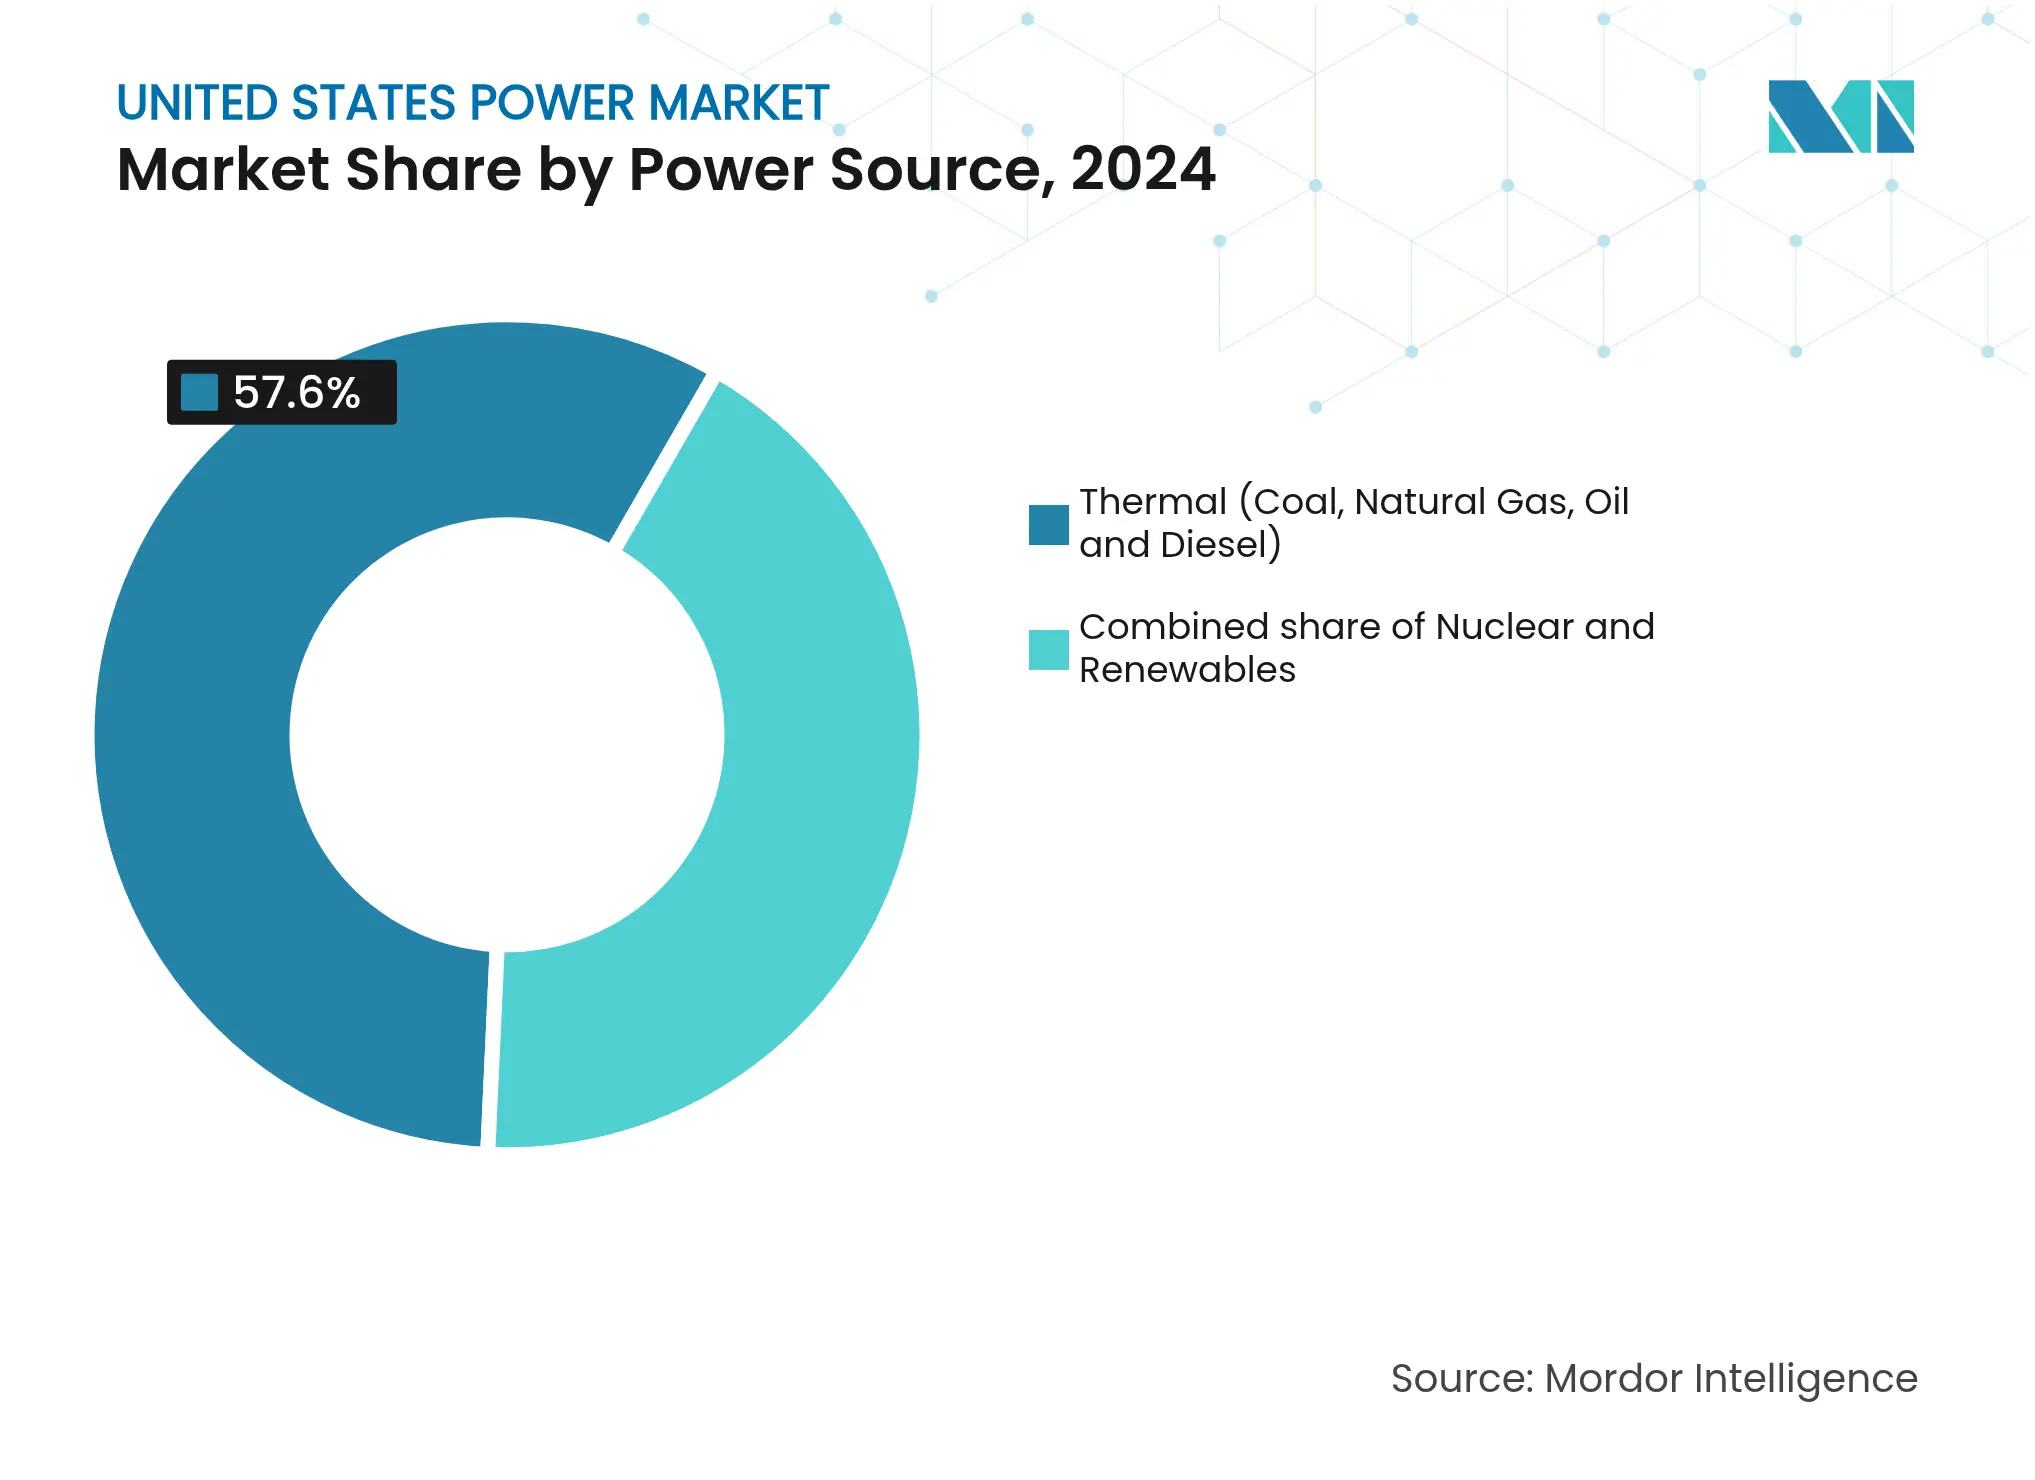
Thermal generation supplied 57.6% of capacity in 2024, yet the combination of Inflation Reduction Act (IRA) tax incentives and falling renewable costs is propelling utility-scale solar and wind through 2030. Coal retirements totaling 20 GW by 2030, tight transformer supply, and protracted transmission approvals are widening the reliability gap but simultaneously accelerating storage and demand-response deployments. Electric-vehicle load growth, heat-pump adoption, and hyperscale data-center procurement underpin a structural demand rebound after decades of flat consumption. Independent power producers (IPPs) are leveraging merchant price signals, while vertically integrated utilities channel record capital toward grid hardening to offset rising climate-related insurance premiums.[1]U.S. Energy Information Administration, “Electric Power Monthly,” eia.gov
Key Report Takeaways
Note: Market size and forecast figures in this report are generated using Mordor Intelligence's proprietary estimation framework, updated with the latest available data and insights as of January 2026.
Drivers Impact Analysis
| Driver | (~) % Impact on CAGR Forecast | Geographic Relevance | Impact Timeline | |||
|---|---|---|---|---|---|---|
IRA-driven renewable build-out IRA-driven renewable build-out | +1.8% | Texas, California, Midwest wind corridor | Long term (≥ 4 years) | (~) % Impact on CAGR Forecast:+1.8% | Geographic Relevance:Texas, California, Midwest wind corridor | Impact Timeline:Long term (≥ 4 years) |
Coal retirements create capacity gap Coal retirements create capacity gap | +0.6% | Ohio Valley, Appalachia, Upper Midwest | Medium term (2-4 years) | |||
Electrification-led demand growth Electrification-led demand growth | +0.9% | Pacific Coast, Northeast metro areas | Long term (≥ 4 years) | |||
Grid modernization & resiliency funding Grid modernization & resiliency funding | +0.4% | Gulf Coast, wildfire zones, aging Northeast infrastructure | Medium term (2-4 years) | |||
Hyperscale-data-center PPAs Hyperscale-data-center PPAs | +0.7% | Virginia, Texas, Arizona, Oregon, Iowa | Short term (≤ 2 years) | |||
Green-hydrogen electrolyzer demand Green-hydrogen electrolyzer demand | +0.2% | Gulf Coast, California ports, Midwest industrial clusters | Long term (≥ 4 years) | |||
| Source: Mordor Intelligence | ||||||
IRA-driven renewable build-out
The IRA’s decade-long extension of production and investment tax credits, plus a 20-percentage-point domestic-content bonus, has shifted capital decisively toward wind and solar projects. Announcements totaling 550 GW of renewable capacity for delivery by 2030 already exceed pre-IRA forecasts twofold.[2]U.S. Department of Energy, “Electricity Capacity Projections,” energy.gov Contracted offtake now covers more than 80% of projects announced in 2024 as financiers demand revenue certainty. U.S. module producer First Solar is expanding its Ohio manufacturing to 14 GW of annual output by 2026, ensuring a compliant supply. However, a looming 2029–2030 credit step-down is expected to compress construction schedules and bid up equipment costs.
Coal Retirements Create Capacity Gap
Roughly 20 GW of coal capacity scheduled to exit by 2030 is concentrated in PJM, MISO, and SPP. With capacity auctions clearing at record prices, utilities are pairing solar, wind, and 4-hour batteries rather than building new gas turbines. Duke Energy alone budgeted USD 400 million in 2024 for environmental retrofits to keep marginal coal units online until replacement resources interconnect. Interconnection backlogs averaging five years intensify the gap, forcing grid operators to activate emergency demand-response programs. These dynamics elevate both reliability risk and merchant-generator opportunity.
Electrification-led demand growth
The U.S. Energy Information Administration now expects electricity consumption to rise 0.9% annually through 2030 after decades of stagnation. Electric-vehicle sales surpassed 4 million cumulative units in 2024, and managed charging is tempering incremental capacity needs to roughly 1 kW per car. Heat-pump installations hit 4.3 million units in 2024, shifting winter peaks upward in northern states. Residential dual-fuel systems and thermal storage are gaining favor to reduce peak strain. The load-shape shift is steering new investment toward flexible gas, storage, and demand-side management.
Grid Modernization & Resiliency Funding
The Infrastructure Investment and Jobs Act earmarked USD 65 billion for grid upgrades, including USD 10.5 billion for the Grid Resilience and Innovation Partnerships (GRIP) program. Awards in 2024 prioritized undergrounding distribution lines, advanced metering, and storm hardening. Southern Company secured USD 200 million to install covered conductors across 1,000 miles of network, reducing ignition risk by 90%. Compliance with NERC’s CIP-013 standard is adding up to 8% to project costs as utilities vet suppliers. Rural cooperatives, lacking matching capital, lag behind investor-owned utilities in tapping these funds.
Restraints Impact Analysis
| Restraint | (~) % Impact on CAGR Forecast | Geographic Relevance | Impact Timeline | |||
|---|---|---|---|---|---|---|
Solar/transformer supply bottlenecks Solar/transformer supply bottlenecks | -0.5% | Texas, California, Florida | Short term (≤ 2 years) | (~) % Impact on CAGR Forecast:-0.5% | Geographic Relevance:Texas, California, Florida | Impact Timeline:Short term (≤ 2 years) |
Transmission siting & permitting delays Transmission siting & permitting delays | -0.8% | Interstate projects crossing multiple jurisdictions | Long term (≥ 4 years) | |||
Curtailment risk in high-renewable zones Curtailment risk in high-renewable zones | -0.3% | CAISO, ERCOT, SPP | Medium term (2-4 years) | |||
Extreme-weather insurance cost surge Extreme-weather insurance cost surge | -0.2% | Gulf Coast, California wildfire zones, Atlantic hurricane corridor | Short term (≤ 2 years) | |||
| Source: Mordor Intelligence | ||||||
Solar or transformer supply bottlenecks
High-voltage transformer lead times lengthened to 30 months in 2024 versus 12 months pre-pandemic, delaying interconnections and network upgrades. Domestic production capacity of roughly 200 units annually meets only half of the current demand. ABB and Hitachi Energy announced U.S. factory expansions, but full output is unlikely before 2027. Section 201 solar tariffs and forced-labor import bans inflated compliant-module prices by up to 20%, compressing developer returns. Utilities now sign multi-year supply agreements with escalators, shifting inflation risk to customers.
Transmission Siting & Permitting Delays
End-to-end development for interstate lines averages 10 years, well beyond generator planning horizons. FERC Order 1920 mandates 20-year regional planning and beneficiary-pays cost allocation, but 14 states have filed legal challenges alleging federal overreach.[3]Federal Energy Regulatory Commission, “Order 1920 Fact Sheet,” ferc.gov The 800-mile Grain Belt Express spent 12 years securing state approvals, adding more than USD 500 million to costs. Developers increasingly opt for federally managed offshore corridors where the Bureau of Ocean Energy Management reviews cut timelines to four years.
By Power Source: Renewables Accelerate as Thermal Dominance Erodes
Renewables captured 42.4% of installed capacity in 2024 and are advancing at a 7.8% CAGR, steadily eroding thermal’s majority position in the United States power market. Utility-scale solar additions of 32 GW in 2024 outpaced every other technology for the third straight year, while the 800 MW Vineyard Wind 1 project heralded commercial offshore wind entry. Coal retirements removed 8 GW in 2024, pushing average fleet capacity factors below 40% and increasing reliance on flexible gas assets for ramping. Nuclear capacity remains steady near 95 GW; the planned 835 MW restart of Three Mile Island in 2028 marks the first reactor return from retirement and underscores nuclear’s role in firm zero-carbon supply. Emerging geothermal projects such as Fervo’s 400 MW Project Red illustrate growing investor appetite for dispatchable renewables.[4]Fervo Energy, “Project Red Geothermal PPA,” fervoenergy.com
Investment momentum favors technologies with clear IRA incentives, positioning solar-plus-storage and wind as the default replacements for retiring fossil units within the United States power market. Developers nonetheless face interconnection delays, transformer shortages, and tariff exposure that add price volatility. Natural-gas combined-cycle builds are slowing as potential methane fees loom, yet existing gas fleets continue to capture scarcity rents during evening peaks. Small modular reactors earned Nuclear Regulatory Commission design approval in 2024, but commercial operation remains a post-2030 prospect. Biomass and tidal remain niche as environmental compliance costs outweigh revenue streams.
Note: Segment shares of all individual segments available upon report purchase
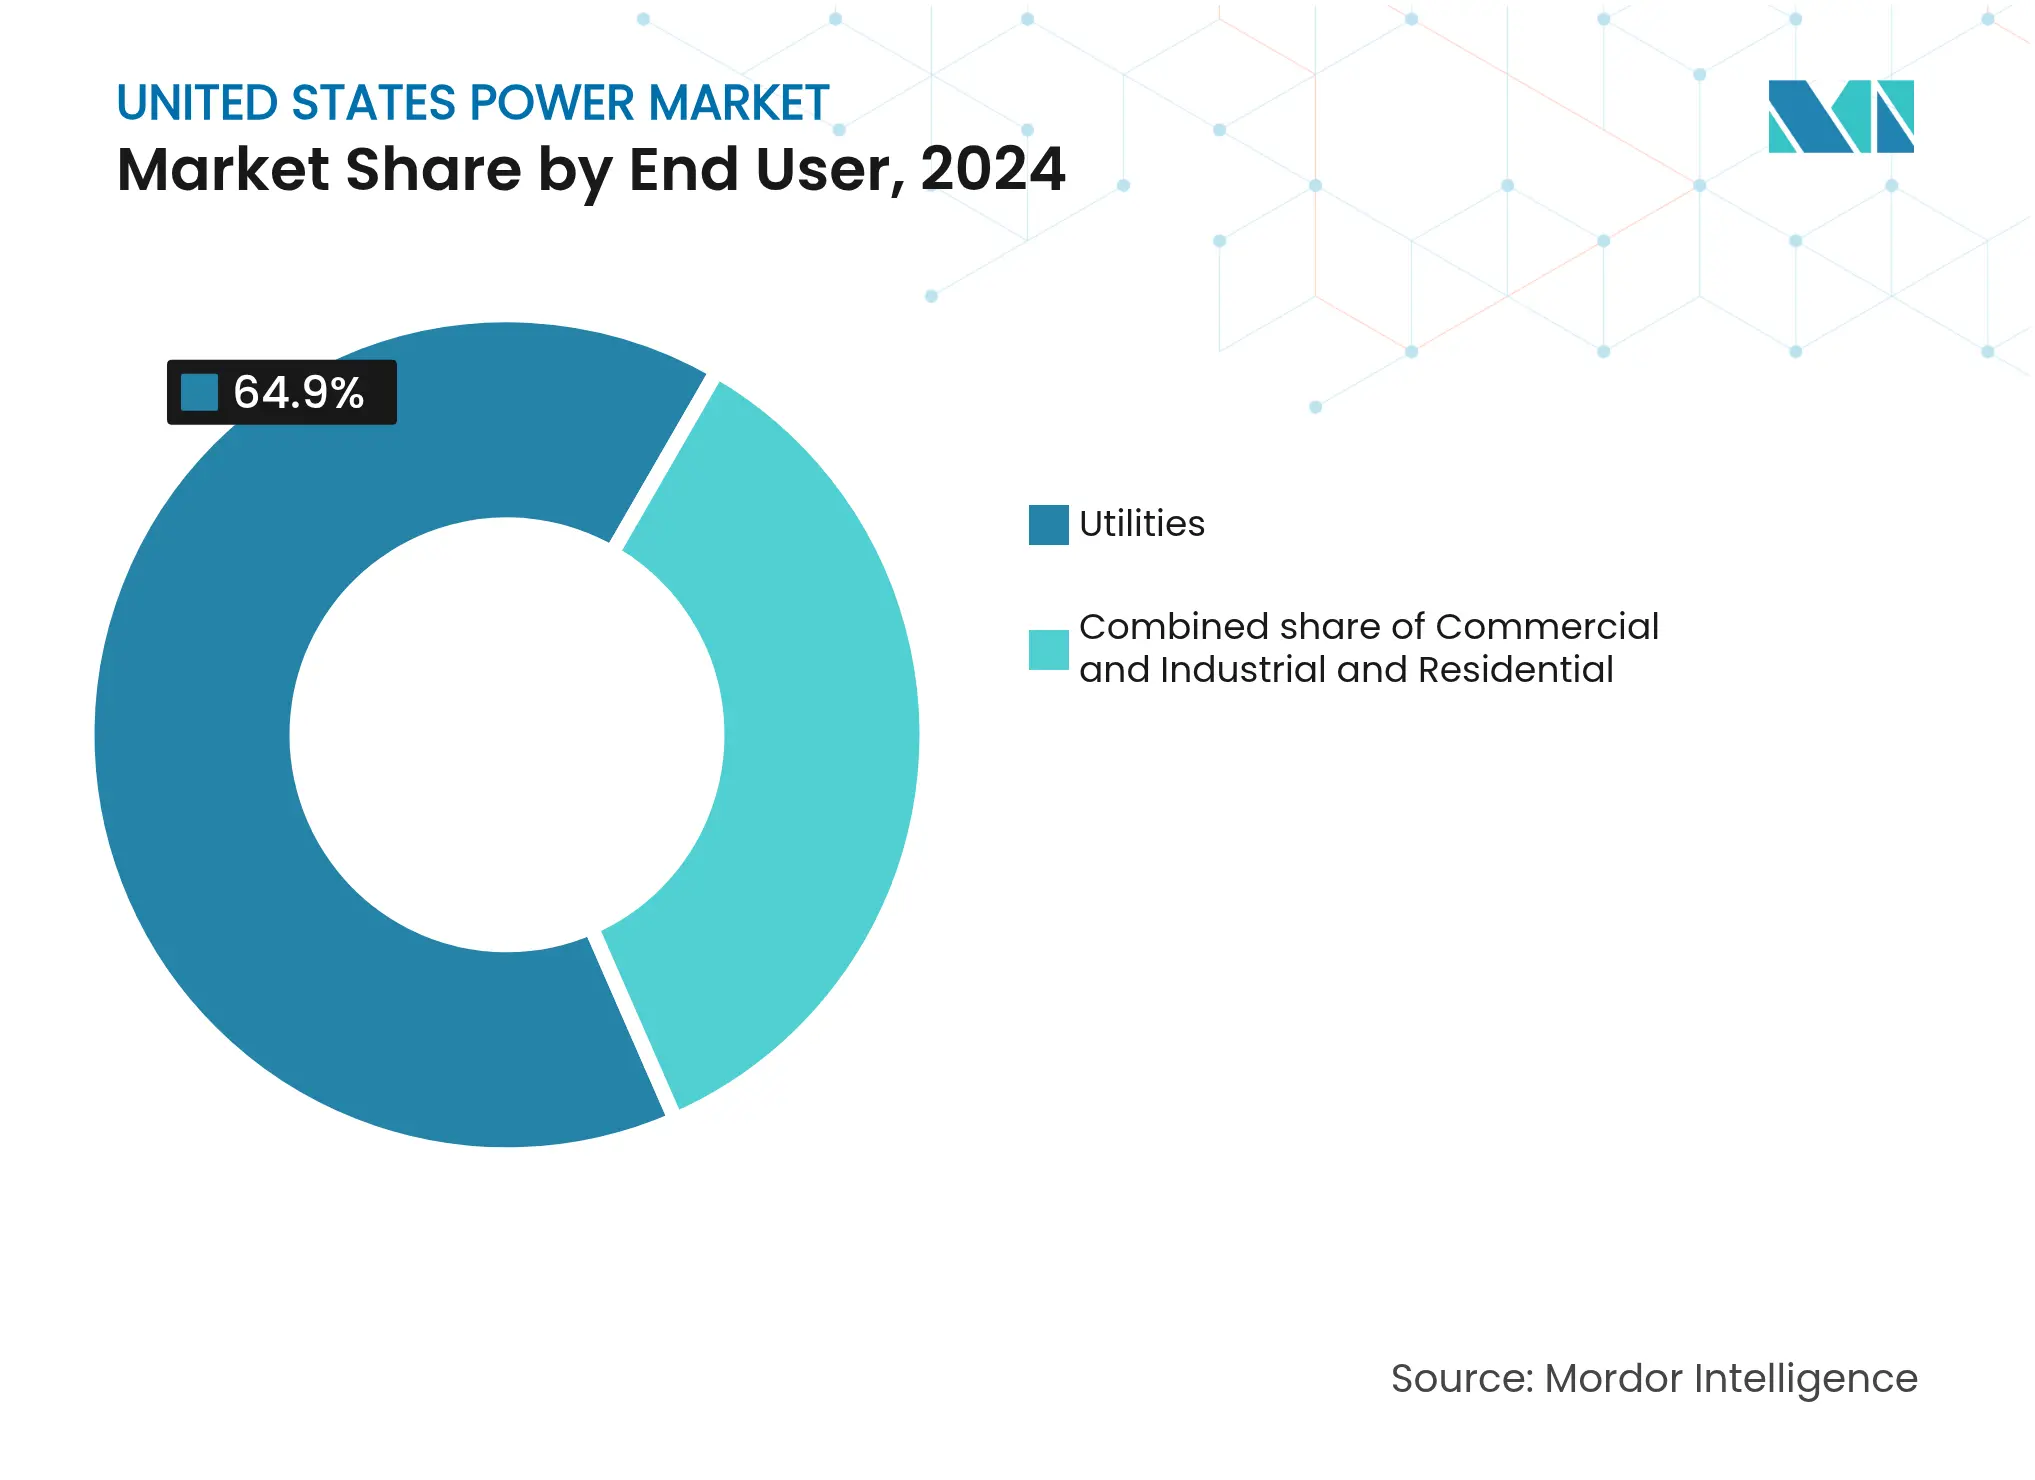
By End User: Residential Surge Challenges Utility Dominance
Utilities owned 64.9% of capacity in 2024, cementing their central role in the United States power market. Capital is flowing toward grid-hardening rather than new generation, reflecting regulatory incentives and climate-resilience mandates. The commercial and industrial segment, especially data centers, increasingly bypasses traditional procurement via direct PPAs and behind-the-meter builds, siphoning high-margin load from utilities. Amazon’s 960 MW data-center campus co-located with a Pennsylvania nuclear plant exemplifies cost-avoidance strategies by large buyers.
Residential capacity is the fastest-growing slice of the United States power market, slated for a 10.4% CAGR to 2030 on rooftop-solar and home-battery diffusion. Installed residential solar surpassed 30 GW in 2024, and battery attachment rates in California exceeded 85% after NEM 3.0 cut export credits. The 30% residential ITC lowers payback periods to roughly seven years even in moderate-price states. Virtual power plants aggregating household systems delivered 500 MW of dispatchable capacity in 2024, opening new revenue for prosumers and distribution utilities alike.
Note: Segment shares of all individual segments available upon report purchase
Texas added 12 GW of capacity in 2024, 85% solar and storage, leveraging ERCOT’s merchant market and fast interconnection, yet weather resilience remains a headline risk after Winter Storm Uri. California led residential solar with 4.5 GW of installs in 2024 despite reduced export rates, and its 100% clean-energy mandate is pushing procurement of long-duration storage and out-of-state wind.[5]California Energy Commission, “Quarterly Solar Statistics,” cec.ca.gov Offshore wind entered commercial scale on the Atlantic coast, while lease awards totaling 25 GW off California in 2024 set the stage for floating-platform deployment.
Wind-rich Midwest states enjoy low land costs; Iowa generated 62% of its electricity from wind in 2024 and continues to add storage to maximize IRA energy-community credits. The Southeast trails on renewables due to vertically integrated utility structures, though Florida commissioned 3 GW of solar in 2024, citing hurricane-hardening benefits. The Northeast’s land constraints channel investment offshore; New York and Massachusetts contracted 9 GW of capacity, with the first electricity delivery expected in 2025.
Regional transmission organizations are converging markets to smooth renewable variability. PJM’s 2024 seasonal-capacity auction raised prices tenfold, incentivizing firm capacity but elevating consumer costs. MISO’s USD 10.3 billion multi-value project portfolio, approved in 2024, will connect Dakota wind to the Midwestern load. The Western Energy Imbalance Market grew to cover 80% of Western load, trimming curtailment by 1.2 million MWh in 2024. Integration trends foster arbitrage for storage and flexible gas, while narrowing locational spreads compress renewable merchant margins.

Reports are available across multiple geographies.
Gain in-depth market insights across regions to support informed decisions.
Market Concentration
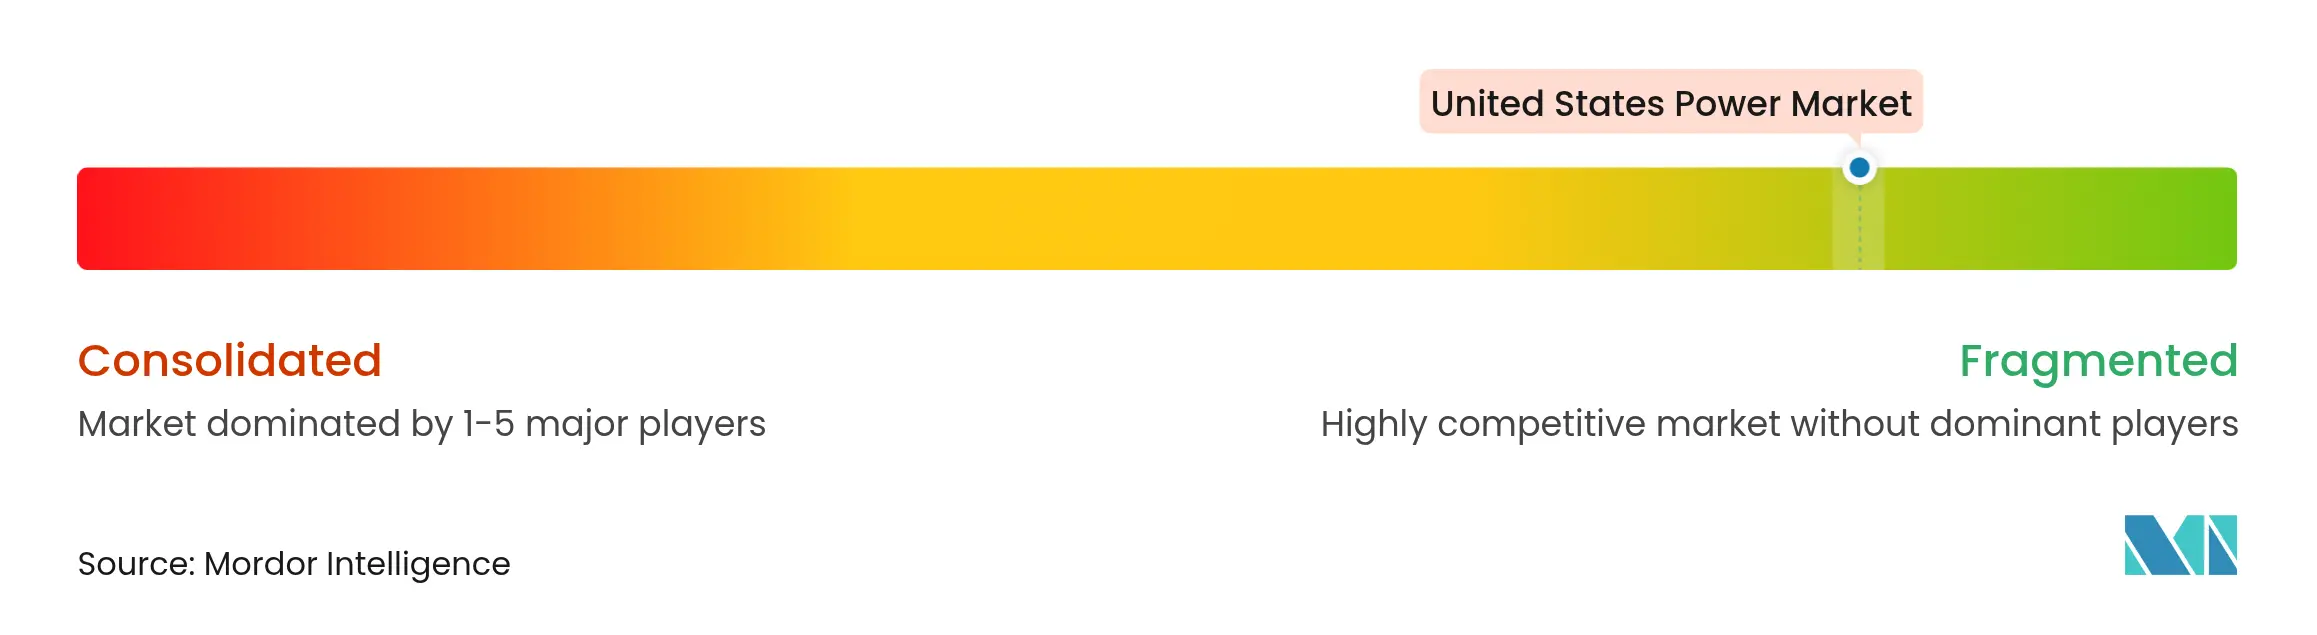
The United States power market is fragmented. Vertically integrated utilities in regulated states earn allowed returns on equity but face scrutiny over cost recovery for wildfire hardening and offshore wind ambitions. Deregulated regions reward fleet flexibility; Vistra’s ERCOT gas units captured USD 1.2 billion of gross margin during summer peaks despite low annual utilization.
Strategic differentiation pivots on asset mix, contracting model, and regulatory leverage. NextEra Energy’s 30 GW renewables portfolio enables bundled energy and capacity sales to both utilities and corporates, while its Florida Power & Light arm deploys 1.5 GW of solar annually to meet state load growth. Constellation monetizes its nuclear fleet through 24/7 zero-carbon contracts, attracting hyperscalers willing to pay 10%-15% premiums over conventional renewable credits. Pattern Energy illustrates a transmission-as-a-service model with its USD 10 billion SunZia HVDC and 3.5 GW wind combo, earning regulated returns while capturing development upside.
White space remains in mid-duration storage where lithium-ion economics weaken beyond four hours. Flow batteries, compressed-air storage, and geothermal reservoirs vie for scale but face financing hurdles without proven cost curves. Transmission developers offering standalone infrastructure investment also expand competitive boundaries as utilities prioritize core grid assets over generation ownership within the United States power market.

*Disclaimer: Major Players sorted in no particular order
1. Introduction
2. Research Methodology
3. Executive Summary
4. Market Landscape
5. Market Size & Growth Forecasts
6. Competitive Landscape
7. Market Opportunities & Future Outlook
A power market is a competitive trading environment for buying and selling electricity and related services, balancing supply and demand through wholesale (between generators/traders) and retail (to consumers) systems, managed by operators like ISOs/RTOs{/nav} to ensure grid stability, integrating complex dynamics like real-time needs, storage, and renewables, distinct from other commodities due to electricity's instant consumption requirement.
The United States Power Market report includes by Power Source (Thermal (Coal, Natural Gas, Oil and Diesel), Nuclear, Renewables (Solar, Wind, Hydro, Geothermal, Biomass & Waste, Tidal), by End User (Utilities, Commercial and Industrial, Residential), by T&D Voltage Level (Qualitative Analysis only) (High-Voltage Transmission (Above 230 kV), Sub-Transmission (69 to 161 kV), Medium-Voltage Distribution (13.2 to 34.5 kV), Low-Voltage Distribution (Up to 1 kV)).
Unlocking Market Potential for Solid-State Transformers
3 Min Read
When decisions matter, industry leaders turn to our analysts. Let’s talk.