Market Overview
| Study Period | 2021 - 2031 |
|---|---|
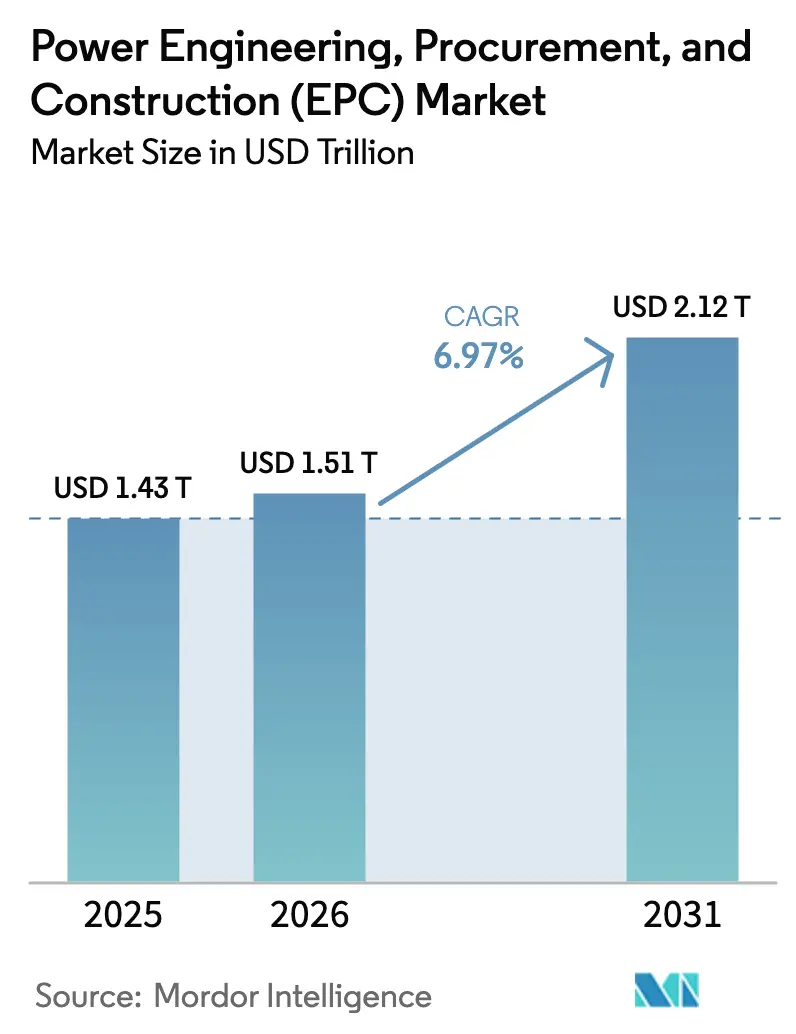
| Market Size (2026) | USD 1.51 Trillion |
| Market Size (2031) | USD 2.12 Trillion |
| Growth Rate (2026 - 2031) | 6.97% CAGR |
| Fastest Growing Market | Asia Pacific |
| Largest Market | Asia-Pacific |
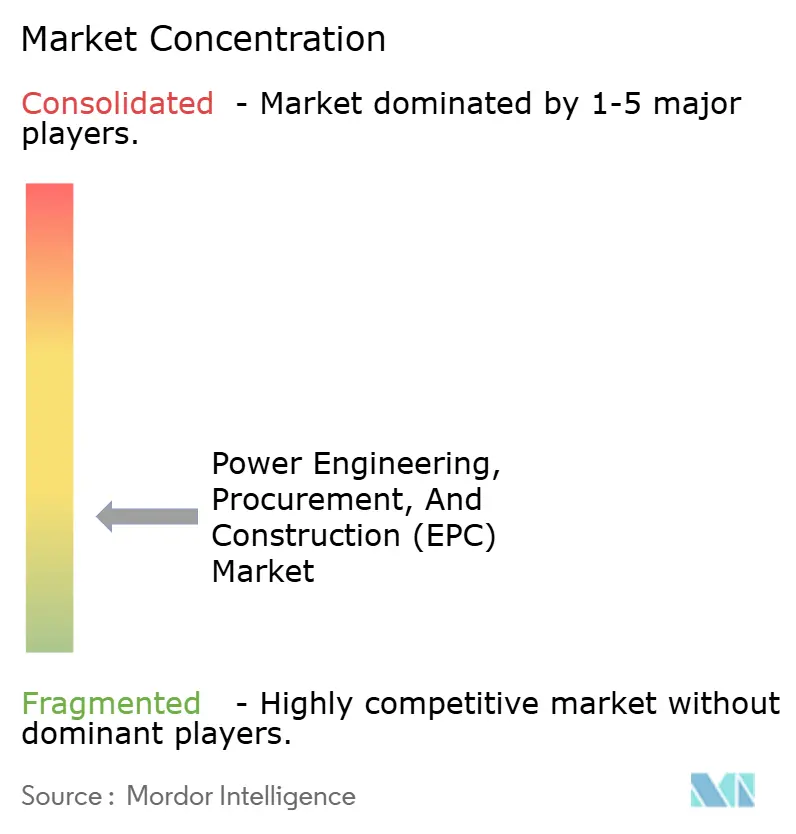
| Market Concentration | Low |
Major Players *Disclaimer: Major Players sorted in no particular order Image © Mordor Intelligence. Reuse requires attribution under CC BY 4.0. | |
Power Engineering, Procurement, And Construction (EPC) Market Analysis by Mordor Intelligence
The Power Engineering, Procurement, And Construction Market size is expected to grow from USD 1.43 trillion in 2025 to USD 1.51 trillion in 2026 and is forecast to reach USD 2.12 trillion by 2031 at 6.97% CAGR over 2026-2031.
Rising national net-zero mandates, accelerated renewable additions, and an upsurge in captive micro-grids for hyperscale data centers are widening the project pipeline while diversifying the risk profile across geographies.[1]United Nations Framework Convention on Climate Change, “Net Zero Tracker,” unfccc.int Asia-Pacific dominates current activity, but South America is registering the fastest growth as Brazil’s auctions and Chile’s hydrogen plans scale up grid-connected and behind-the-meter installations. Competitive dynamics remain fluid: Chinese and Indian conglomerates win volume on cost, yet HVDC specialists and offshore-wind integrators earn premium margins on complex scopes. Two structural brakes, high up-front capex and a shortage of HVDC/offshore personnel, continue to stretch commissioning timelines in North America and Europe.
Key Report Takeaways
- The global power EPC market is segmented into power generation EPC and power transmission and distribution (T&D) EPC. Power generation EPC accounted for 50.98% of the market in 2025, while power transmission and distribution (T&D) EPC is projected to grow at a 7.39% CAGR through 2031, outpacing generation EPC.
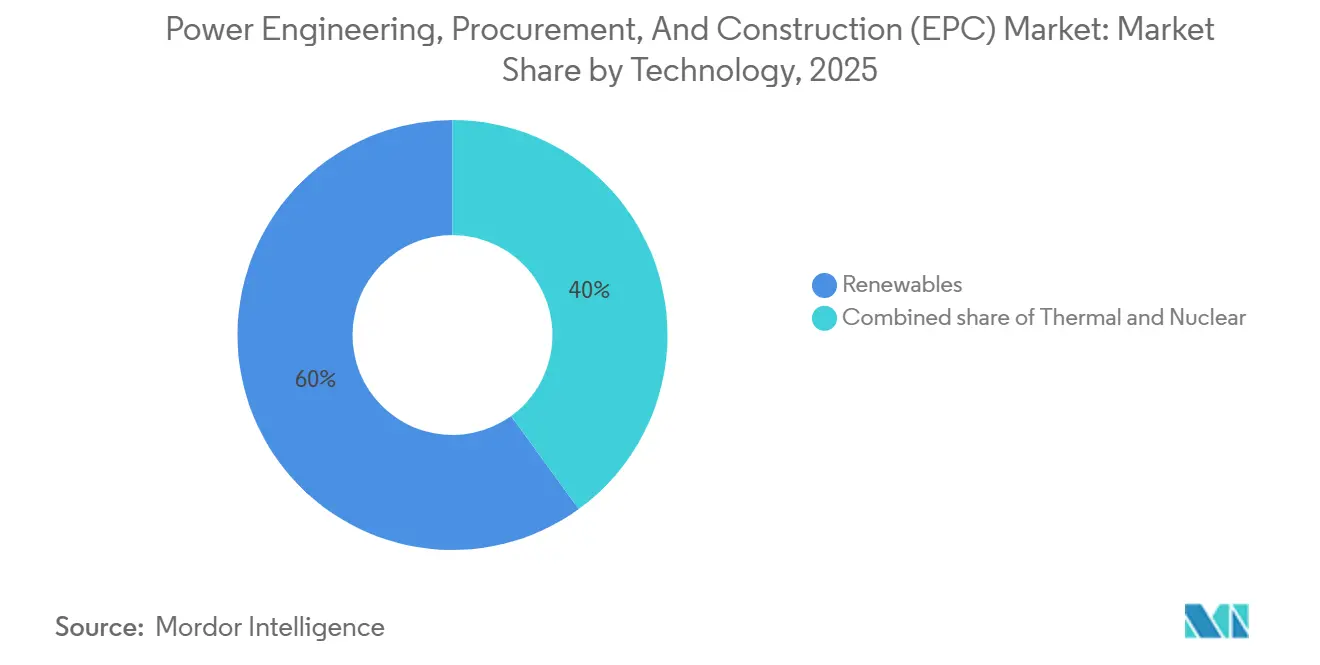
- By technology, renewables commanded 60% of the 2025 power generation EPC market and are advancing at a 7.8% CAGR through 2031.
- By capacity band, the above 500 MW range captured 51.5% of the global power generation EPC market size in 2025, while the up to 100 MW distributed-energy-resource segment is poised to grow at an 8.1% CAGR to 2031.
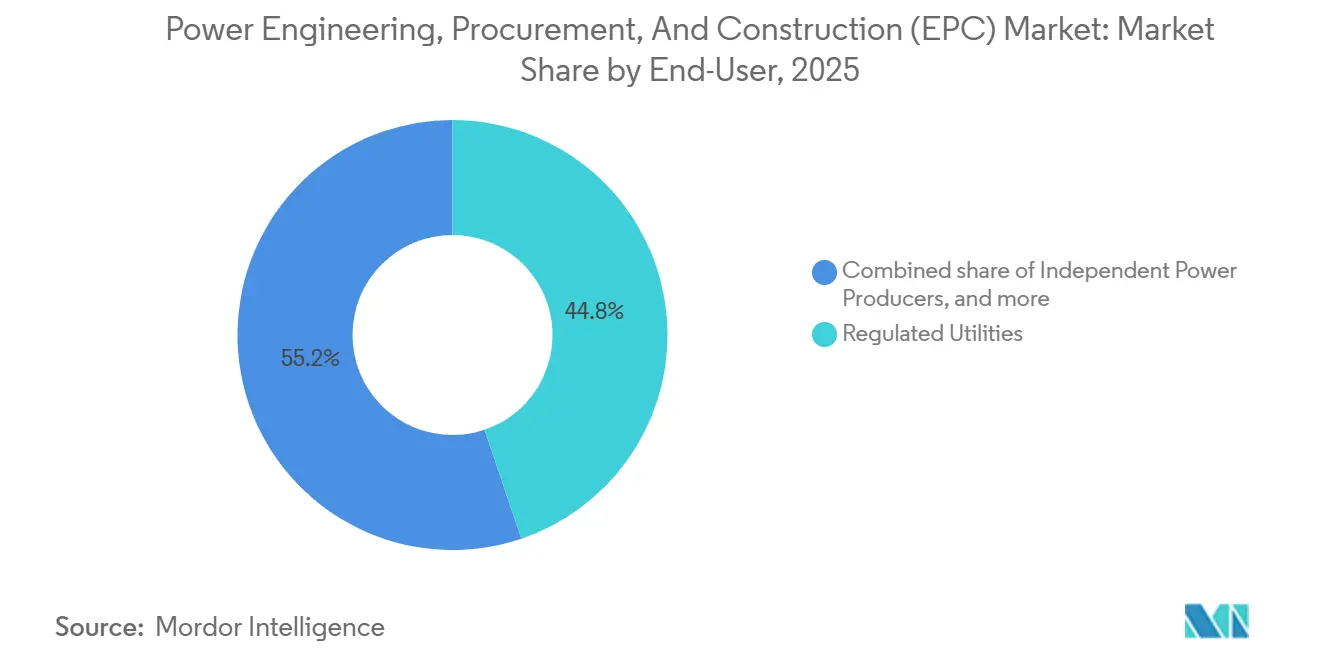
- By end user, regulated utilities held 44.8% of the 2025 power generation EPC market; independent power producers are growing fastest at 7.7% to 2031.
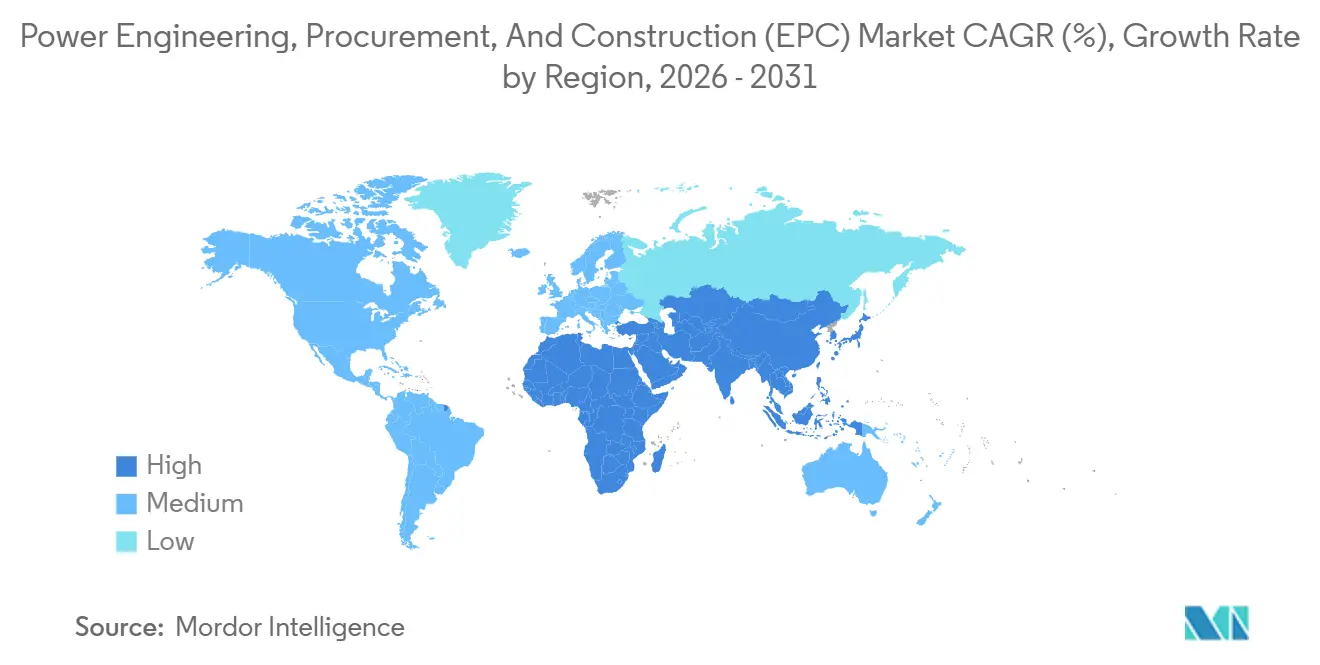
- By geography, Asia-Pacific led with a 59.4% share of the power generation EPC market in 2025, while South America is expected to expand at a 7.5% CAGR through 2031.
- The power transmission and distribution (T&D) EPC market is segmented by geography: Asia-Pacific accounted for the largest share of 48.1% in 2025, and is also projected to lead the market growth with a CAGR of 8.6% through 2031.
Note: Market size and forecast figures in this report are generated using Mordor Intelligence’s proprietary estimation framework, updated with the latest available data and insights as of January 2026.
Global Power Engineering, Procurement, And Construction (EPC) Market Trends and Insights
Drivers Impact Analysis*
| Driver | (~) % Impact on CAGR Forecast | Geographic Relevance | Impact Timeline |
|---|---|---|---|
| Growing power demand in emerging economies | +1.2% | APAC core, spill-over to Middle East and Africa | Medium term (2-4 years) |
| Accelerated renewable-energy build-out | +1.8% | Global, with concentration in APAC, Europe, North America | Short term (≤ 2 years) |
| Aging grid and generation asset replacements | +0.9% | North America, Europe, select APAC markets | Long term (≥ 4 years) |
| National net-zero mandates unlocking EPC pipelines | +1.5% | Global, led by EU, North America, China, India | Medium term (2-4 years) |
| Hyperscale data-center micro-grids | +0.7% | North America, Europe, APAC hubs (Singapore, Tokyo) | Short term (≤ 2 years) |
| GW-scale green-hydrogen projects | +0.6% | Middle East, Europe, Australia | Long term (≥ 4 years) |
| Source: Mordor Intelligence | |||


Growing Power Demand in Emerging Economies
Electricity use in emerging markets is increasing at 5-7% annually, pushing utilities to accelerate EPC tenders for gas turbines and utility-scale solar assets that close supply gaps.[2]United Nations Framework Convention on Climate Change, “Net Zero Tracker,” unfccc.int India added 24 GW of renewables in 2024, yet industrial states still record peak shortages that channel USD 8 billion each year into captive EPC contracts.[3] International Energy Agency, “World Energy Outlook 2025,” iea.org Sub-Saharan Africa’s electrification hit 54% in 2025, but grid-extension costs of USD 3,000 per rural connection steer donor programs toward mini-grid EPC packages bundling solar, storage, and prepaid metering. Local fabrication yards and vendor networks gain an advantage because transformer import duties can swell project costs by up to 20%. The contract model is shifting from turnkey lump-sum to EPCM frameworks that leave schedule risk with owners yet preserve contractor equipment margins.[4]Central Electricity Authority of India, “Monthly Generation Report,” cea.nic.in
Accelerated Renewable-Energy Build-Out
Global renewable additions hit 507 GW in 2024, but EPC execution trails equipment availability by 12-18 months due to land and grid connection delays. The 3.5 GW Terra Solar complex in the Philippines demonstrates scale changes; prefabricated racking slashes on-site installation to 14 months on a USD 3.5 billion contract. Offshore wind is spreading into the Atlantic seaboard, yet limited Jones Act vessels move first-turbine dates into late 2026, leaving a USD 12 billion backlog for marine EPC firms. Floating offshore wind below 1 GW today requires niche mooring know-how possessed by fewer than a dozen contractors. Tighter rules, such as the EU’s one-year window for environmental assessments, compel EPC bidders to front-load ecological studies, balancing risk and speed.
National Net-Zero Mandates Unlocking EPC Pipelines
More than 140 countries have set net-zero targets, translating into 1,200 GW of planned generation and 400,000 circuit-km of transmission upgrades by 2035. U.S. tax credits now require 40% domestic steel and 55% domestic labor, reshaping bid teams and excluding foreign contractors from bonus rates. India’s Green Hydrogen Mission calls for 5 million t/year of output, driving 60 GW of renewables and USD 25 billion in EPC contracts. Saudi Arabia’s NEOM green-hydrogen facility broke ground in 2024 with the largest single EPC contract to date at 4 GW of hybrid capacity. Procurement cycles compress from 24 to 12 months, rewarding contractors with modular supply lines.
Hyperscale Data-Center Micro-Grids
Hyperscale data centers consumed 460 TWh in 2024 and may hit 1,000 TWh by 2030 as AI workloads multiply. Operators sidestep 3.7-year grid queues by signing 20-year PPAs linked to co-located generation, such as Microsoft’s 500 MW nuclear offtake in 2024. Black & Veatch and Kiewit launched divisions that bundle substation design, diesel backup, and batteries under a single point of responsibility. Micro-grid EPC margins run 12-15%, almost double utility projects because of condensed schedules and bespoke guarantees. Digital-twin commissioning validates islanding and black-start functions before handover, meeting IEEE 1547 and IEC 62933 standards.
Restraints Impact Analysis*
| Restraint | (~) % Impact on CAGR Forecast | Geographic Relevance | Impact Timeline |
|---|---|---|---|
| High upfront capex and financing risk | -0.8% | Global, acute in emerging markets | Medium term (2-4 years) |
| Global supply-chain volatility | -0.5% | Global, with acute pressure in North America, Europe | Short term (≤ 2 years) |
| Shortage of HVDC/offshore EPC talent | -0.4% | North America, Europe, select APAC markets | Medium term (2-4 years) |
| Permitting delays for large infrastructure | -0.6% | North America, Europe, Latin America | Long term (≥ 4 years) |
| Source: Mordor Intelligence | |||
High Upfront Capex and Financing Risk
Utility-scale projects demand USD 1-4 billion in capital, yet emerging-market debt spreads hover 450-650 basis points over U.S. Treasuries, curbing bank appetite. Currency devaluation of 10% can shave 200-300 basis points off returns when equipment is dollar-denominated. Contractors increasingly structure build-own-operate-transfer deals that defer payment until COD, although balance-sheet exposure limits the number of parallel jobs. Inflation in steel, copper, and cement, up 12-18% between 2023 and 2025, triggers force-majeure claims on fixed-price contracts, steering owners toward cost-plus-fee models.
Permitting Delays for Large Infrastructure
The U.S. average from environmental review to notice to proceed rose to 4.2 years for transmission projects in 2024, up from 2.8 years in 2019. Similar patterns appear in the EU, where cross-border HVDC links require 36-48 months of multi-state approvals. Developers now front-load community engagement and route flexibility, adding 3-5% to soft-cost budgets yet avoiding multi-year litigation. Contractor holding costs rise as equipment sits idle; transformer lead times of 18 months exacerbate delay penalties. These bottlenecks cap the attainable growth rate below component manufacturing levels despite strong demand pull.
*Our forecasts treat driver/restraint impacts as directional, not additive. The impact forecasts reflect baseline growth, mix effects, and variable interactions.
Segment Analysis
By Technology: Renewables Extend Lead
Renewables accounted for 60% of the Power generation EPC market share in generation spending during 2025 and are tracking a 7.8% CAGR to 2031. Utility-scale solar EPC costs have fallen to USD 850 per kW for fixed-tilt arrays, but bifacial modules and trackers add USD 100-150 per kW, compressing contractor margins to 6-8%. Offshore wind maintains gross margins above 12% as unit costs sit near USD 4,000 per kW due to marine logistics. Hybrid solar-storage projects already represent 18% of renewable awards, driven by grid operators mandating 2-4 hours of dispatchable capacity.
Second-order dynamics underpin this lead. Renewable debt lines price at 4-6% in OECD markets compared with 8-12% for coal and nuclear, and lenders prefer the shorter build cycles of solar and onshore wind. Contractors with digital-twin workflows cut commissioning errors by 20%, shortening time to revenue. Stranded-asset concerns degrade new-build coal awards, now just 8 GW, concentrated in a handful of emerging economies. Thermal repowering into gas or biomass offers a niche for brownfield specialists. Nuclear EPC firms bank on small modular reactors, yet first-mover risk and supply-chain depth remain constraints.


By Capacity Band: Distributed Resources Gain Headroom
Projects above 500 MW controlled 51.5% of 2025 spend, leveraging economies of scale that pull EPC cost below USD 1 million per MW for solar and USD 1.5 million for onshore wind. Distributed energy resources under 100 MW, however, are registering the fastest 8.1% CAGR to 2031, riding hyperscale data-center and remote-mining demand for resilience. The mid-tier 100-499 MW band captured 28% share as IPPs and municipal utilities pursue manageable ticket sizes.
Contractors are reorganizing to match this split. Large EPC firms are purchasing micro-grid integrators to tap sub-100 MW work, while pure-play renewable builders form consortia to meet bonding requirements on gigawatt-scale bids. Modular factory pre-assembly trims on-site labor by 30% and compresses schedules by up to three months. Micro-grids under 10 MW grew 11% in 2024, especially among Australian and Chilean mines that cut diesel costs 40-60% with solar-battery hybrids. Data-center solutions in the 50-150 MW range blend gas engines for black start with lithium-ion storage to meet IEEE 1547 compliance.
By End User: IPPs Close Ground
Regulated utilities held 44.8% of 2025 generation spend, yet independent power producers are advancing at a 7.7% CAGR as merchant renewables win corporate PPAs outside utility procurement. Industrial captive power captured 22% by installing 50-200 MW solar-storage hybrids that hedge outage risk in Asia and Africa. Public-sector entities in China and the Middle East issued 18% worth of EPC, backed by sovereign guarantees that lower financing costs.
Corporate PPAs totaling 48 GW in 2024, led by Amazon, Microsoft, and Google, bypass utilities and feed IPP pipelines. Merchant generators undercut regulated tariffs by 10-15% in deregulated markets, pressuring utility EPC backlogs. Smaller manufacturers cluster rooftop solar via virtual power plants, pooling 5-10 MW of capacity to improve creditworthiness. Utilities retain advantages in rate-based financing but increasingly outsource riskier builds through EPCM arrangements that swap fixed-price certainty for schedule agility.
Geography Analysis
Asia-Pacific controlled 59.4% of the power generation EPC value in 2025, fueled by China’s 120 GW annual renewable build and India’s 24 GW addition. China’s coal EPC slipped to 8 GW in 2024 as policy pivots to wind, solar, and nuclear for its 2060 neutrality pledge. India preserved 12 GW of thermal EPC for reliability, but now layers 60% domestic-content rules on solar projects above 500 MW.
South America is the fastest-growing region (power generation EPC) at a 7.5% CAGR through 2031, anchored in Brazil’s 15 GW of 2024 auction wins at sub-USD 30 per MWh rates and Chile’s 25 GW hydrogen-linked pipeline. Argentina and Colombia add niche gas and offshore wind jobs, although currency controls and differing vessel laws adjust cost structures.
North America and Europe share bottlenecks. Interconnection queues defer 60 GW of shovel-ready assets into 2027-2028 and elevate the role of behind-the-meter builds. The Inflation Reduction Act’s domestic-content rules push Fluor and Bechtel to onshore transformers, adding 8-12 months to procurement but unlocking 30% tax credits. Europe’s next growth spurt rests on floating offshore wind platforms where EPC costs sit 40% above fixed-bottom solutions.

Competitive Landscape
The Power EPC Market demonstrates moderate fragmentation: the top 10 contractors capture around 35-40% of global value, yet regional champions enjoy home-market shelter through policy and local-content mandates. Chinese SOEs undercut Western peers by up to 20% but face OECD scrutiny that narrows addressable projects. Indian firms such as Larsen & Toubro and Adani Infrastructure vertically integrate into modules and development, blurring EPC and IPP boundaries.
Western multinationals pursue higher-margin engineering-only roles that earn 10-12% fees while dropping construction risk. Technology is the next moat: Hitachi Energy’s HVDC Light and ABB’s modular multilevel converters enable bidirectional flow and black-start, prized for offshore wind connections. Siemens Energy and GE Vernova embed digital twins to shave 15-20% off commissioning schedules. Disruptors such as Fluence and Wartsila back-integrate into solar EPC, while Autodesk and Bentley Systems license project-management software that captures 2-3% of contract value without balance-sheet exposure.
Power Engineering, Procurement, And Construction (EPC) Industry Leaders
Bechtel Corporation
PowerChina
Larsen & Toubro
Fluor Corporation
Siemens Energy AG (EPC Services)
- *Disclaimer: Major Players sorted in no particular order

Recent Industry Developments
- January 2026: NLC India, representing NLC India Renewables Ltd (NIRL), has put out an EPC tender for a 250 MW/500 MWh battery energy storage system (BESS). Notably, the tender excludes the supply of power transformers. This ambitious project aims to link up with TANTRANSCO substations situated in Annupankulam, Ottapidaram, and Kayathar, all in Tamil Nadu.
- November 2025: US vertically integrated renewable energy company MARS Energy Group has acquired commercial and utility-scale solar solutions provider Nelnet Renewable Energy (NRE), in a drive to enhance its project delivery capabilities and bolster its presence in the Midwest market.
- November 2025: HyperStrong International (Germany) GmbH (HyperStrong), a subsidiary of Beijing HyperStrong Technology Co., LTD. (688411.SH), has partnered with LEAG Clean Power GmbH to ink an EPC contract. Together, they're set to roll out a 1.6 GWh utility-scale battery energy storage system (BESS) project in Germany. Upon its completion, this initiative is poised to rank among Europe's largest battery storage facilities.
- November 2025: Voltalia SA, a French operator of renewable power plants, secured a contract to set up a 73-MW solar park in Castile and Leon, located in northern Spain. The engineering, procurement, and construction (EPC) contract was awarded by Nadara, a European independent power producer, for its San Lorenzo project.


Global Power Engineering, Procurement, And Construction (EPC) Market Report Scope
Power Engineering, Procurement, and Construction (EPC) refers to a comprehensive approach in the energy sector. It involves designing, engineering, procuring, and constructing power plants, including conventional and renewable energy projects. The EPC model is commonly employed for large-scale energy infrastructure projects, such as thermal power plants, hydroelectric plants, wind farms, solar farms, and transmission and distribution networks.
The Power Engineering, Procurement, and Construction (EPC) market is segmented by power generation EPC and power transmission and distribution (T&D) EPC. The power generation EPC market is further segmented by technology, capacity band, end-user, and geography. By technology, the market is segmented into thermal, nuclear, and renewables. By capacity band, the market is segmented into up to 100 MW, 100-499 MW, and above 500 MW. By end-user, the market is segmented into regulated utilities, independent power producers (IPPs), industrial captive power, and the public sector and SOE. The report also covers the market size and forecasts across major regions. The market sizing and forecasts for each segment are based on revenue.
Power Generation EPC
| By Technology | Thermal |
| Nuclear | |
| Renewables | |
| By Capacity Band | Up to 100 MW (DER, micro-grid) |
| 100 to 499 MW | |
| Above 500 MW | |
| By End-User | Regulated Utilities |
| Independent Power Producers | |
| Industrial Captive Power | |
| Public Sector and SOE | |
| By Geography | North America |
| Europe | |
| Asia-Pacific | |
| South America | |
| Middle East and Africa |
Power Transmission and Distribution (T&D) EPC
| By Geography | North America |
| Europe | |
| Asia-Pacific | |
| South America | |
| Middle East and Africa |
| Power Generation EPC | By Technology | Thermal |
| Nuclear | ||
| Renewables | ||
| By Capacity Band | Up to 100 MW (DER, micro-grid) | |
| 100 to 499 MW | ||
| Above 500 MW | ||
| By End-User | Regulated Utilities | |
| Independent Power Producers | ||
| Industrial Captive Power | ||
| Public Sector and SOE | ||
| By Geography | North America | |
| Europe | ||
| Asia-Pacific | ||
| South America | ||
| Middle East and Africa | ||
| Power Transmission and Distribution (T&D) EPC | By Geography | North America |
| Europe | ||
| Asia-Pacific | ||
| South America | ||
| Middle East and Africa | ||


Key Questions Answered in the Report
What is the forecast value of the Power EPC Market by 2031?
The Power EPC Market is projected to reach USD 2,120.01 billion by 2031, sustaining a 6.97% CAGR between 2026 and 2031.
Which technology leads current Power EPC spending?
Renewables account for 60% of 2025 generation EPC value and are growing at 7.8% annually through 2031.
Which region is growing fastest for Power Generation EPC contracts?
South America is the fastest-expanding region, advancing at a 7.5% CAGR on the back of Brazilian auctions and Chilean hydrogen projects.
Why are hyperscale data centers important to Power EPC growth?
Data centers bypass grid queues by funding on-site micro-grids, a segment that carries 12-15% EPC margins and is scaling rapidly.
What restrains faster Power EPC deployment in mature markets?
Extended permitting cycles, averaging 4.2 years in the United States, and talent shortages in HVDC and offshore wind delay project starts.
How concentrated is the competitive landscape?
Global market concentration sits at 3 on a 1-10 scale, with the ten largest contractors holding about 35-40% of total revenue but facing strong regional competition.
Page last updated on:


