Market Overview
| Study Period | 2021 - 2031 |
|---|---|
| Forecast Data Period | 2026 - 2031 |
| Base Year Market Size (2025) | 3.99 Thousand gigawatt |
| Market Volume (2026) | 4.33 Thousand gigawatt |
| Market Volume (2031) | 6.52 Thousand gigawatt |
| Growth Rate (2026 - 2031) | 8.51% CAGR |
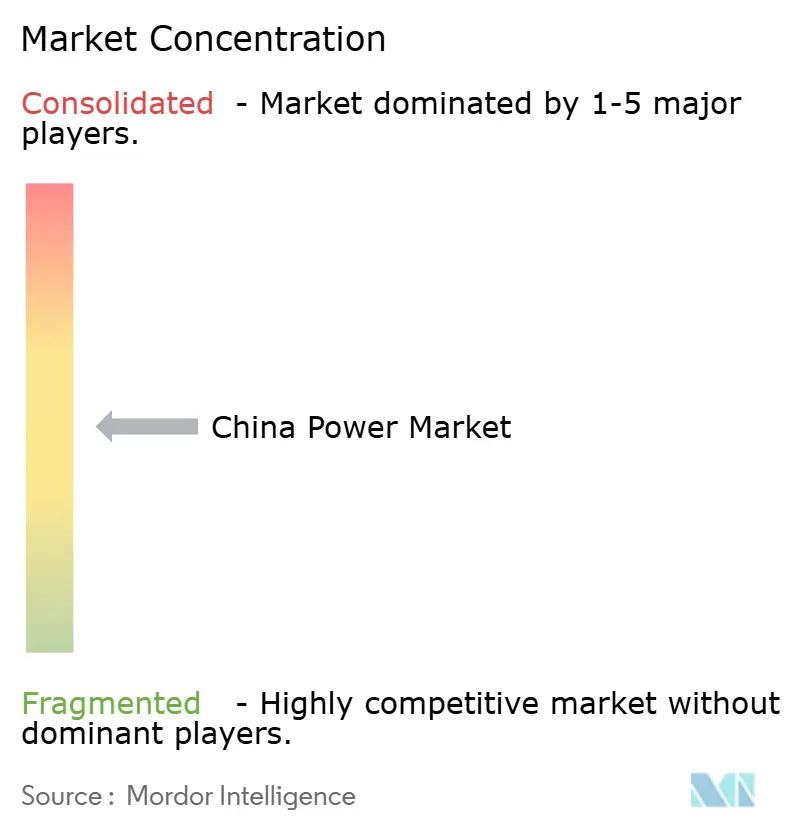
| Market Concentration | Medium |
Major Players *Disclaimer: Major Players sorted in no particular order Image © Mordor Intelligence. Reuse requires attribution under CC BY 4.0. | |

China Power Market Analysis by Mordor Intelligence
The China Power Market size is expected to grow from 3.99 Thousand gigawatt in 2025 to 4.33 Thousand gigawatt in 2026 and is forecast to reach 6.52 Thousand gigawatt by 2031 at 8.51% CAGR over 2026-2031.
Rapid solar and wind installations, aggressive ultra-high-voltage (UHV) transmission roll-outs, and electrification of transport and industry are reshaping supply–demand dynamics. Policy instruments such as green electricity certificates, capacity-payment pilots, and provincial renewable quotas are accelerating the shift from coal toward clean power while opening new revenue channels for asset owners. Competition is intensifying as state-owned majors pursue hybrid renewable-plus-storage clusters, and technology firms enter energy-storage and demand-response niches. The growing sophistication of wholesale markets, along with plunging equipment costs, positions the Chinapowermarket to become the world’s first “electrostate,” where electricity directly underpins economic growth.
Key Report Takeaways
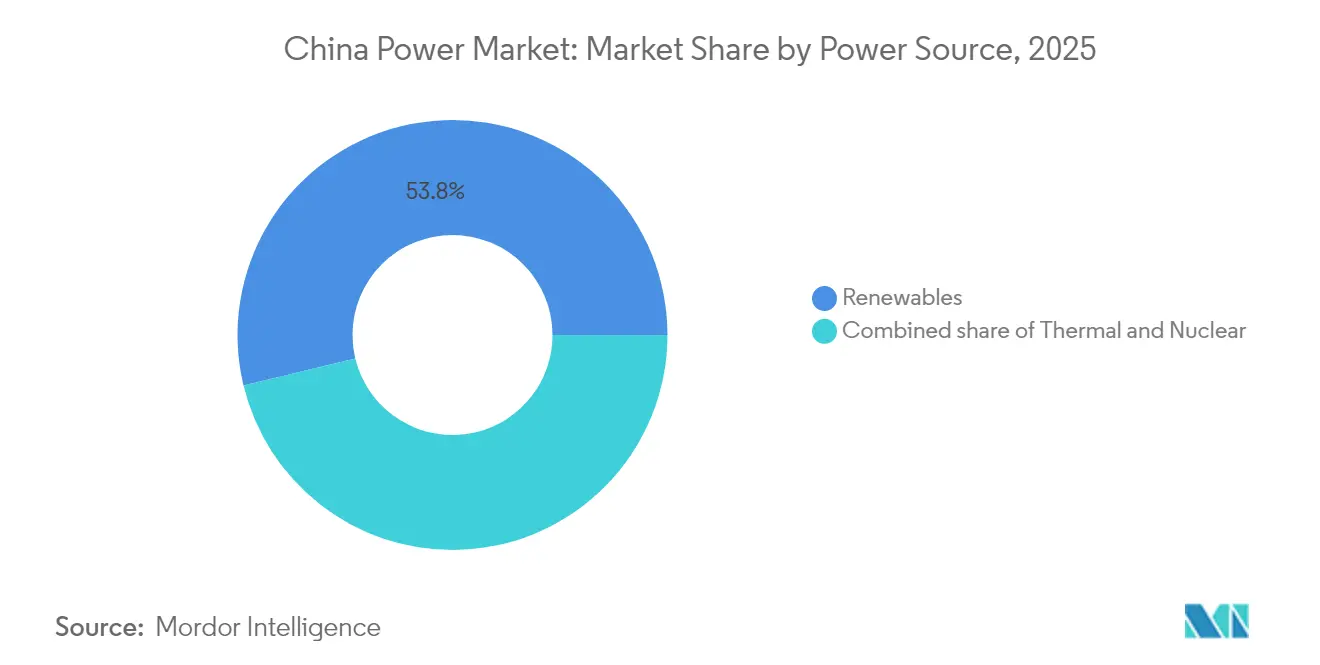
- By power source, renewables commanded 53.78% of capacity in 2025 and are advancing at a 12.12% CAGR to 2031, while coal delivered 60% of generation, yet faces the steepest retirement schedule.
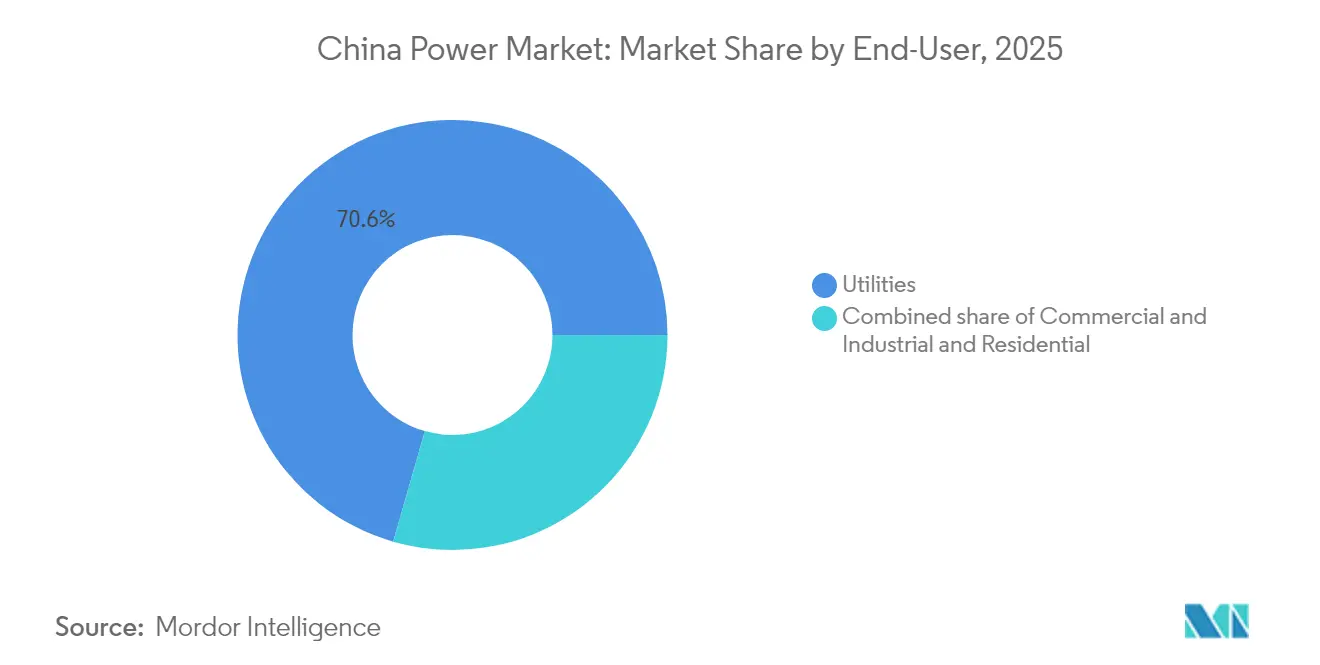
- By end user, utilities captured 70.55% of demand in 2025 and are forecast to grow at a 9.74% CAGR as EVs and process heat electrification lift centralized consumption.
Note: Market size and forecast figures in this report are generated using Mordor Intelligence’s proprietary estimation framework, updated with the latest available data and insights as of 2026.
China Power Market Trends and Insights
Drivers Impact Analysis*
| Driver | (~) % Impact on CAGR Forecast | Geographic Relevance | Impact Timeline |
|---|---|---|---|
| Accelerated Grid-Parity Solar Auctions | +2.1% | National, with concentration in Shandong, Jiangsu, Guangdong | Short term (≤ 2 years) |
| Provincial Renewable Portfolio Quota Compliance | +1.8% | National, strongest enforcement in coastal provinces | Medium term (2-4 years) |
| Carbon-Neutral 2060 Roadmap Reshaping Capacity Mix | +2.5% | National, prioritizing western renewable bases and eastern demand centers | Long term (≥ 4 years) |
| Electrification of Transport & Process Heat Boosting Load | +1.4% | National, led by Yangtze River Delta, Pearl River Delta, Beijing-Tianjin-Hebei | Medium term (2-4 years) |
| Spot Market & Capacity-Payment Pilots Improving ROI | +0.9% | 8 pilot provinces including Guangdong, Shandong, Shanxi | Short term (≤ 2 years) |
| Green-Bond-Fuelled Low-Cost Project Finance | +0.7% | National, concentrated in renewable and UHV transmission projects | Short term (≤ 2 years) |
| Source: Mordor Intelligence | |||
Accelerated Grid-Parity Solar Auctions Drive Market Transformation
Mandatory competitive bidding from 2025 replaces feed-in tariffs, compelling developers to price entirely on economics while retaining regional flexibility in auction design. The policy arrives amid manufacturing overcapacity in panels, nudging weaker firms out and encouraging consolidation. Simultaneously, spot-price exposure drives interest in storage-coupled projects that flatten revenue risk, positioning the Chinese power market for deeper merchant activity.[1]National Development & Reform Commission, “Notice on improving renewable electricity market mechanisms,” ndrc.gov.cn
Provincial Renewable Portfolio Standards Enforce Clean-Energy Mandates
Mandatory quotas backed by a fast-growing green-certificate market, 327% trading-volume growth in 2024, tie provincial energy-intensity goals to renewable procurement. Resource-rich western provinces monetize excess generation by selling certificates to demand-heavy coastal hubs, stimulating cross-regional flows and distributed solar uptake.[2]“Green power trading up 327% year on year,” China Daily, chinadaily.com.cn
Carbon-Neutral Roadmap Accelerates Coal-Plant Retirement Schedules
Capacity-payment mechanisms now compensate coal units for grid-stability services rather than energy, shortening economic lifespans and encouraging retrofits that enable fast ramping. Divergent regional timelines manage winter-heating security in the north while permitting faster retirements in the south, boosting storage and demand-response investment.
Industrial Electrification Expands Beyond Traditional Applications
Process-heat conversions to electric furnaces, heat pumps, and thermal batteries are gathering pace, aided by falling renewable costs and nascent carbon pricing. Manufacturing of clean-tech goods alone consumed 300 TWh in 2024, reinforcing demand growth within the China power market.
Restraints Impact Analysis*
| Restraint | (~) % Impact on CAGR Forecast | Geographic Relevance | Impact Timeline |
|---|---|---|---|
| Stranded-Asset Risk from Coal Retirements | -1.2% | National, concentrated in Shanxi, Inner Mongolia, Shaanxi coal bases | Medium term (2-4 years) |
| Renewables Curtailment in Remote Provinces | -0.8% | Xinjiang, Gansu, Inner Mongolia, Qinghai | Short term (≤ 2 years) |
| Land-Use & Ecological Caps on Mega Hydro/Wind | -0.5% | Yunnan, Sichuan (hydro); coastal provinces (offshore wind) | Long term (≥ 4 years) |
| Retail-Tariff Ceilings Limiting Cost Pass-Through | -0.6% | National, most binding in residential and small commercial segments | Medium term (2-4 years) |
| Source: Mordor Intelligence | |||
Stranded-Asset Risks Challenge Coal-Dependent Regions
Accelerated retirement and reduced dispatch hours threaten balance-sheet health for state generators and local economies reliant on coal. Financial scrutiny is rising as lenders factor carbon prices and lower capacity factors into credit terms. Coordinating exit schedules with replacement resources remains critical for winter-heating reliability.
Renewable Energy Curtailment Constrains Western Development
Despite 100.5 billion kWh of renewable electricity transmitted eastward in 2024, periodic oversupply continues. Storage additions jumped to 74 GW last year, but economics remain tight where curtailment costs undercut storage revenue. Enhanced forecasting and regional trading platforms are gradually improving dispatch efficiency.[3] “Curbs on western solar output persist despite new UHV lines,” Science and Technology Daily, stdaily.com
*Our forecasts treat driver/restraint impacts as directional, not additive. The impact forecasts reflect baseline growth, mix effects, and variable interactions.
Segment Analysis
By Power Source: Renewables Dominate Capacity Additions
Renewables held 53.78% of the capacity in 2025, and their share of the China power market size is on track to exceed 65.7% by 2031 as additions compound at a 12.12% CAGR. Solar capacity alone climbed to 842 GW in 2024, following another 300 GW surge, with N-type TOPCon modules outpacing PERC variants in cost-performance metrics. Offshore wind in Jiangsu, Guangdong, and Fujian now hosts 45 GW; 18 MW machines deliver capacity factors above 55%, trimming levelized costs to CNY 0.30 per kWh. Hydro sits near its ecological ceiling of 420 GW, so incremental pumped-storage is the primary growth vector, targeting 100 GW by 2030. Biomass, geothermal, and tidal remain below 50 GW combined due to feedstock and site limits.
Thermal capacity accounts for 39.5% of China's power market share, yet coal still supplies 60% of the country's generation, given higher utilization rates. Natural-gas units now total 130 GW, expanding at a rate of 5.84% annually to meet peaking demand, despite LNG prices exceeding USD 12 per million British thermal units (mmBtu). Nuclear, at 57 GW in 2024, benefits from 24 reactors under construction and 11 new approvals, driving a path toward 150 GW by 2035 with a capacity factor of over 90%. Oil and diesel remain marginal, restricted to islanded grids and backup roles.


By End User: Utilities Lead Demand Growth
Utilities controlled 70.55% of 2025 demand and will grow at a 9.74% CAGR, cementing their dominance within the Chinese power market. State Grid’s 1.5 million-km network and China Southern’s 300,000 km grid absorbed CNY 520 billion in 2024 investment, much of it for UHV links and digital automation. Virtual power plant pilots in Jiangsu aggregated 8 GW of distributed assets, providing peak shaving that deferred costly substation projects. Renewable priority dispatch is compressing coal capacity factors and accelerating portfolio rebalancing.
Commercial and industrial users represented 22.85% of consumption in 2025 and are expected to climb 7.31% annually as factories and data centers install behind-the-meter solar-plus-storage systems to hedge tariff risk. Guangdong allows factories with a capacity of≥10 MW to sign bilateral contracts, resulting in a 10-15% reduction in electricity bills. Hyperscale data centers consumed 200 TWh in 2024 and pledged to achieve a 100% renewable supply by 2030. Residential customers, accounting for 6.60% of demand, face tighter efficiency codes that reduce per-capita use by 8% from 2019 to 2024, even as rooftop-solar mandates add 15 GW of new capacity each year. Grid connection and tariff clarity gaps still slow adoption in Tier 2 and Tier 3 cities.
Geography Analysis
East China, with 32.15% of 2025 generation, pairs high economic density with the most advanced smart-grid deployments. Shanghai’s spot-price signals guide peak shaving, and corporate green-certificate trades spearhead national best practices. Strong industrial electrification, particularly in semiconductors and EV manufacturing, underpins steady demand growth that anchors the broader China power market.
Northwest China posts the fastest growth at 8.44% CAGR through 2031. Solar radiation and wind resources support gigawatt-scale bases such as Alxa and Hami. UHV projects send surplus output eastward, yet curtailment persists during low-demand windows, spurring rapid storage uptake and local hydrogen pilots.
South China benefits from a subtropical climate that supports year-round rooftop PV and air-source heat-pump adoption. China Southern Power Grid’s multiyear upgrade improves interconnection with the national backbone, enabling greater renewable imports. North China undertakes staged coal decommissioning while rolling out electric boilers for district heating.
Central China’s role as a conduit for west-to-east flows gains importance with each new UHV line, adding compound-growth leverage to the China power market. Southwest provinces continue leveraging vast hydropower yet face stricter environmental caps; pumped-storage expansions cushion variability. Northeast provinces, transitioning from heavy industry, pilot virtual-power-plant algorithms that aggregate wind, solar, and demand-response assets into dispatchable blocks.
Competitive Landscape
Five state-owned generation groups, China Huaneng, China Energy Investment, China Huadian, China Datang, and State Power Investment, control 45% of installed capacity, fostering a moderate-concentration environment. “Managed competition” aligns investment plans with state targets, yet firms still vie for project quotas, particularly in hybrid renewable hubs and energy-storage tenders. State Grid and China Southern Power Grid preserve regional monopolies in wires, but regulatory reforms compel open access for distributed resources and third-party retailers, altering revenue structures.
Technological edge acts as a clear differentiator. China Three Gorges’ integrated solar-wind-storage complexes, SPIC’s early move into PV module manufacturing, and CEIC’s pilot sodium-ion storage plant illustrate innovation-driven positioning. Foreign entrants partner on advanced batteries and power electronics, adding pressure on incumbents to accelerate R&D. The green-certificate regime shifts valuation toward low-carbon portfolios, prompting portfolio realignments and asset swaps among the big five to meet regional carbon budgets.
Second-tier provincial generators and private IPPs exploit niche opportunities in distributed solar, waste-to-energy, and data-center power services. Digital-native firms leverage AI forecasting and blockchain settlement to aggregate flexible loads, signaling an evolving ecosystem within the Chinese power market where value migrates toward orchestration of diverse assets rather than pure megawatt ownership.
China Power Industry Leaders
State Grid Corporation of China
China Energy Investment Corp (CHN Energy)
China Huaneng Group Co. Ltd.
State Power Investment Corp (SPIC)
China Datang Corporation Ltd.
- *Disclaimer: Major Players sorted in no particular order

Recent Industry Developments
- June 2025: China commissioned the world’s first grid-forming sodium-ion battery storage plant, enhancing system inertia and reducing lithium supply risk. The plant, with a capacity of 200MW/400MWh, is designed to support over 30 local wind and solar power stations.
- January 2025: State Grid Corporation unveiled a record USD 88.7 billion investment plan for the year, prioritizing UHV corridors and distribution digitalization.
- July 2024: China Three Gorges began constructing an 8 GW solar park in Inner Mongolia, among the world’s largest single-site projects. This project is part of a larger 18 GW integrated energy project, including wind, coal-fired power, and energy storage.
- July 2024: Gansu–Zhejiang ±800 kV UHV line commenced construction, spanning 2,370 km with CNY 35.3 billion investment. This line will transmit electricity from the western province of Gansu to the eastern province of Zhejiang, passing through four other provinces along the way.


China Power Market Report Scope
Power generation is electricity generated through various primary sources such as coal, hydro, solar, thermal, etc. In utilities, it’s a step before its delivery to its end users. Then, the process is followed by transmission and distribution. Under this, the power generated is distributed via high-voltage lines (transmission lines) and low-voltage lines (distribution lines) as per the requirement of the end user.
The Chinese power market report includes:
By Power Source
| Thermal (Coal, Natural Gas, Oil and Diesel) |
| Nuclear |
| Renewables (Solar, Wind, Hydro, Geothermal, Biomass & Waste, Tidal) |
By End User
| Utilities |
| Commercial and Industrial |
| Residential |
By T&D Voltage Level (Qualitative Analysis only)
| High-Voltage Transmission (Above 230 kV) |
| Sub-Transmission (69 to 161 kV) |
| Medium-Voltage Distribution (13.2 to 34.5 kV) |
| Low-Voltage Distribution (Up to 1 kV) |
| By Power Source | Thermal (Coal, Natural Gas, Oil and Diesel) |
| Nuclear | |
| Renewables (Solar, Wind, Hydro, Geothermal, Biomass & Waste, Tidal) | |
| By End User | Utilities |
| Commercial and Industrial | |
| Residential | |
| By T&D Voltage Level (Qualitative Analysis only) | High-Voltage Transmission (Above 230 kV) |
| Sub-Transmission (69 to 161 kV) | |
| Medium-Voltage Distribution (13.2 to 34.5 kV) | |
| Low-Voltage Distribution (Up to 1 kV) |


Key Questions Answered in the Report
How large is the China power market in 2026?
Installed capacity reached 4.33 Thousand gigawatt in 2026 and is forecast to climb to 6.52 Thousand gigawatt by 2031.
What is driving the rapid growth of renewables in China?
Grid-parity auctions, provincial quota mandates, cheaper TOPCon modules, and UHV transmission corridors are enabling solar and wind additions at a 12.12% CAGR.
Which end-user group is growing fastest?
Utility demand is rising at a 9.74% CAGR due to electrification of transport and industrial heat processes.
How are coal assets being managed amid decarbonization?
Operators convert subcritical units to flexible peakers and rely on capacity payments, but stranded-asset risk remains material.
What role does storage play in integrating renewables?
Four-hour lithium-ion systems and pumped-hydro projects provide intraday balancing, with mandates requiring 10-20% storage pairing for new renewable plants.
Which companies lead China’s power equipment supply?
Goldwind in wind turbines, Longi in solar modules, and CATL in grid-scale batteries hold dominant domestic shares.
Page last updated on:


